


#138 Supplemental Data
BTC "purrin' like the king of the pride..."

This post contains the key technical data and metrics used to create the weekly update released each Monday morning.
1. Total Market Weekly Structure
No New Changes - Most Recent Update April 27, 2025:
(Chart: Link)

Trend: Remains structurally bullish.
Key Levels: Closest resistance at $3.62T. Closest support at $2.46T.
Confirmation Watch: Awaiting 2 consecutive red candles plus a weekly close below $2.97T (at the time of writing) to confirm a resistance.
Potential Scenarios:
Bearish: Market Cap hasn’t set a new all time high close (yet?). If valuation turns down from here and breaks below $2.46T, it would be a macro lower high, confirming a shift towards a bearish trend and bear market.
2. Total Market Daily Structure
No New Changes - Most Recent Update April 22, 2025:
(Chart: Link)
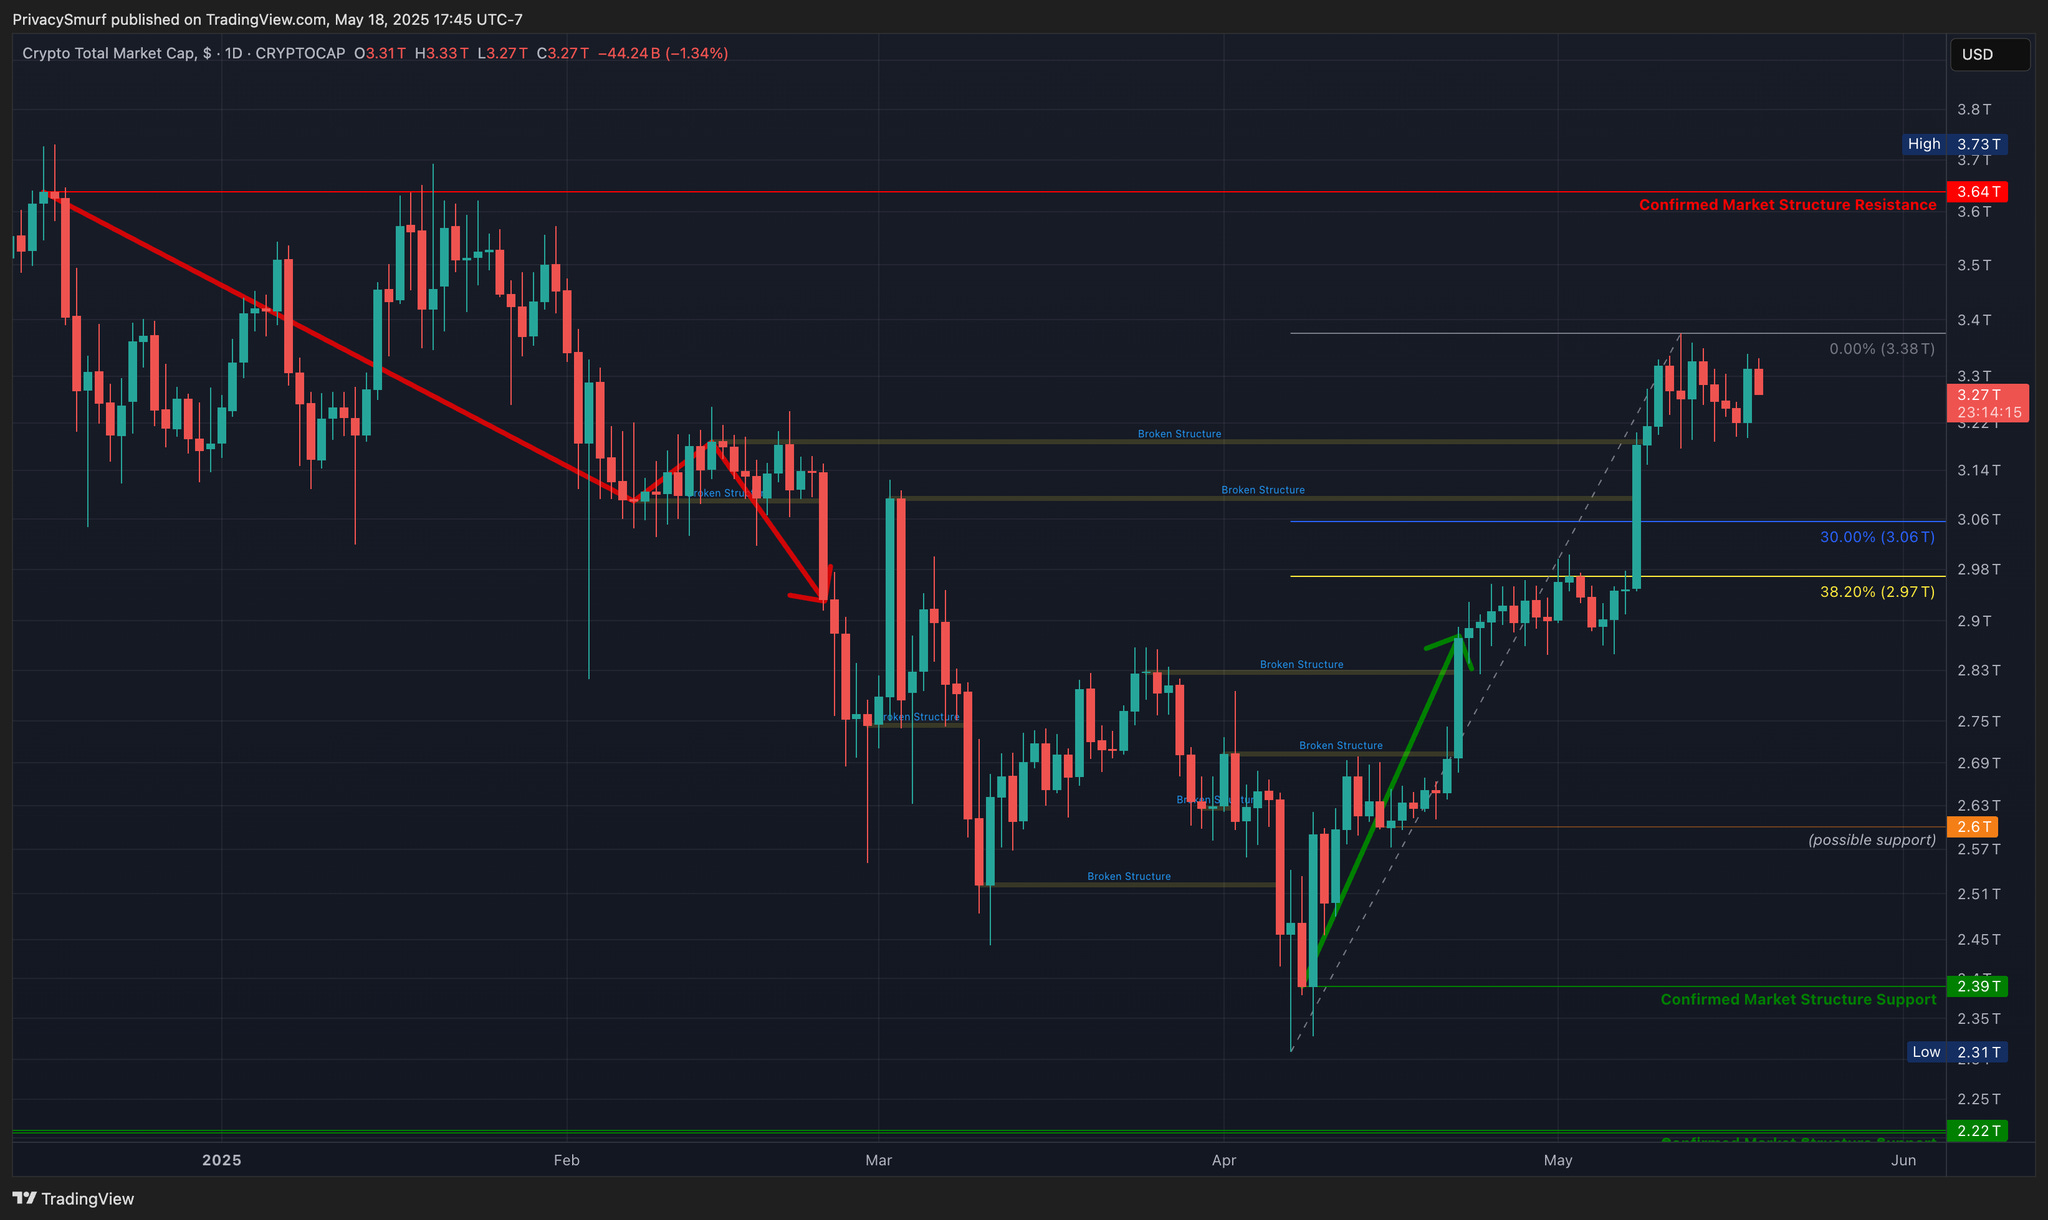
Trend: Bullish. Two prior resistances were broken, qualifying as a trend shift by my rules.
Key Levels: Next closest resistance at $3.64T. Closest support at $2.6T.
Confirmation Watch: Awaiting a close below $2.97T (at the time of writing) to confirm a resistance.
Potential Scenarios:
Bullish: A pull back confirming a resistance would be a step towards making a traditional transition to a bullish trend (low, high, higher low, higher high). Anchoring from the low at $2.6T we would be confirming the high and follow on higher low.
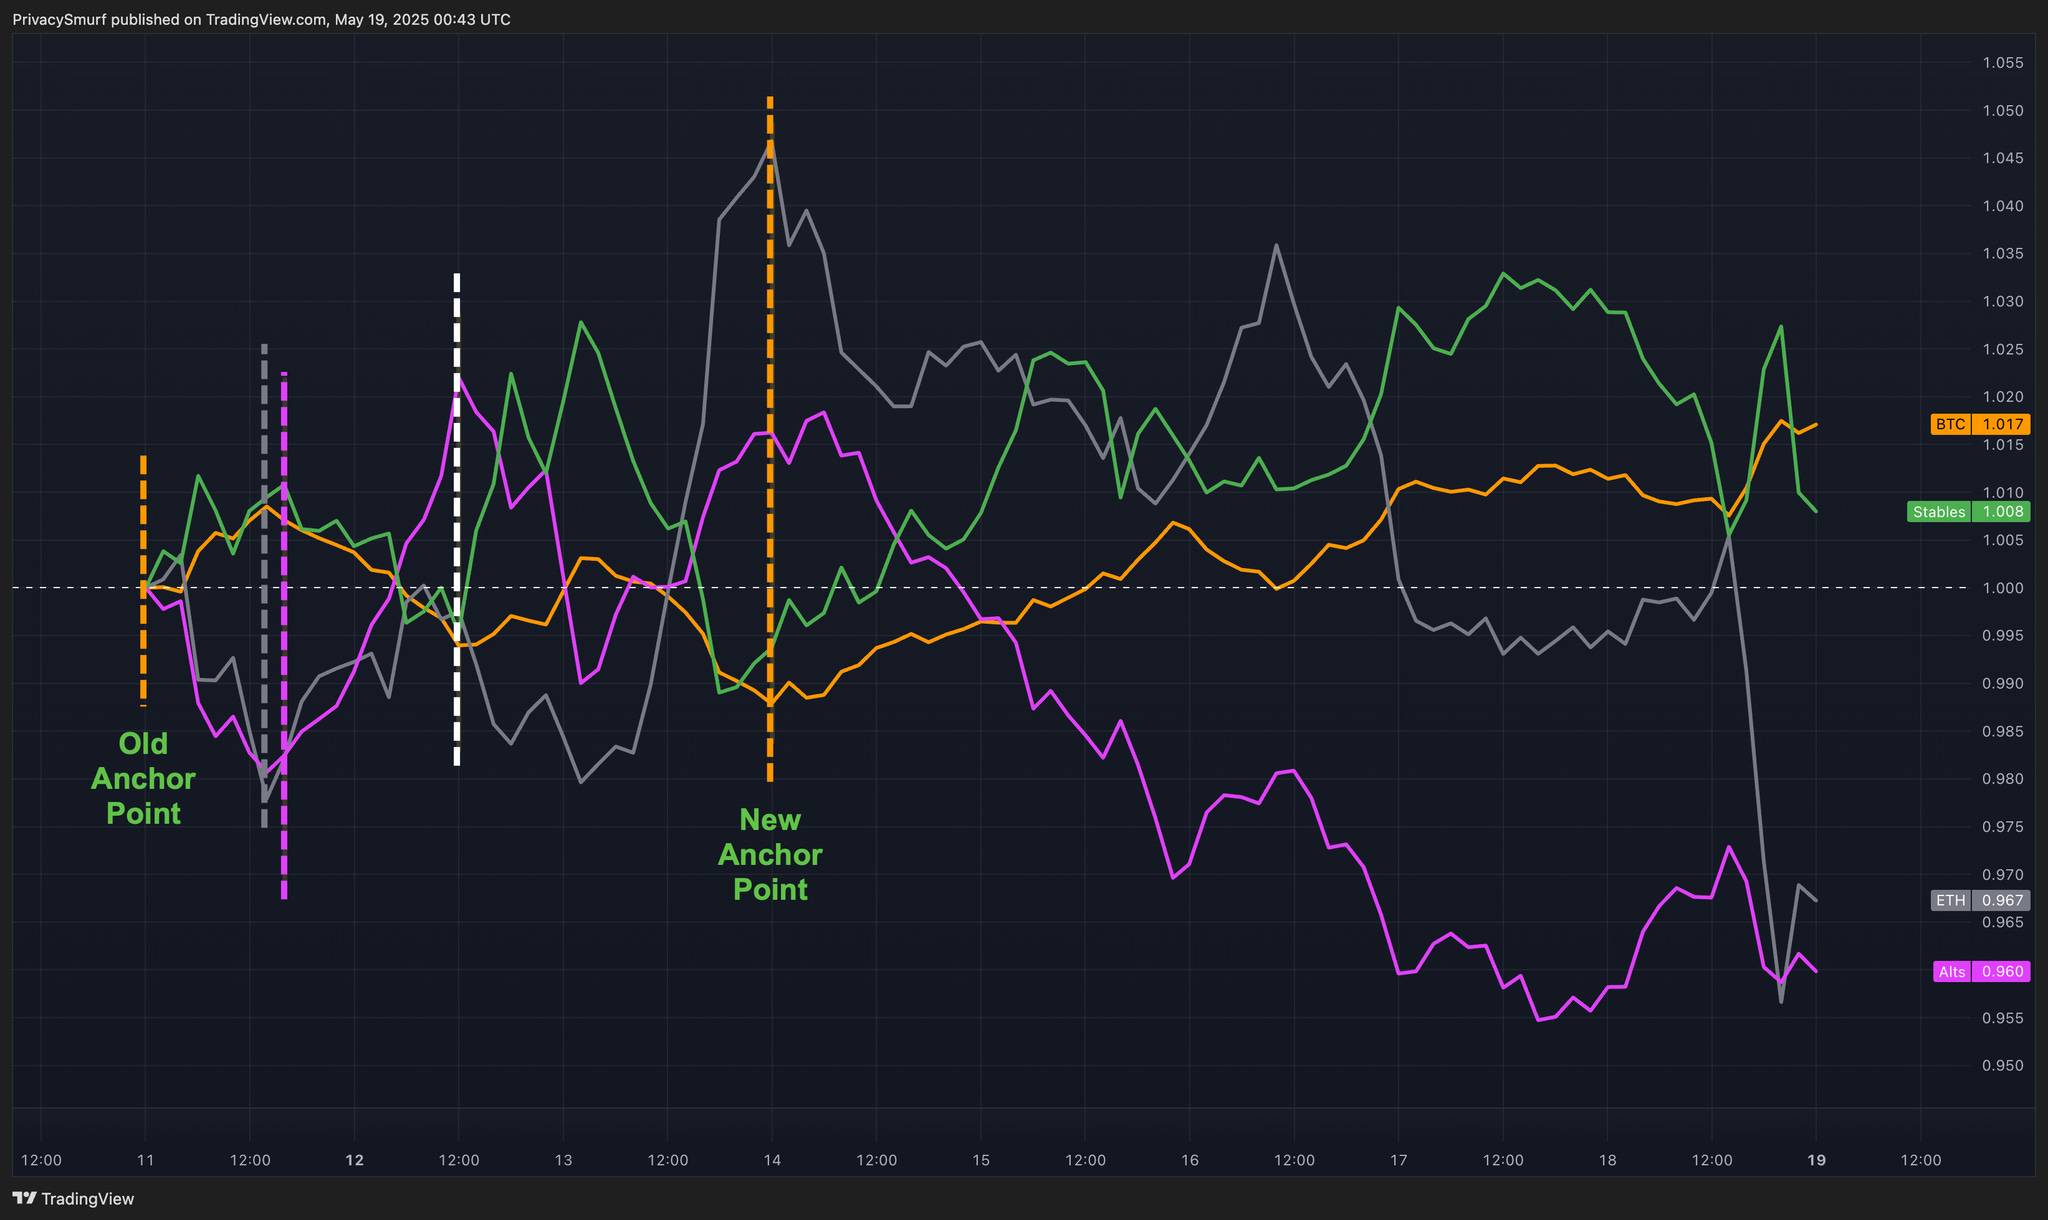
3. Crypto Money Flow
New Changes!! - Most Recent Update May 14, 2025:
(Chart: Link)

Anchor point: May 14, 2025, 00:00 UTC.
Observation: The prior rotation is complete and Bitcoin (BTC) market cap along with Stablecoins (Stables) has begun to increase while Ethereum (ETH) and Altcoins (ALTs) decline.
Interpretation: This shift into ETH and ALTs and subsequent rally on those assets has played out. Now we monitor techicals to determin if this will present as a reaccumulation of BTC for a continued rally or is a protective measure out of ETH and ALTs prior to a market-wide decline. Technical signals and price action are where this will be identified.
Past Observation: Below we can observe the BTC market cap increasing followed by the typical rotation into ETH as BTC declined (after vertical gray dashed line) and this was followed by the typical rotation into ALTs (vertical fuchsia dashed line). The vertical dashed white line is marks the start of a period of time not dominated by any particula asset class. I’d interpret this as the distribution of profits and mixed intentions of market participants. After the new anchor point we clearly see BTC and stables emerge as the dominant assets, increasing while ETH and ALTs decrease.
4. Additional Metrics
Retail Sentiment:
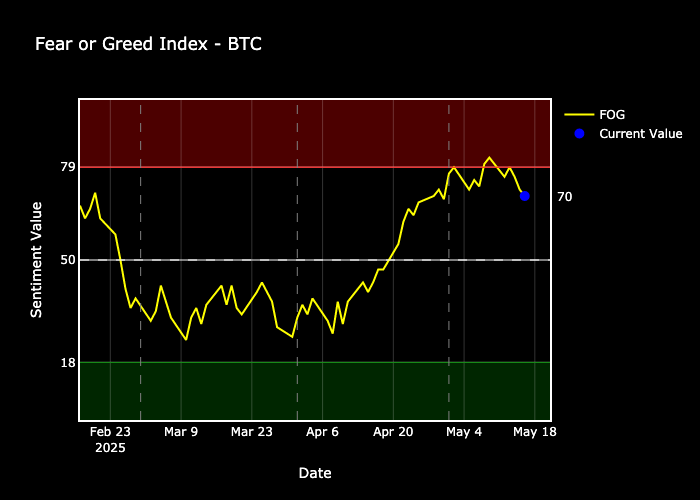
Highly Bullish (on the descent from Extreme Greed). The decline from extreme greed is paired with a daily chart bearish divergence trade signal. It will be interesting to see if sentiment continues to decline around expectations of a false breakout from Sunday’s price action. There’s nothing more to be gleaned from the chart.
Market Validity Score:
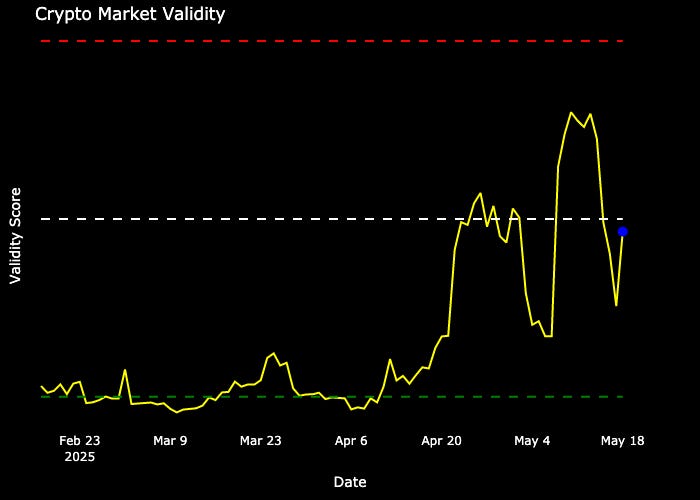
Most assets show a bearish daily structure. There’s nothing more to be gleaned from this chart. The large fluctuations are caused by lower cap coins teetering back and forth above and below resistances.
Market Drivers:
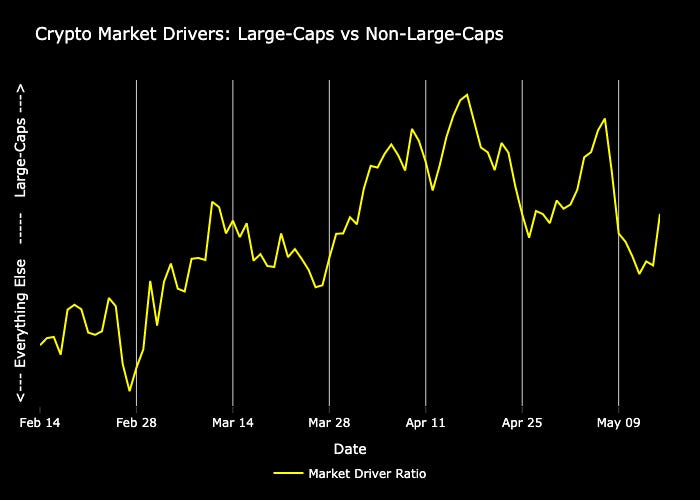
The Market Driver Ratio tracks whether large-cap cryptocurrencies or smaller altcoins are leading the market by measuring their relative performance. When the line rises, Large Caps are outperforming; when it falls, smaller cryptocurrencies are showing relative strength. I’ll have a post dedicated to this analysis out soon.
While the Market Validity shows that all assets have recently improved structures (despite being majority bearish), we can see on the Driver Chart that Large Caps are leading the shift more. This can be a precursor to both bullish and bearish moves. The critical part is that low caps aren’t moving as much right now, and opportunities lie more in the large caps.
Click the links below if you need a refresher on the sections above.
@ThePrivacySmurf