

2022 Q1 Forecast: Own Life
2022 Q1 Forecast: Own Life
You should get a life of your own...

 by Vindata | Listen online for free on SoundCloud")
“… more commas, need more dollars.
I been running at the mileage, b*tch I’m on the paper chase.
Ain't nobody tryna get in my way.
I'm just tryna get a hold of my fate.
I can't be jumping out my seat for everybody's minor needs.
That don't make me selfish baby, that don't make me mean.
I got my own life.
And you should get a life of your own now.”
Here we are, a new quarter, a new year, a clean slate. A chance for everyone to strive for thier goals and move towards all the things they didn’t achieve in the previous year. There’s no time like to present to reevaluate how you did things before and layout how you can change. Keep the focus on your personal development and try not to be distracted by all the many things that can keep you from reaching your goals. Maybe some of those goals can be accomplished through gains in the markets. Here’s what I’m looking at to “get a hold of my fate” and maybe how you can “get a life of your own”.
I could go back and talk about all the things I got right last year that lots of people missed but that’s not gonna help anyone today. I’ve got a lot of things that I want to do this year in the newsletter and I’m glad you are all here to experience that with me. I know it will be of value for you all. The quarterly forecasts are how I outline my moves across the market. It is a framework, not a direct action plan. Throughout the quarter I look at the charts and use price action-based cues or technical signals to time and confirm my entries on assets I want to be exposed to. The process is the same as the weekly updates I post.
FIRST, WE LOOK AT BTC/USD, the honey badger of the crypto space.

Below we have the price cycle forecast of BTC on the daily chart. The wavy line on the chart is the forecast of price directionality The cycle forecast is linked to the time scale on the bottom, NOT on the price scale to the right. The jagged black line is the daily closes of BTC.

Takeaway: The forecast is projecting the potential for bullish prices into early January and a decline for the rest of the month. Another rally is projected in early February and a strong decline through the rest of February into early March. Bearish divergences on intraday timeframes (2HR-6HR charts) may be key to timing market turns at each of these peaks in January and February. If the decline in Feb does end up being a deep correction bullish divergences on the daily chart would be the signal I’d look for to be confirmation of the bottom of the long-term downtrend started from the November peak.
ETH/BTC is stop number 2. This shows where the most value will be gained between the two main assets and if you should be exposed to altcoins or not.
Below we have a similar cycle forecast but an interesting setup. Following typical market rotations, ETH will be gaining in value over BTC in late January. ETH and alts tend to lag BTC in market movements. The interesting part is the earlier bottom in late February in this value relationship.
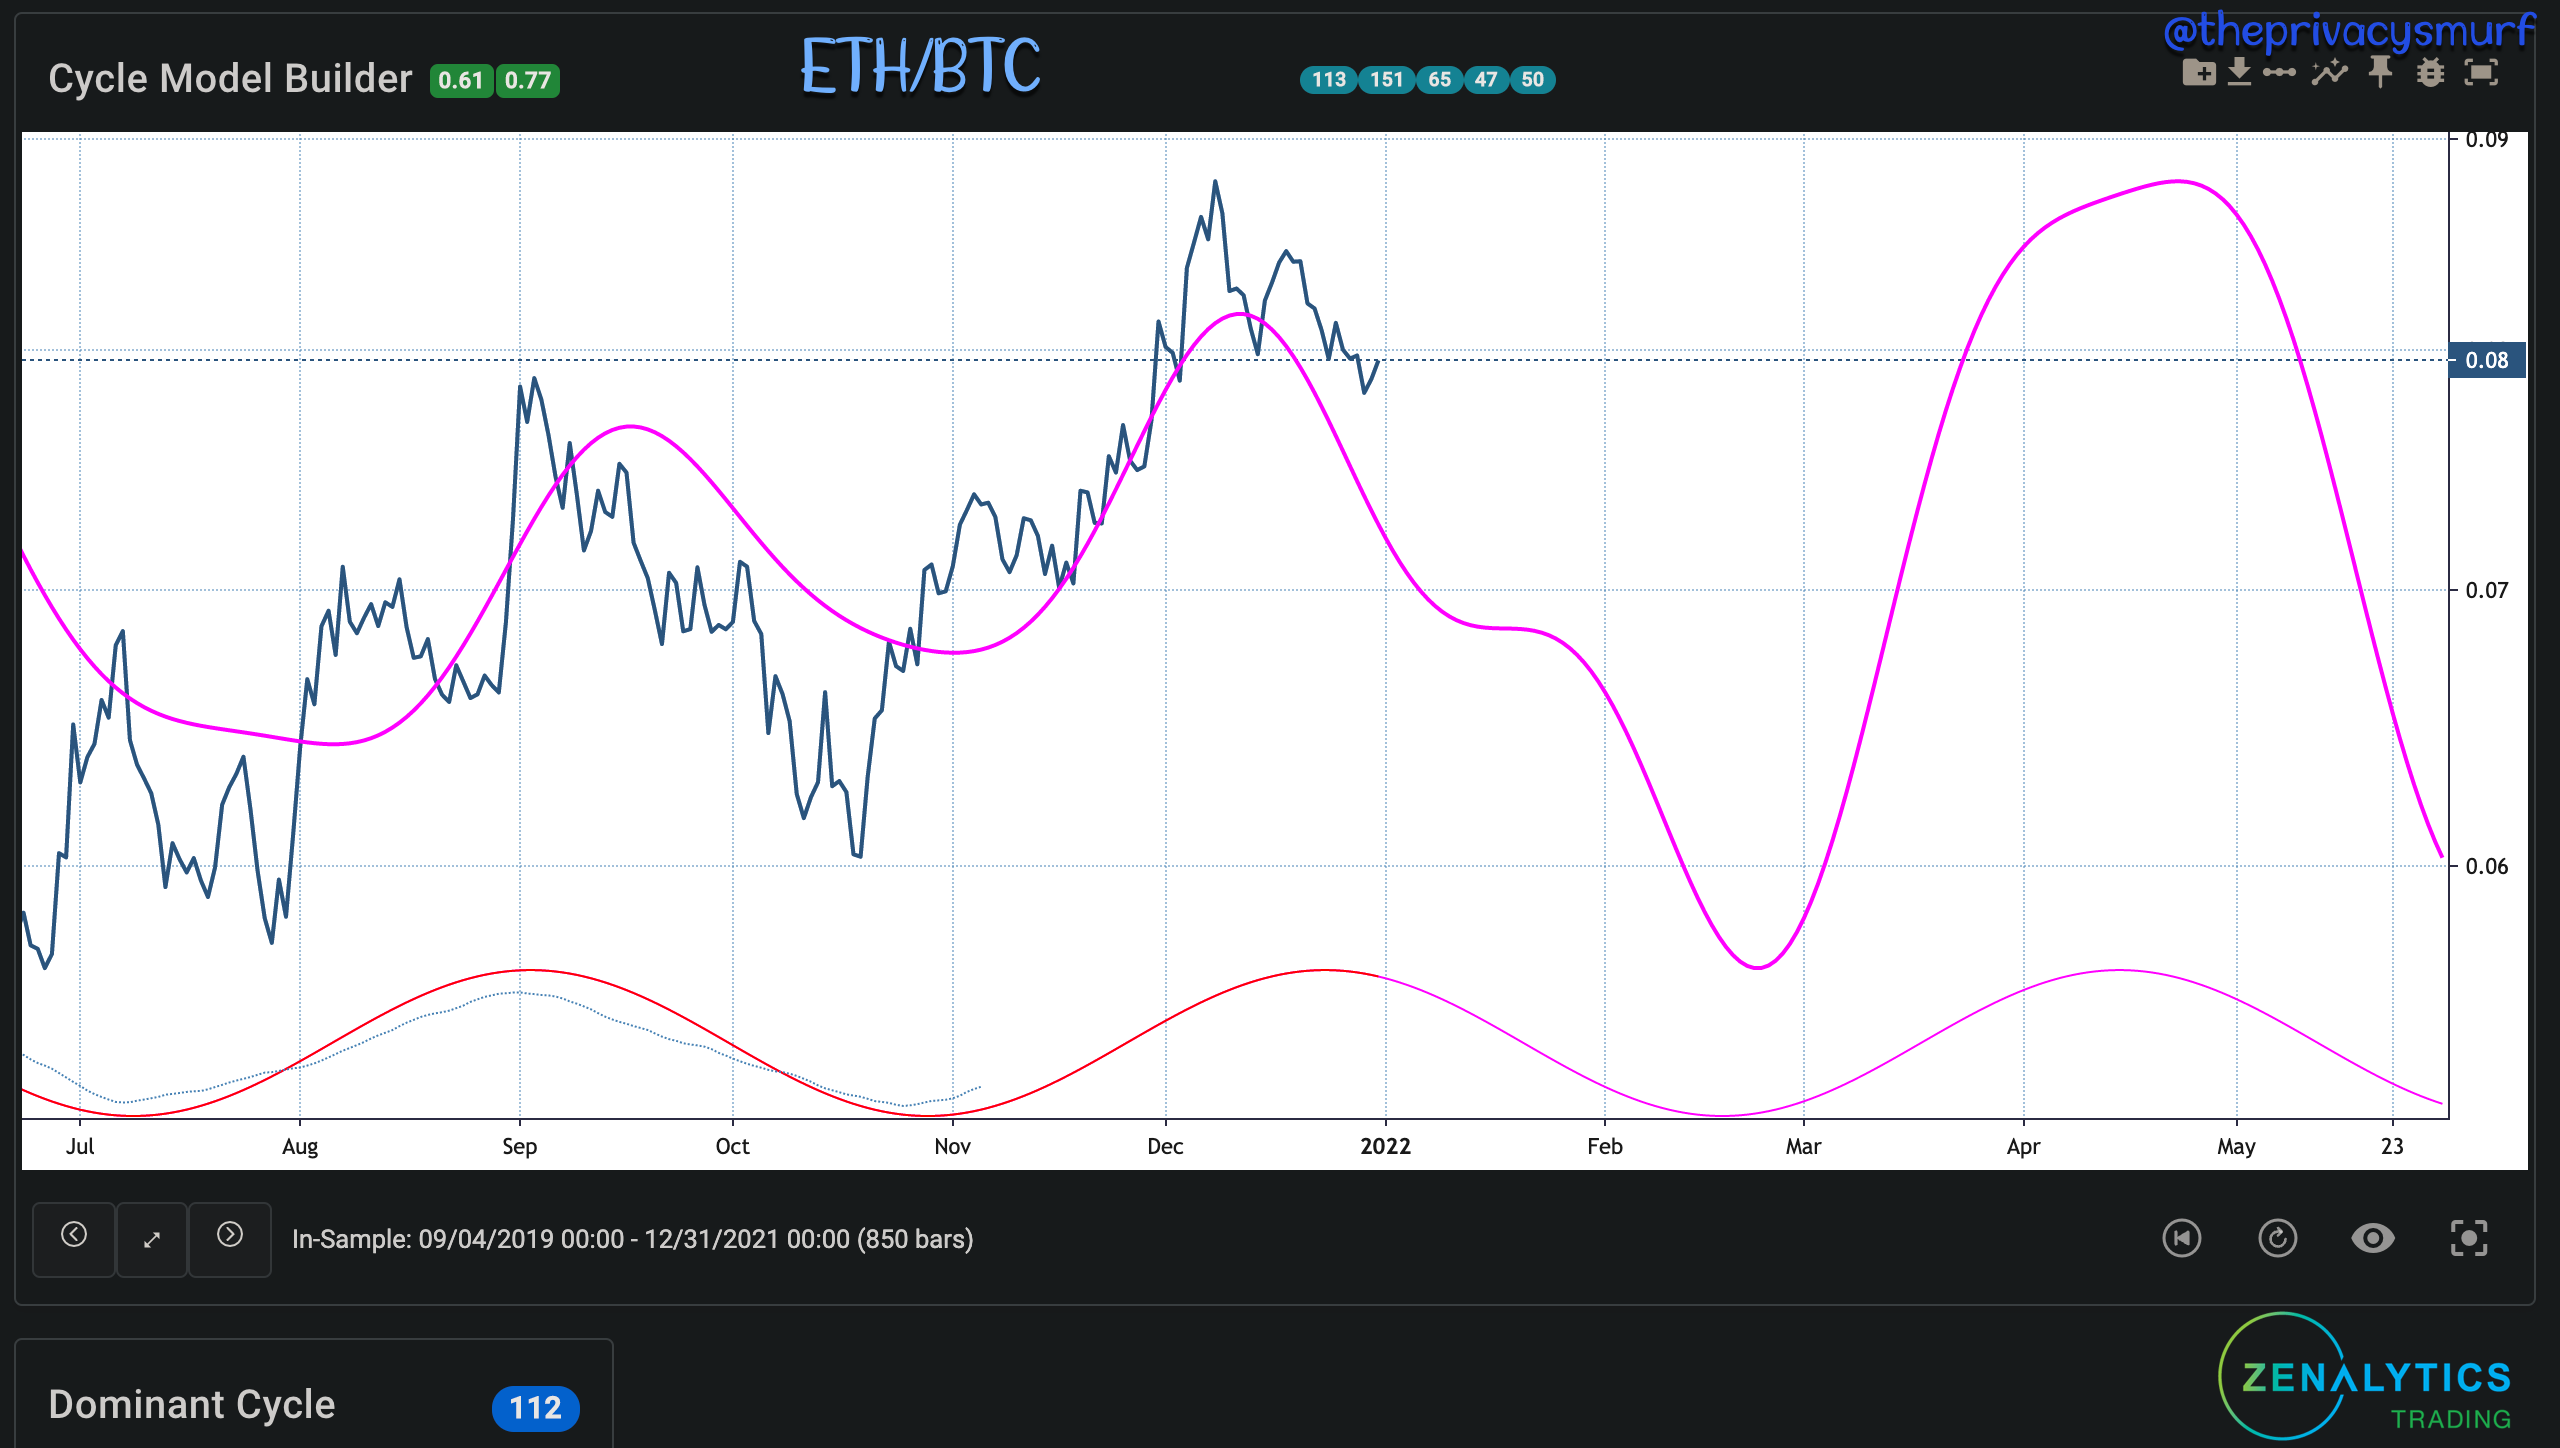
Takeaway: Same as the BTC chart, a daily chart bullish divergence in late February may be key to rotating some BTC into ETH to take advantage of the better returns. Intraday bullish and bearish divergences will help time the market turns in January but with these two apex assets, it may just be best to take the longer play and ride the bearish action from Dec all the way down to February and then back up again through early summer.
Finally, ETH/USD completes the base outline.
Below ETH looks strikingly similar to the BTC forecast at the top with the current downtrend bottoming around mid-January and a brief rally into early February before resuming the cyclical downtrend into early March.
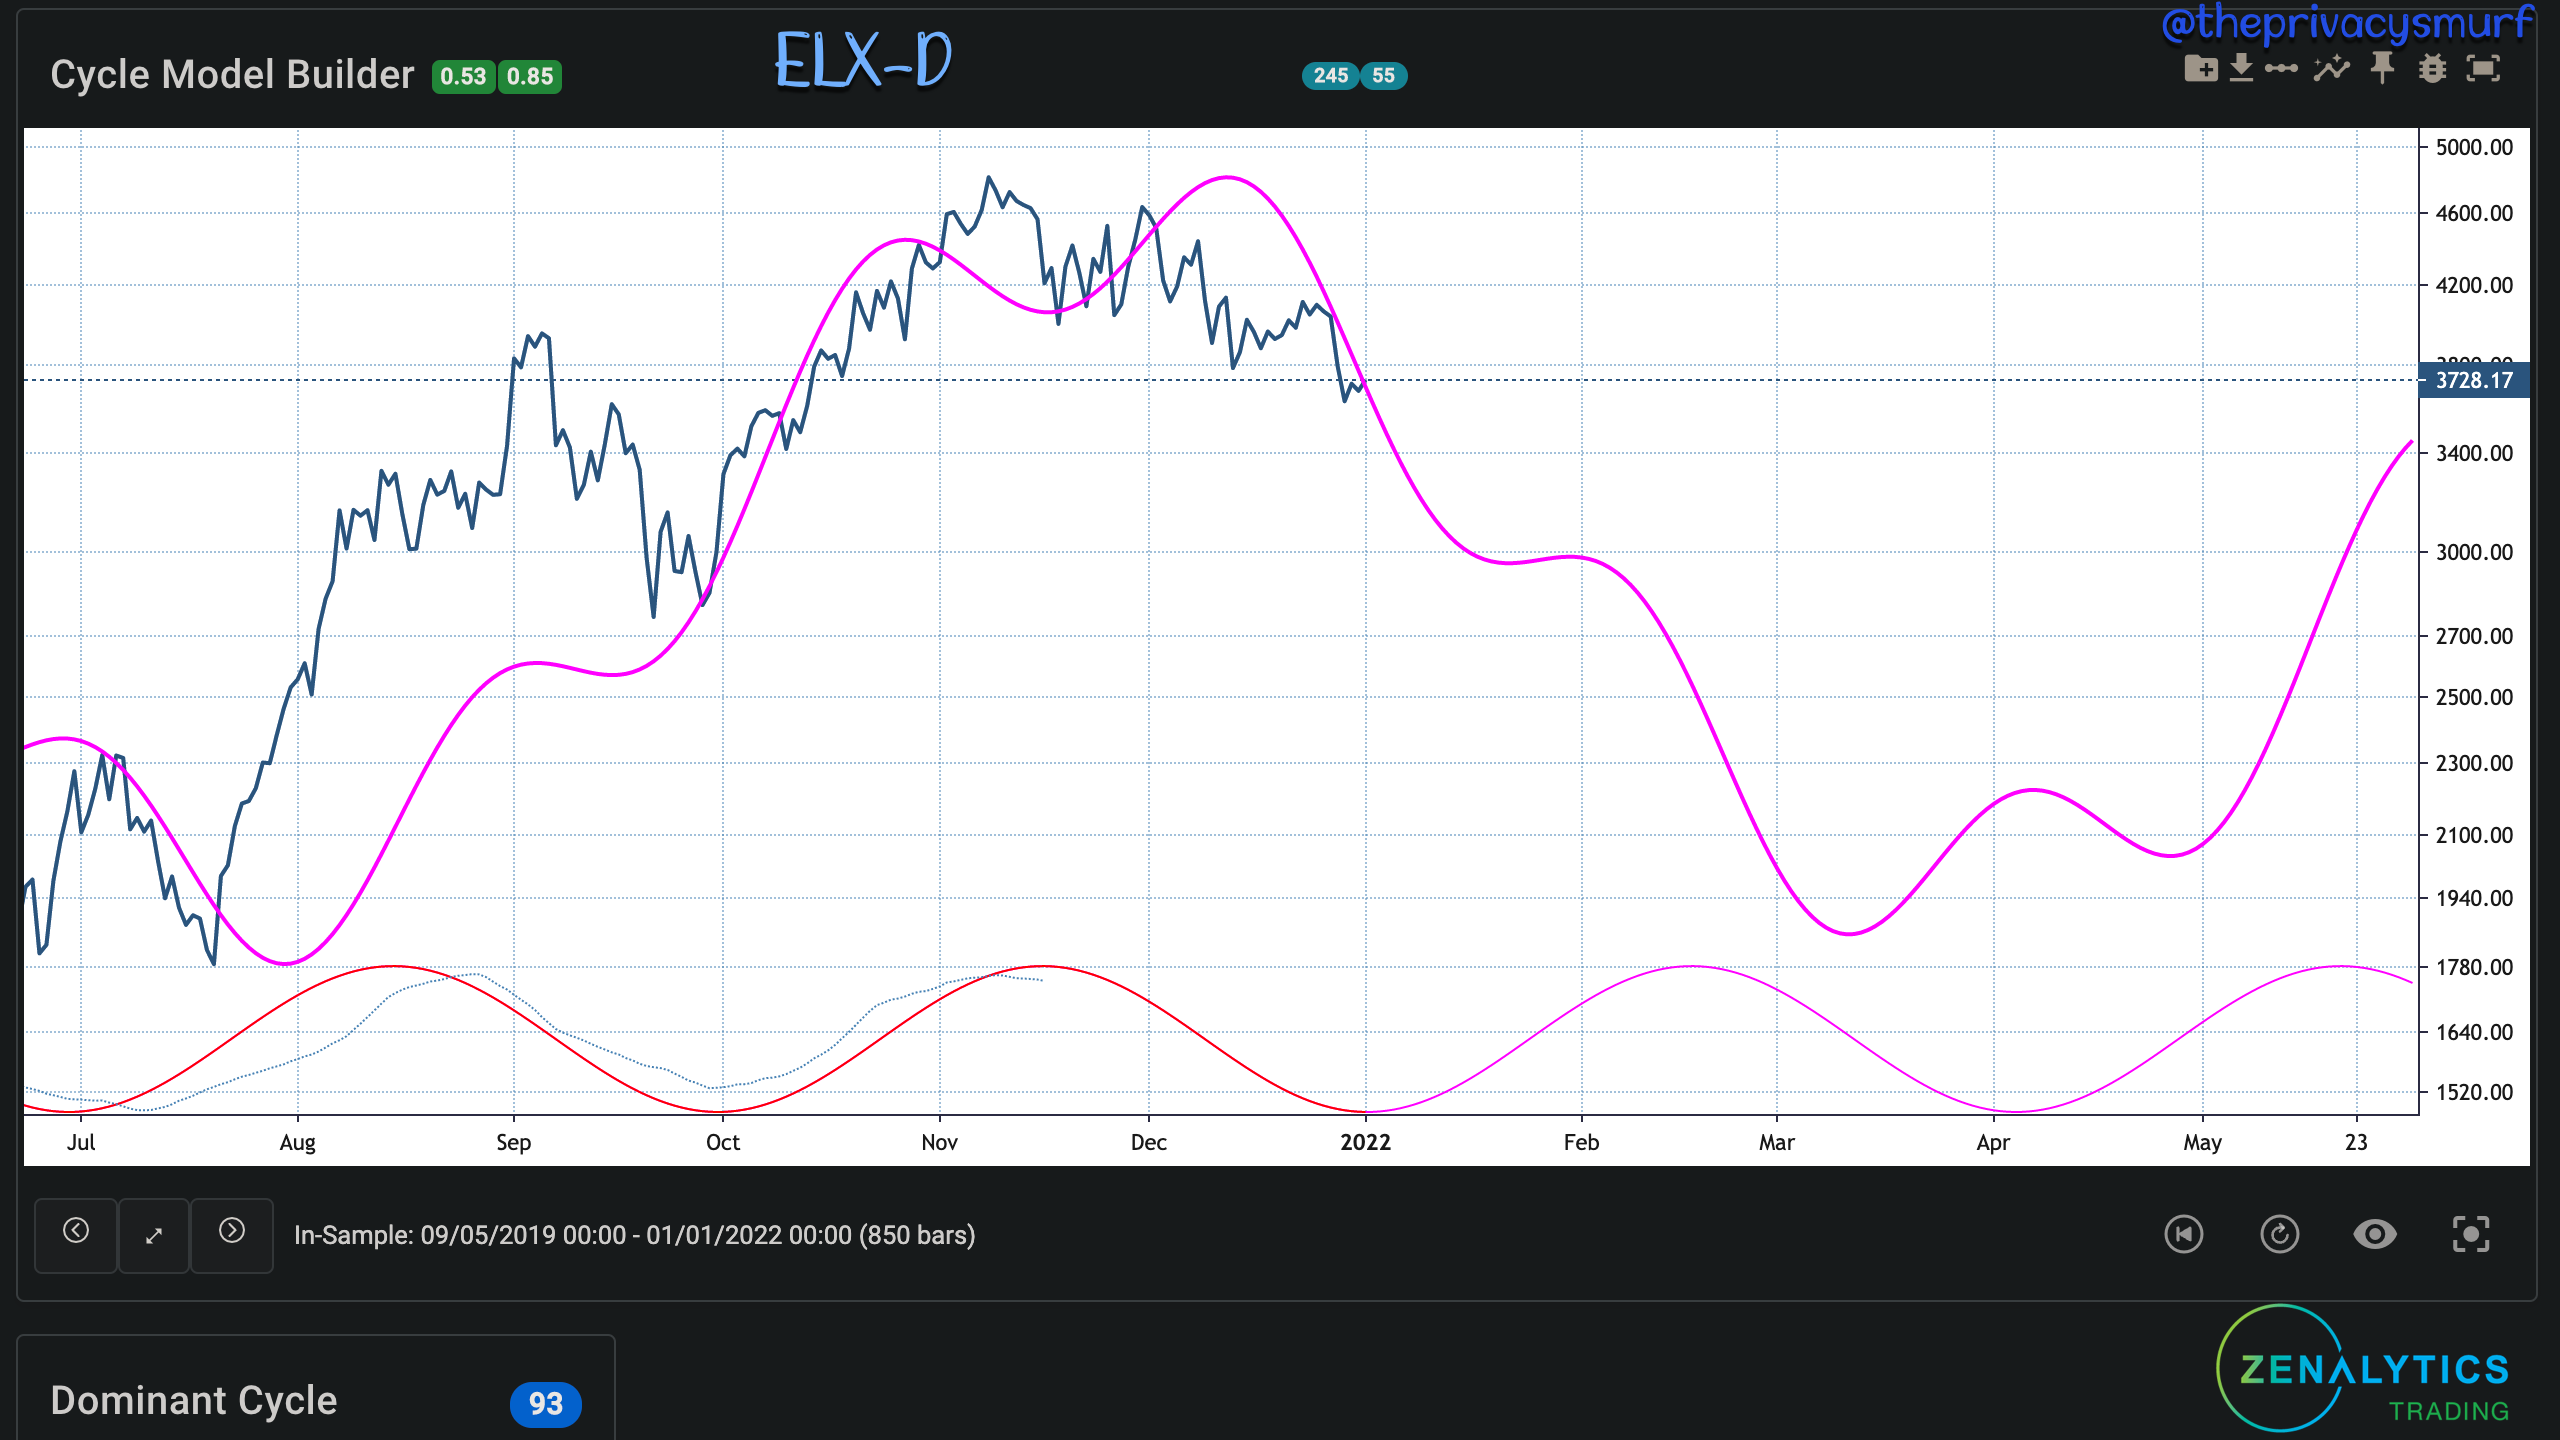
Takeaway: Intraday chart divergences (2HR-6HR) will give signals for the turns in January and February and daily signals will give signals for the bottoming period in March. While the ETH/USD and BTC/USD charts look similar the differences in the ETH/BTC chart will be critical to position yourself depending on what asset you are buying with. IF you are buying with USD follow the USD charts. If you are buying with BTC follow the ETH/BTC chart. You can also use the ETH/BTC to time a bullish move even if ETH/USD doesn’t show the particular signal yet because ETH will still be gaining in value relative to BTC so no matter the relative of USD value you are still beating the market (BTC).
Public Sentiment is another consideration.
The Fear and Greed Index (https://alternative.me/crypto/fear-and-greed-index/) is a measurement of public sentiment and other various measurements. It is commonly used as a contrarian signal. In general, the public is wrong at the market at extremes. When most people are afraid the market is near a bottom and when most people are exuberant the market is near a top. Using this indicator in isolation and buying at a particular reading is the wrong approach. You could end up buying every dip into oblivion. Sometimes the public is afraid for the right reasons.
The Fear and Greed Index linked above is showing an increase in greedy sentiments and topping around Feb.

Takeaway: This increase in greed lines up with the rally in the BTC and ETH charts leading into February and the decline down into March. Note how this particular index tends to plateau around the peaks instead of making V-shaped tops and bottoms. Timing with this particular type of reading can be quite difficult as the slightest reversals may seem to be a reprieve but end up being back to the same levels a few days later. Multiple forms of confirmation should be used instead of just looking at Fear and Greed.
My custom “Smurf Sentiment Index” is similar to the Fear and greed index but instead of measuring feelings/sentiment, it’s measuring actual positions of retail traders. Sentiment in my opinion can be misleading, wrong, or just lied about, while actions can’t be mistaken or obfuscated. The cycle forecast here is showing a peak to match the potential January rally and an interesting later peak in March.
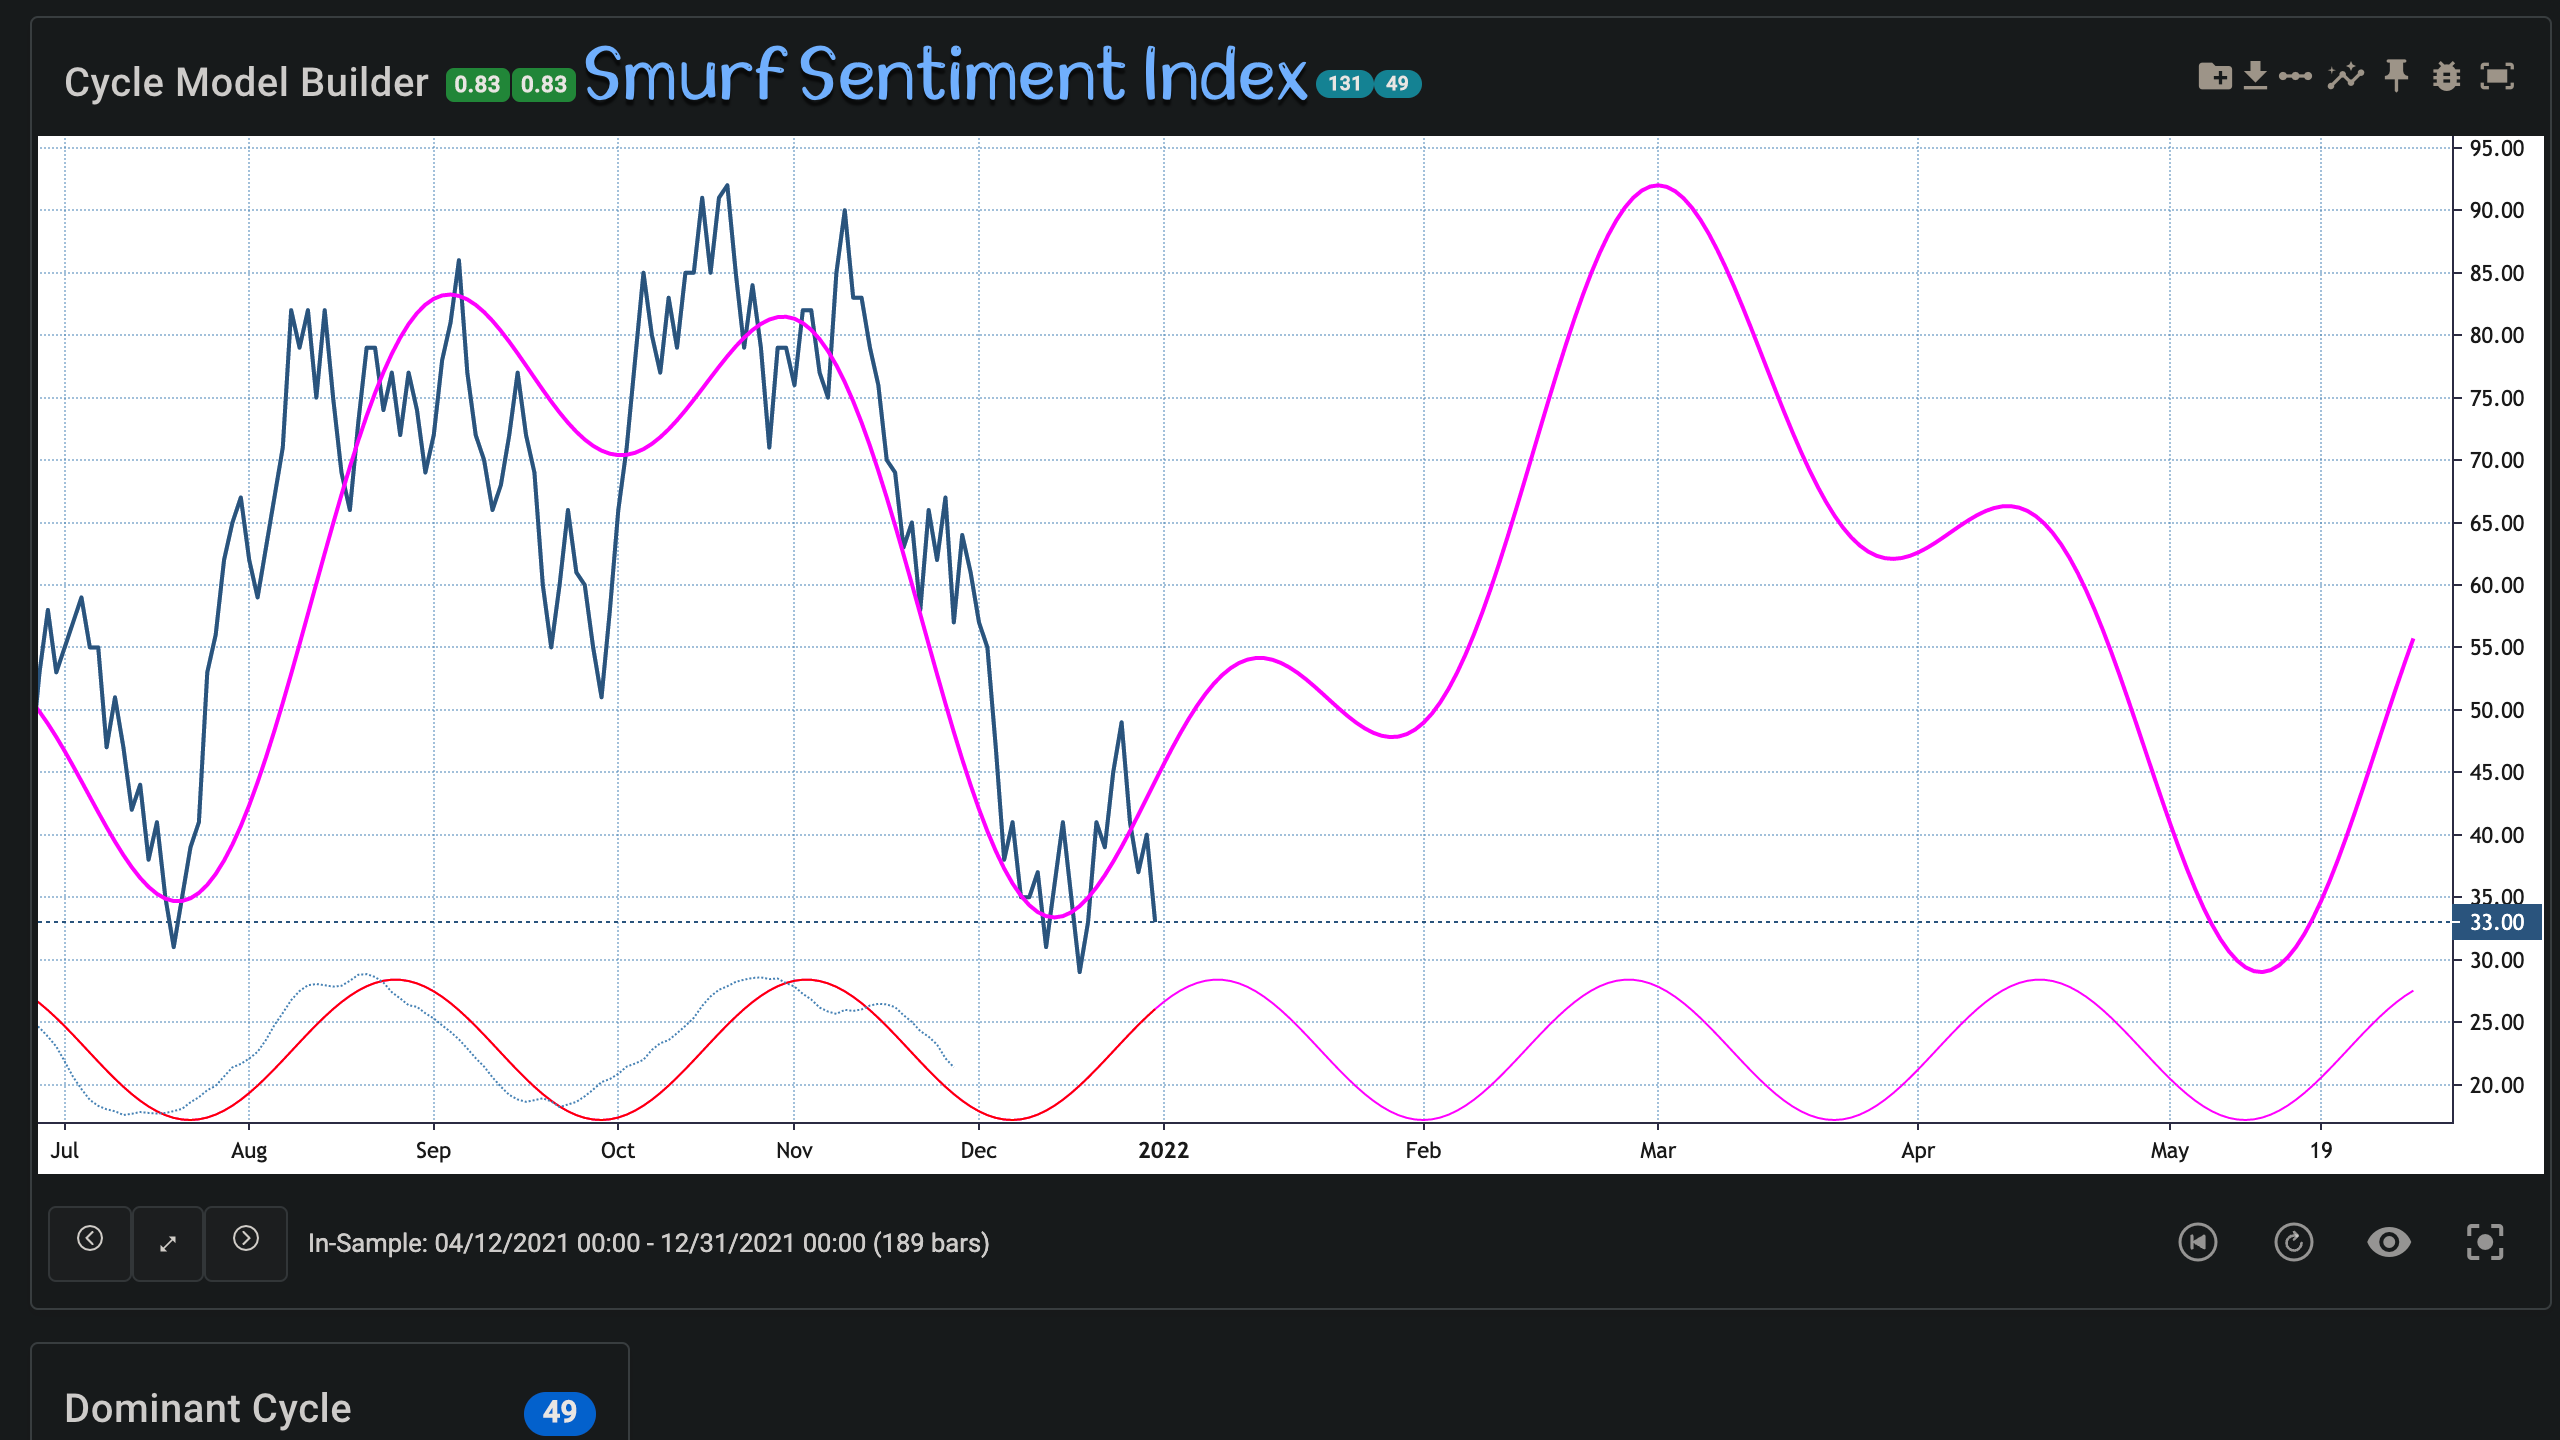
Takeaway: The peak in late Feb/March I’m honestly not really sure what to think. Perhaps the bottoming that occurs in late February/early March is bough up aggressively and will contribute to the higher greed measurements. It’s also possible that this particular cycle is not strong and will end up shifting back to the later dates to match other charts.
Everyone likes a little Volatility.
Volatility isn't really great to plot with a price chart because it’s really just a display of intraday price action. The higher the volatility the larger the range price that will be covered in a bar/candle.
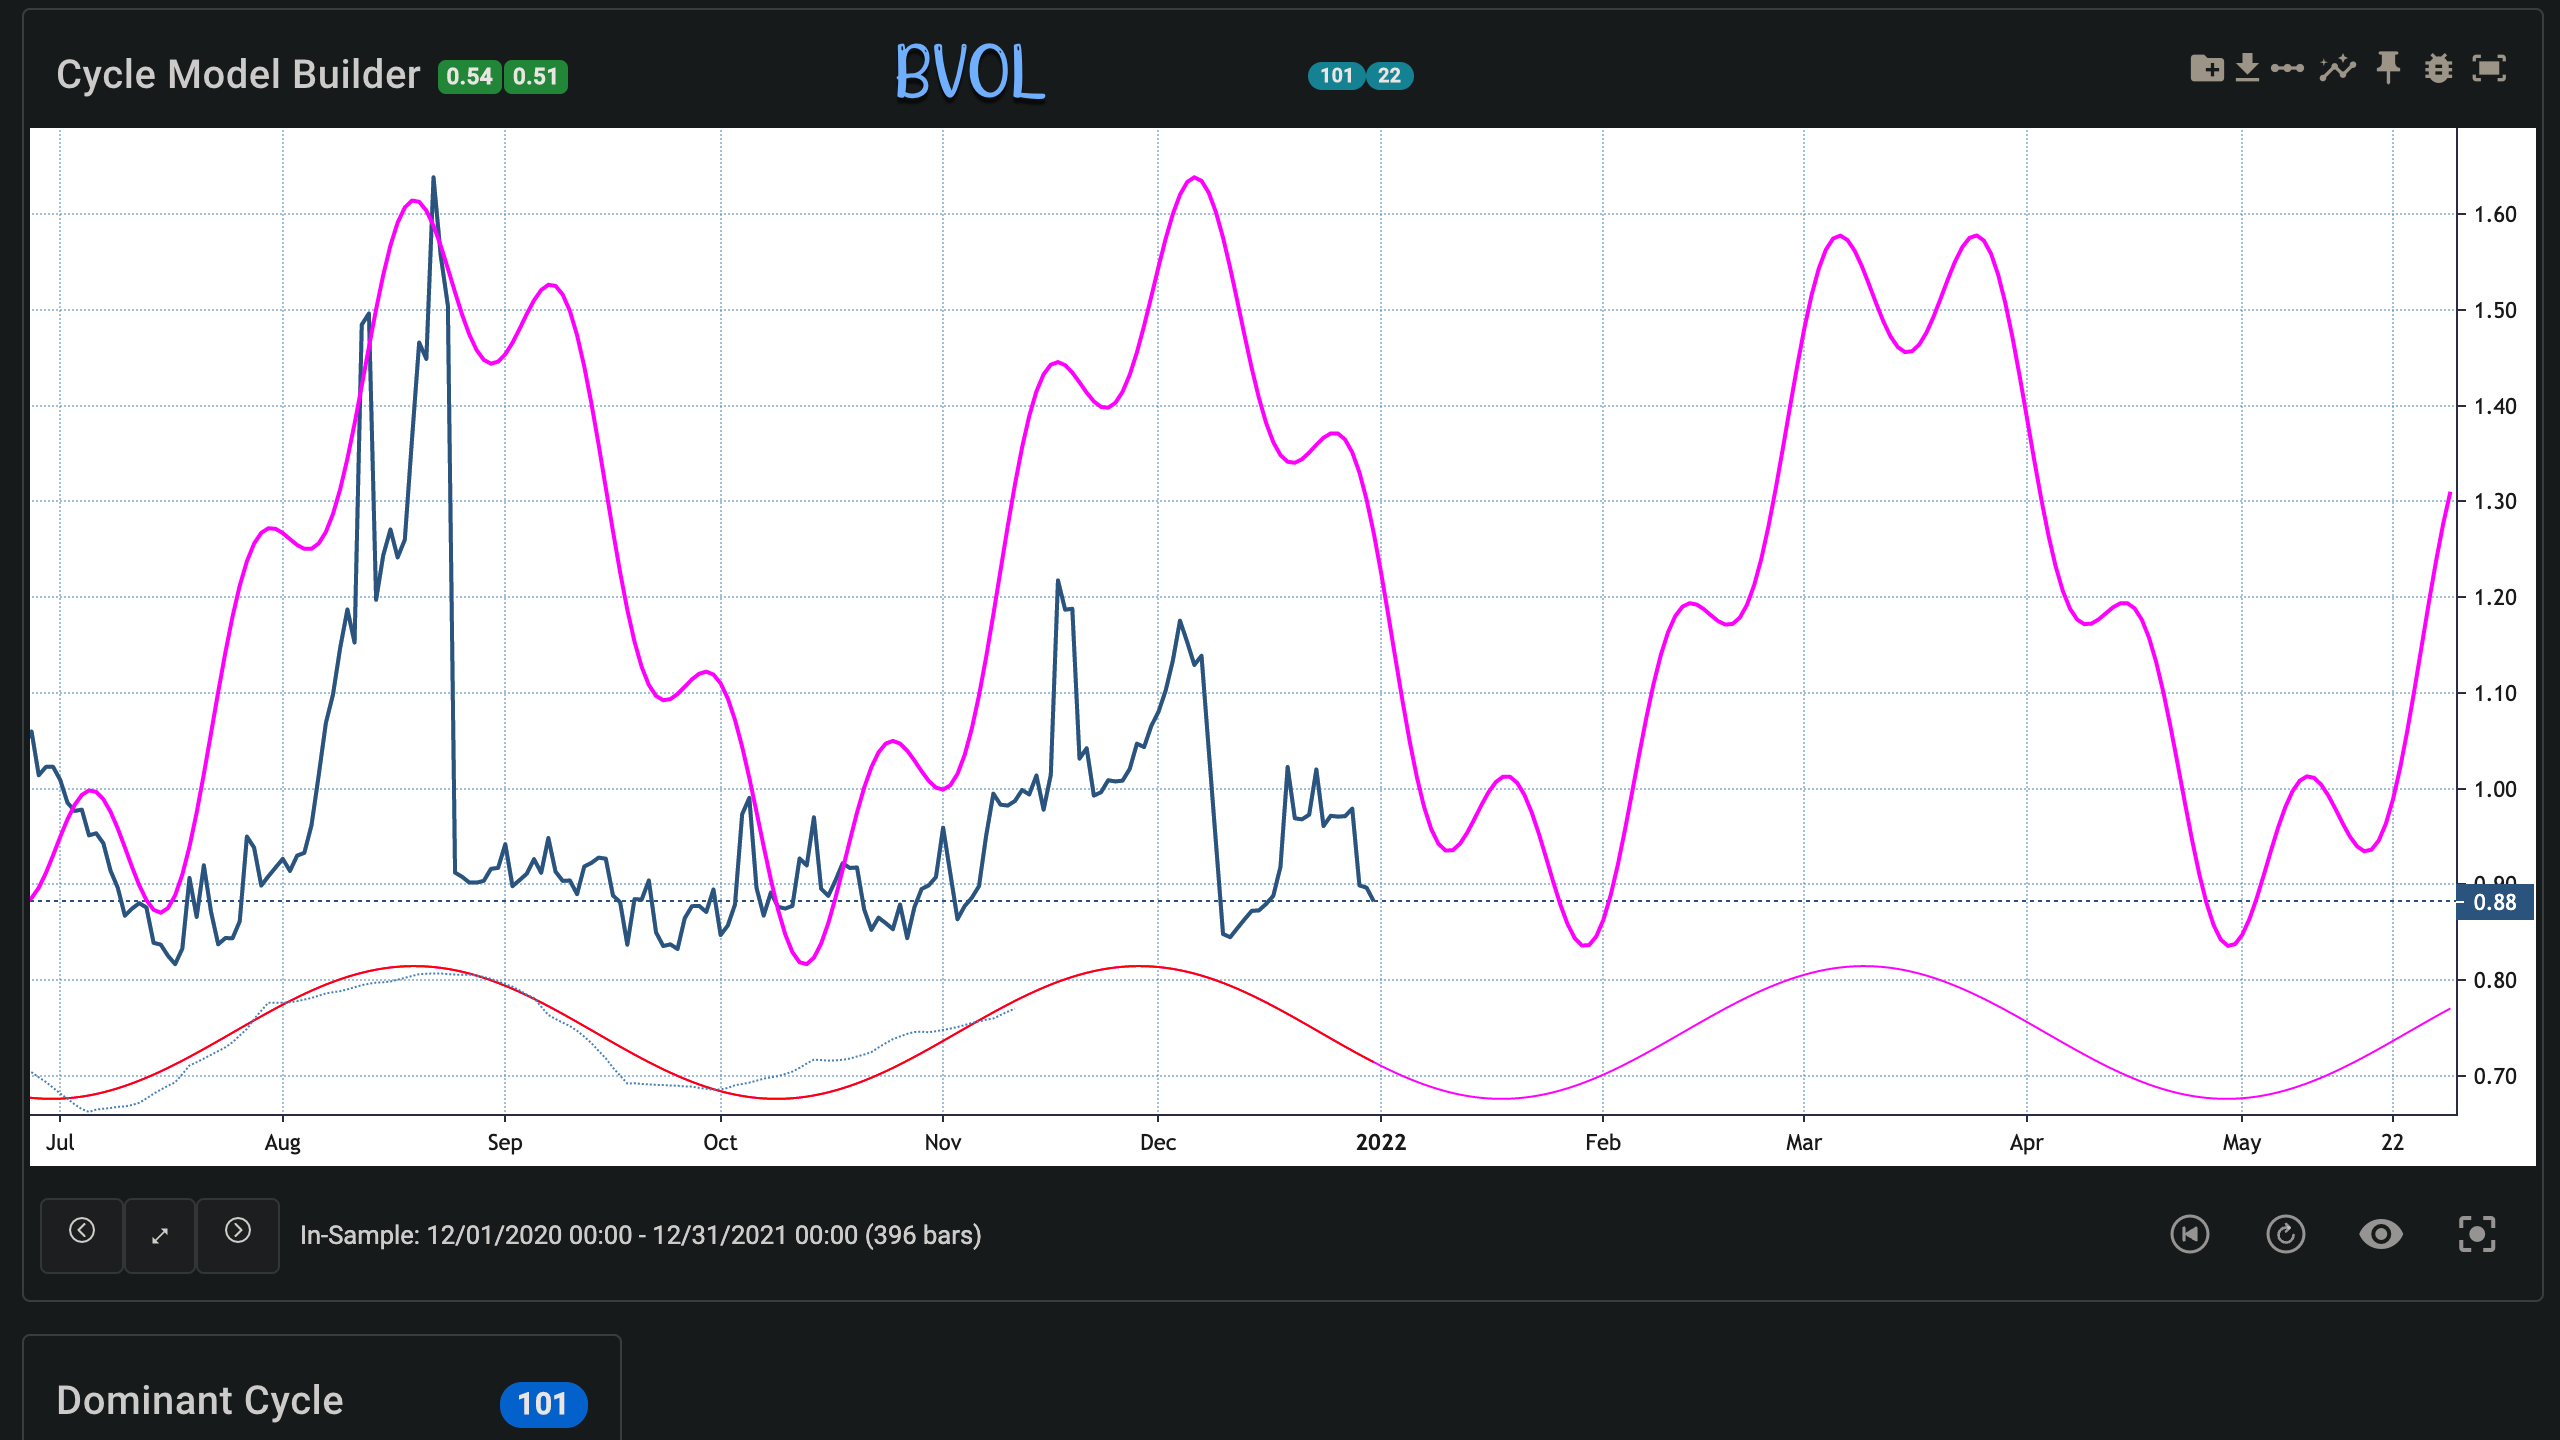
Takeaway: Dramatic price increases look to pick up in mid-Jaunary which could coincide with the failure from that price rally as positions are liquidated. The forecasted increase in February and march align with the forecasted cyclical bottoms of the market (BTC & ETH). These rallies may be big moves that would account for increased volatility. The volatility spikes in August and November accounted for large moves to both the upside AND the downside.
The market as a whole.
Analyzing the crypto market cap we can see a similar pattern with the bottoming of the market occurring around March
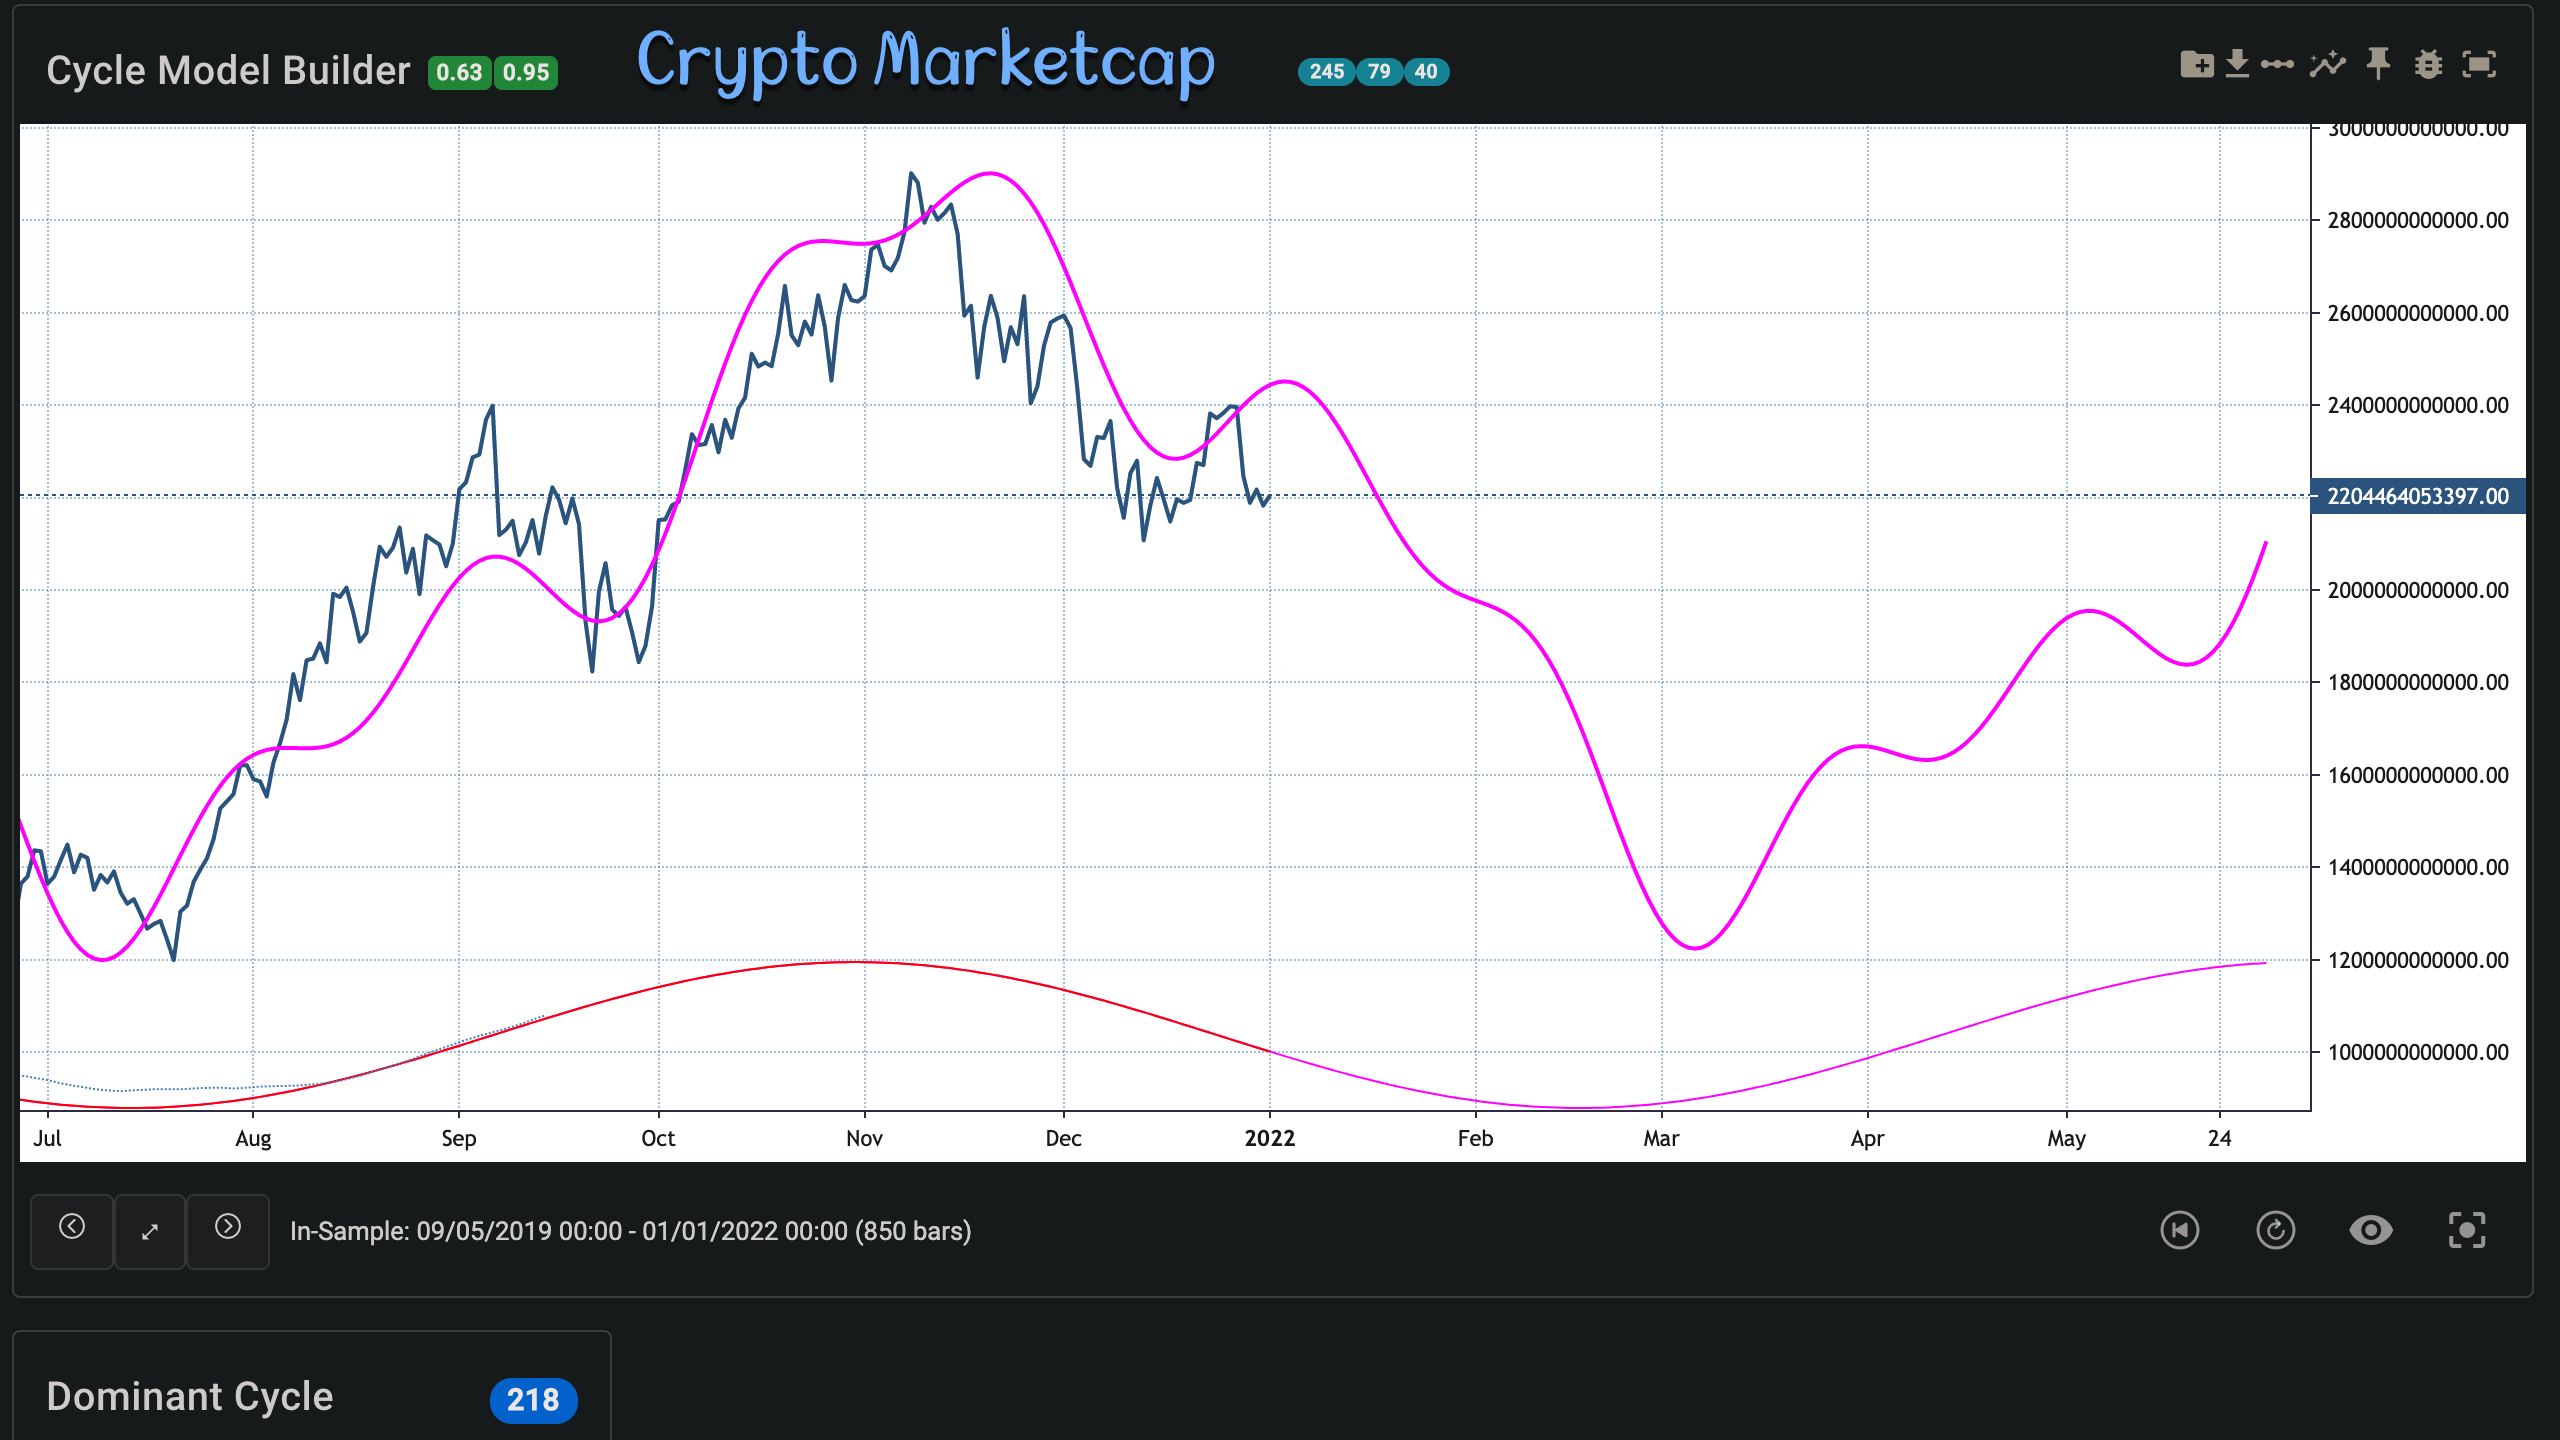
Takeaway: Dip buying should be staggered to make sure you have enough to last. March looks to be the time/date to have added the heaviest to positions to last hold on to through the summer.
The market in pieces.
If you haven’t read my Crypto Money Flow Chart post, please do. It’ll help the next chart to make sense.

Mid-cap coins have been holding up and growing the most throughout the last quarter.

The forecast on this particular section of the market is very similar.
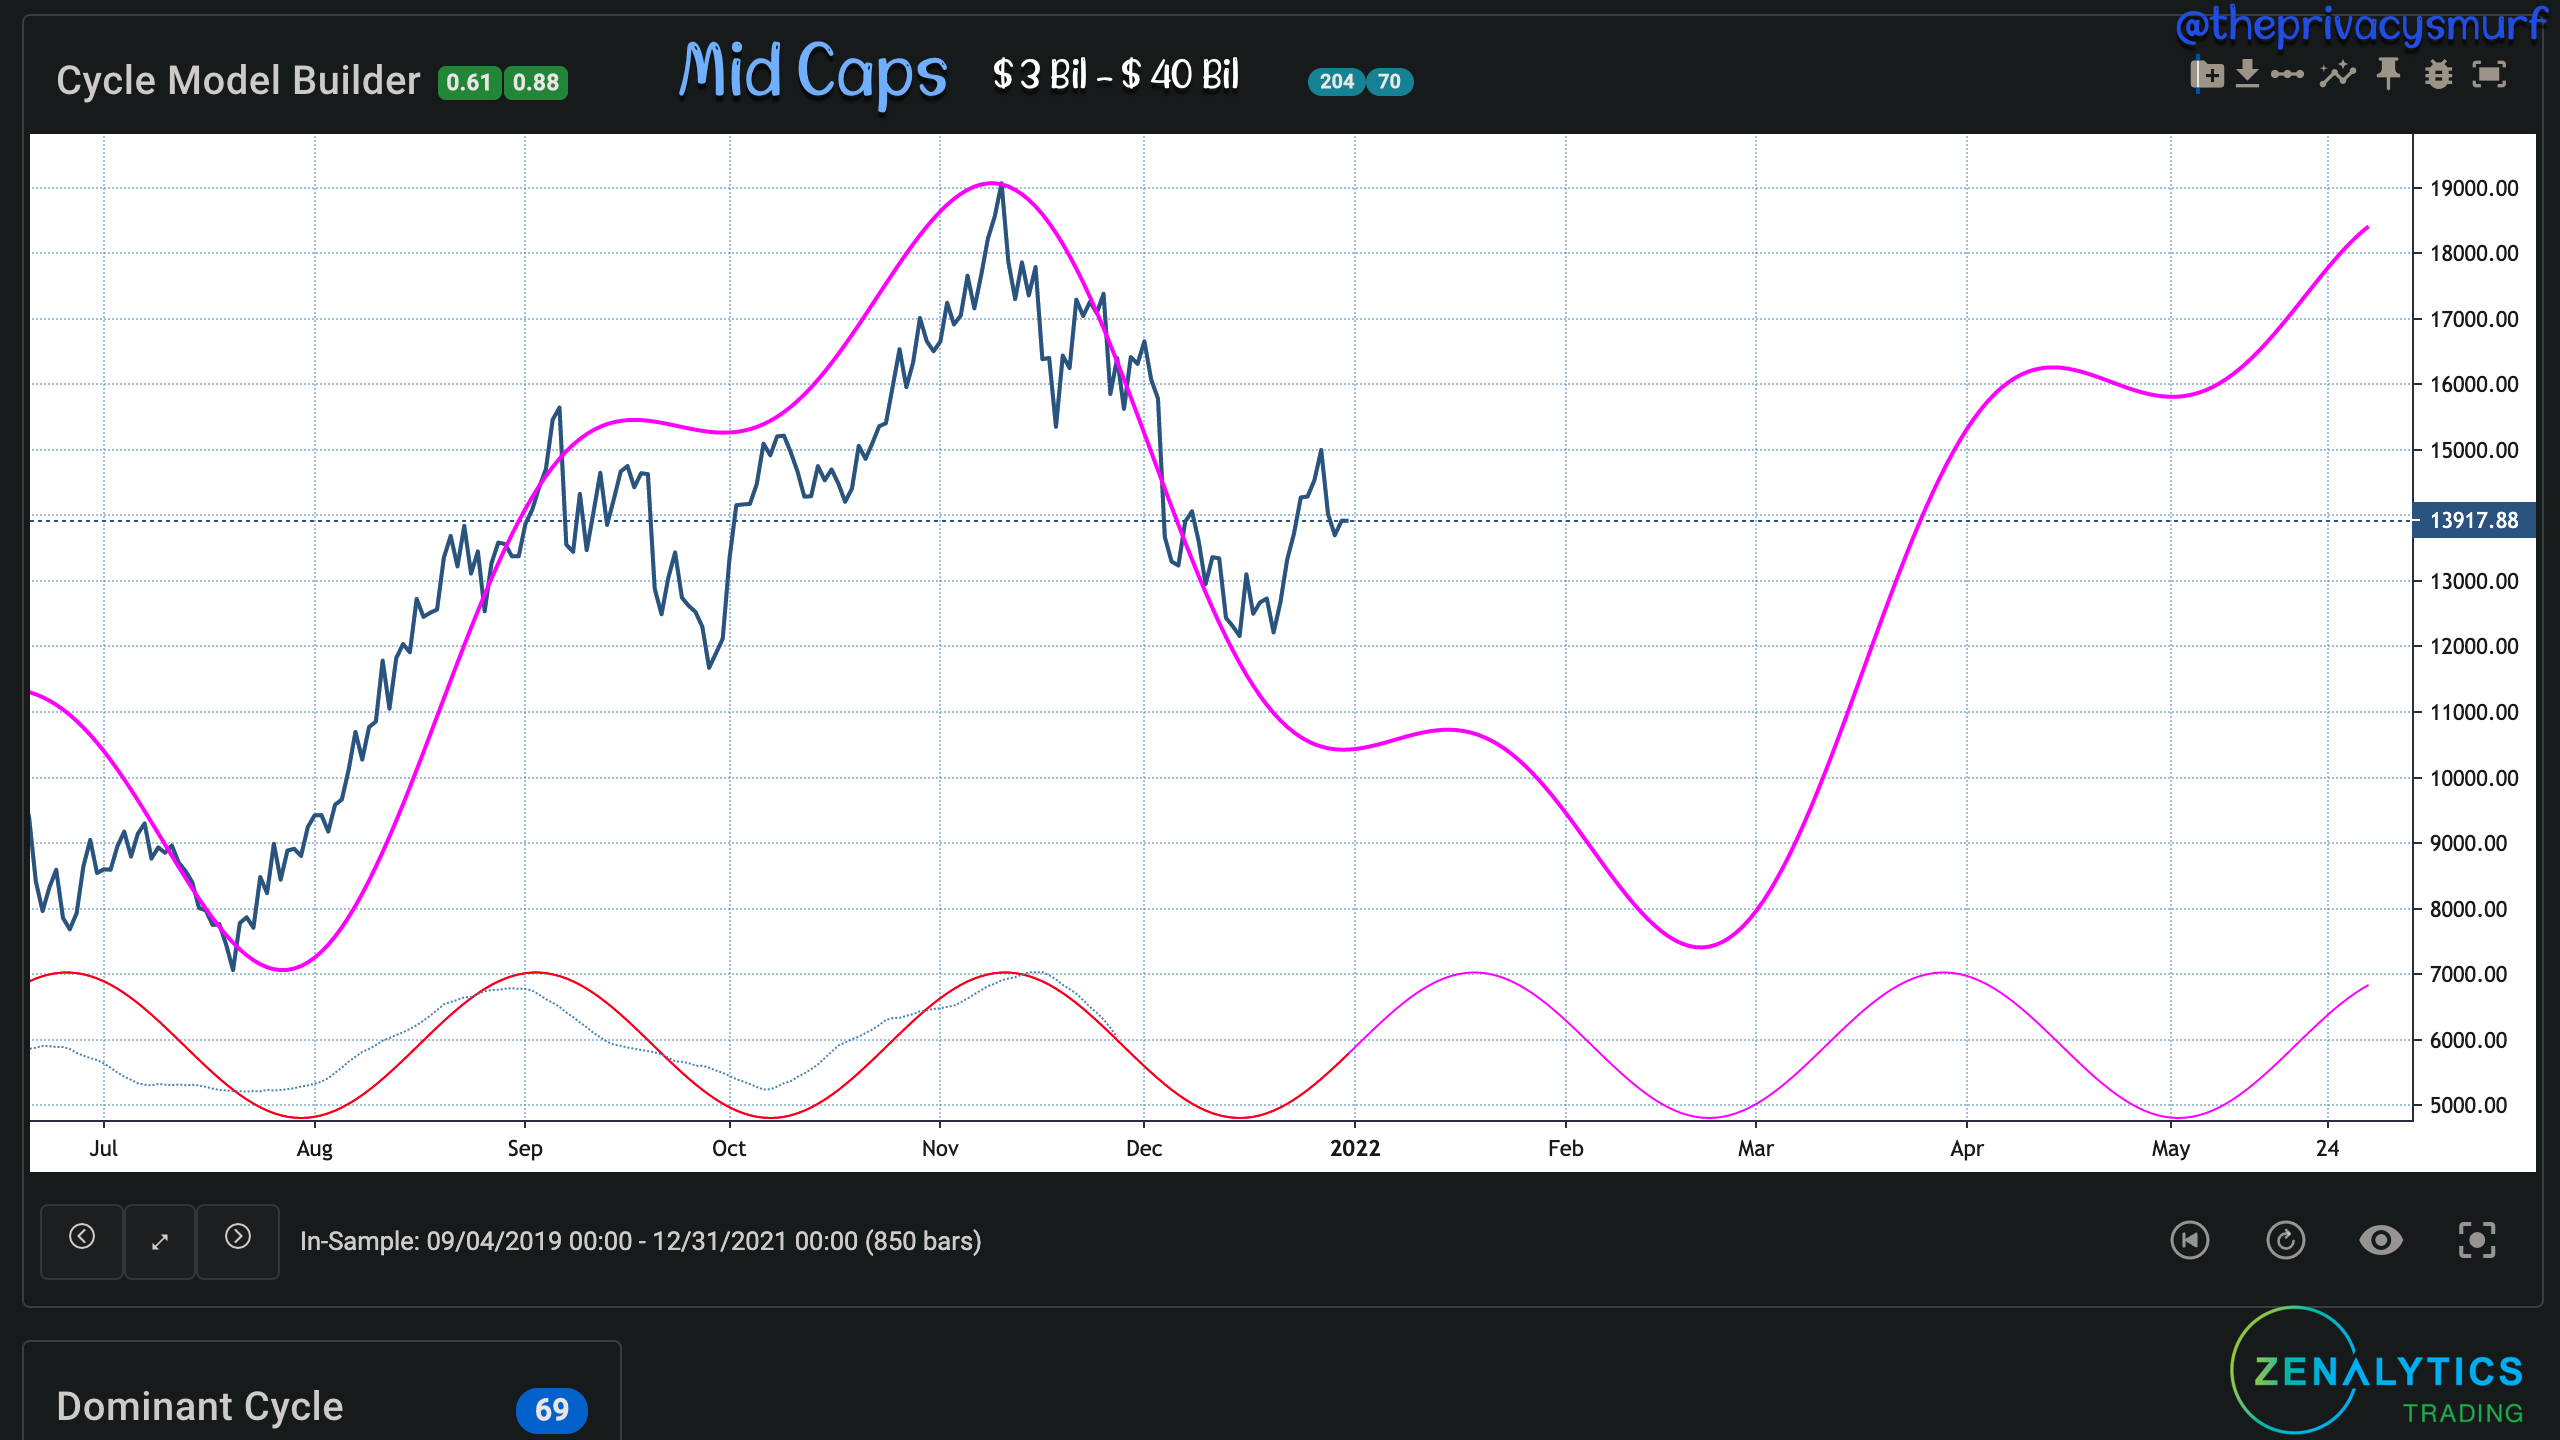
Takeaway: Timing your dollar-cost averaging into midcaps around the bottom now, potentially taking partial profits in mid-January, and buying heavier in late February may be the key to big gains over the summer. It’s been an interesting end to the year. Typical rotations haven’t really been that prevalent and by market cap, the #8-45 or so are by a large majority fundamentally strong coins with a lot of potential. It would appear that market participants are mostly being pretty smart with their purchases and not loading up on the tons of junk microcaps for quick gains during this downtrend. This summer may be a rise of midcaps. If money comes into the market like after a typical market bottom many of these coins have the potential to pull a Solana or Luna-like move.
Just for fun, I’ll toss up the BTC daily chart so you can see where the supports and resistances still are. The daily trend is still down, unfortunately. The weekly chart needs to see a close below 43k before the trend changes there. The RSI is still in bearish territory under the midline but the top adaptive band is in an advantageous place so if the RSI crosses the midline there will likely be some good bullish price action. Still as before, Same Shit Different Day, the range is 46k-52k. No reason to do anything until BTC is outside of that range. There’s so much risk involved with trying to front-run a bullish or bearish break.

I know it’s been a tough Q4 for many folks, and if you were following along in that forecast back then you’ll know that I said that the parabolic action was unlikely. I don’t like speculation but if I’m honest with myself and the technicals I don’t really expect a new all-time high in Q1. It’s entirely possible to have buyers pop in out of nowhere but that’s not something that can be predicted. Volume is an x-factor. You can never tell when people are gonna hit the buy button and don’t let anyone try to tell you they can. Try to keep your head when prices do start getting bullish, even if we break through the topside of the range. There’s still a lot of higher timeframe bearish technicals that I explain below. Those things take time to play out and can easily catch people by surprise because they are caught up in the green again after such a long period of red.
I hope you have a great Q1 and a great 2022. Thanks for being here with me.
@theprivacysmurf
This year I'm using you for my entries and taking profit points because you were dead on ever since I started reading you in late summer instead of the advice of a certain other coach that said "I wasn't long enough, especially in Defi" in October/Nov. Looking forward to a better informed 2022 :)
Good post Terry