

2022 Q3 Forecast: Colossus
2022 Q3 Forecast: Colossus
Hope is all I got now with all the times you let me down. Gone is all the progress. We have not seen your kind in quite a while.

Silly video and perfect lyrics.
Side note, this is a long post so you may need to go to the site to read it. It is warning me the emails might get clipped short by Gmail. Sorry.
Lessons Learned:
There are two times that are the busiest for me regarding my analysis. Those times revolve around the beginning of Q1 and Q3. Quarter 1 for me contains speculation for the year on top of the quarterly analysis. By the time Quarter 3 comes around I have all this new data to reevaluate my yearly analysis to see how my thoughts need to adjust given the new information.
One is missing out on valuable learning opportunities by bypassing a review of old analysis. There are a couple of notable points for me in this mid-year review.
Quarterly Forecast Format:
This quarterly forecast will be slightly different from prior ones. I want to take the time to convey the critical information here but I also don’t want these to get larger and larger each quarter, which has seemed to be the trend. There are so many interesting aspects to the market that I want to bring to the posts but I imagine it can be overwhelming and difficult to absorb the information fully or translate it into something actionable for yourself. These forecasts now will simply hold the takeaways for the Total Market Cap, BTC, ETH/BTC, a fundamental on-chain data component, the Financial Stress Index, and a typically inversely correlated asset class of Bonds. These are IMO the key aspects to keep tuned in to the crypto market and will allow you to make the right choices both long-term and short. I’ll have follow-on releases next week with deeper looks into the different portions of the analysis and a larger global macro analysis if folks are interested in reading more. I’m certainly wanting to write more.
Confirmation Bias:
I am not immune to the hyper-bullish sentiment that is pervasive in this space. While 2021 Q3 & Q4 forecasts and 2022 Q1 forecasts were on point, in retrospect I see multiple instances of allowing bullish sentiments to overly influence the forecast of Q2 2022. I presented mainly daily timeframe analysis disregarding the higher timeframe perspective. In doing so many speculations were incorrect. The proposed rally did not come and the market turned over in early April. The timing of the cyclical activity in BTC, ETH, and the market cap DID hold true but the suppositions on price action from the forecast didn't pan out entirely. The critical aspect to keep in mind that I glossed over was the alignment (or lack thereof) of higher timeframe trends. I even went so far as to highlight that aspect in prior forecasts (as shown below) yet my anticipations for bullish price action influenced my biases for 2022 Q2.
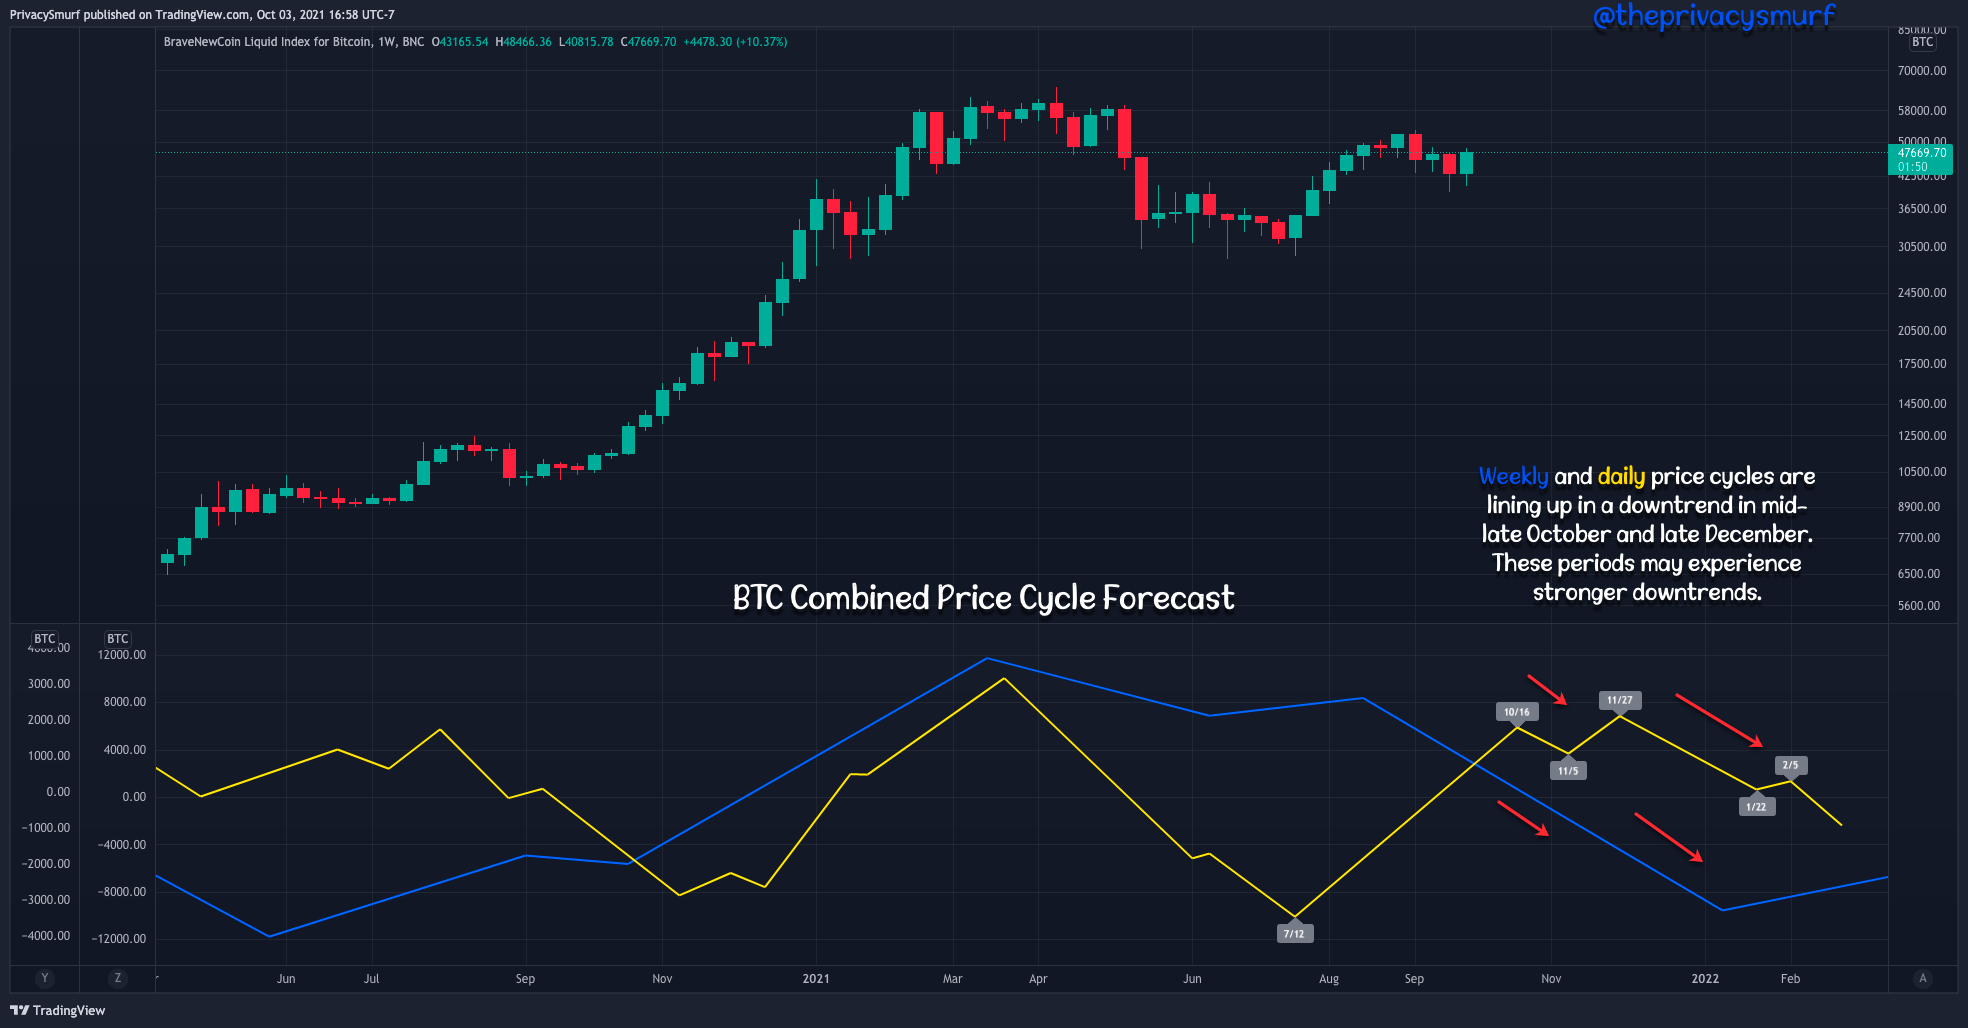
Here’s another example of this concept to keep in the forefront of the mind. Note when the blue (longer) and yellow (shorter) cycles are in bullish alignment, upwards price action moves more aggressively with occasional pumps. Then when the shorter cycle is down while the longer cycle is up there is a downturn but not the selloff is less aggressive and it ultimately becomes a higher low in the trend. The upward alignment returns and the aggressive bullish pumps continue. Next, the shorter cycle turns down while the longer cycle is topping. This misalignment leads to another higher low and choppy price action while the market transitions to bearishness as the longer cycle overpowers the shorter cycle. Even though the shorter cycle is now up this is reflected in price action as non-trending activity, a series of both higher highs and lower lows, into an eventual break of structure and a new downtrend. Further misalignment in the future of the longer downtrend will often be expressed as a break in the downtrend.

This is what we saw in the April to May turn and subsequent forecasted “rallies”. A picture-perfect example was the 2022 Q2 ETH MarketCap forecast shown below.
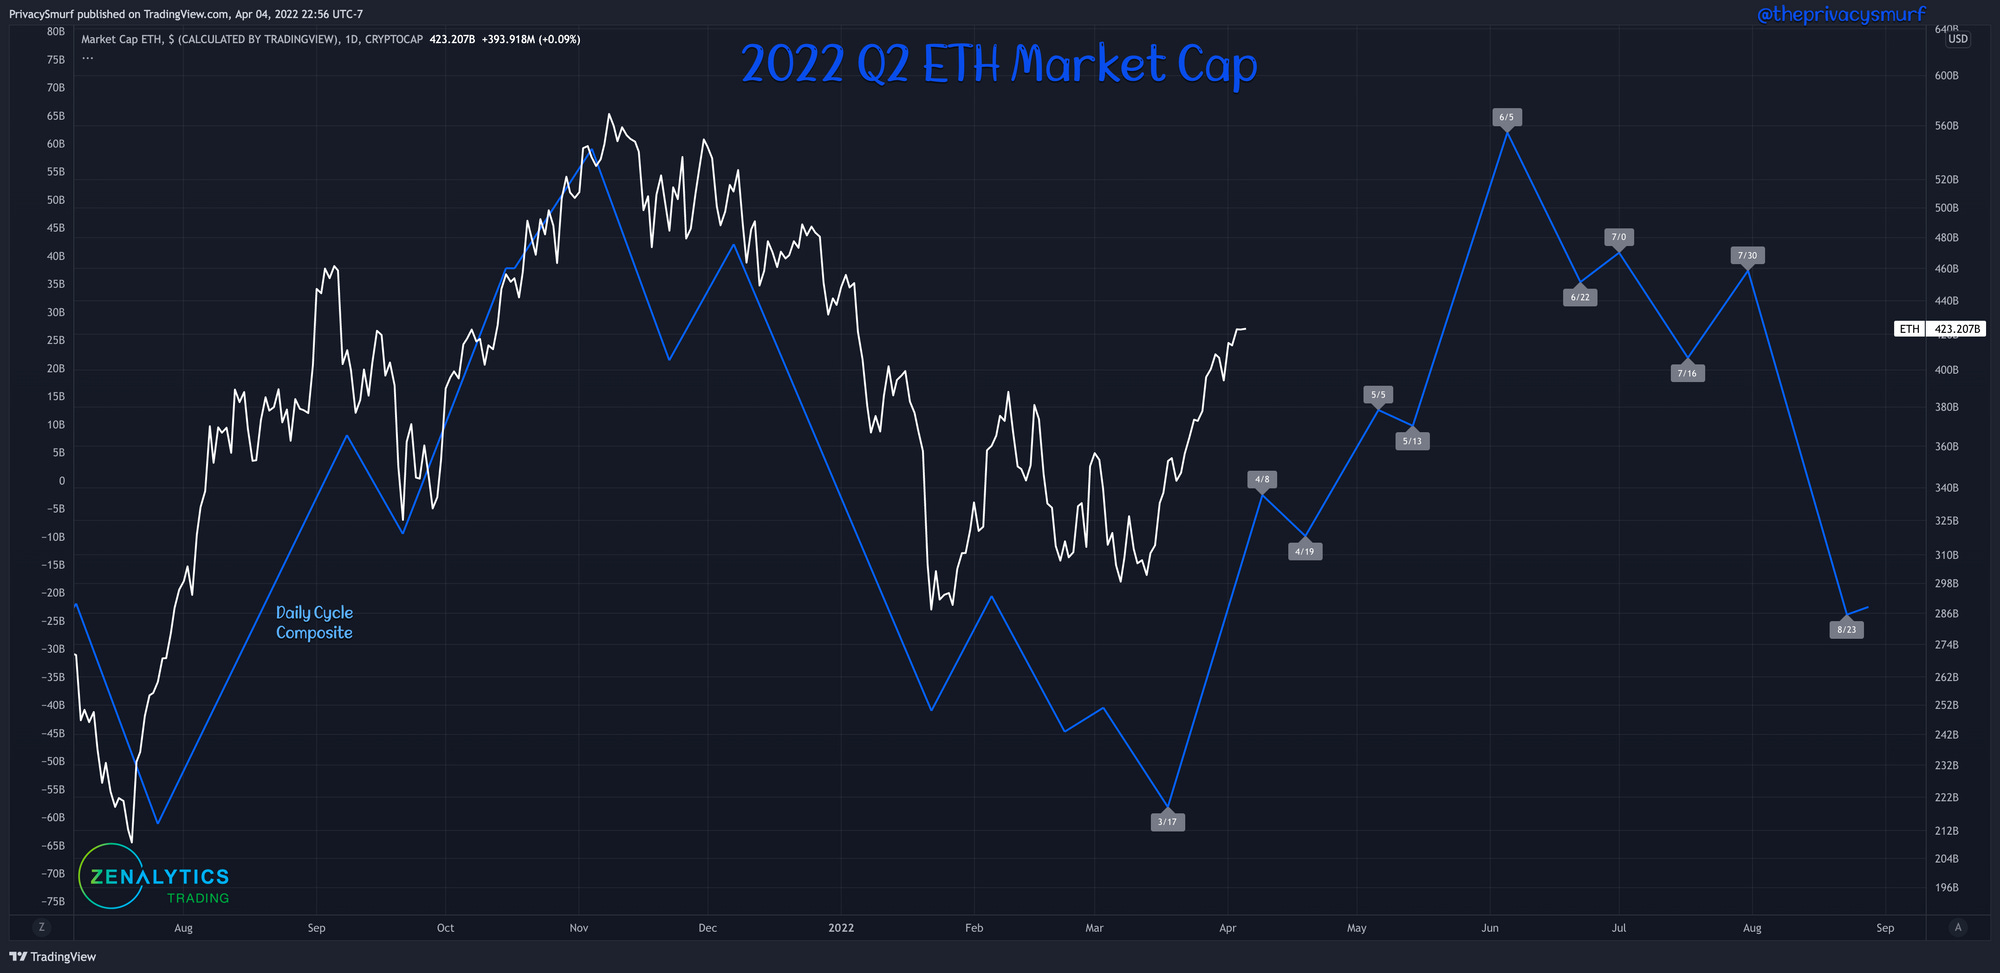
The real-time turns can be seen below. Note the “rallies” in the forecasted timing lined up perfectly with the live data but translated to breaks from the hard downtrend. The cyclically aligned bearish periods were expressed by deep aggressive crashes.
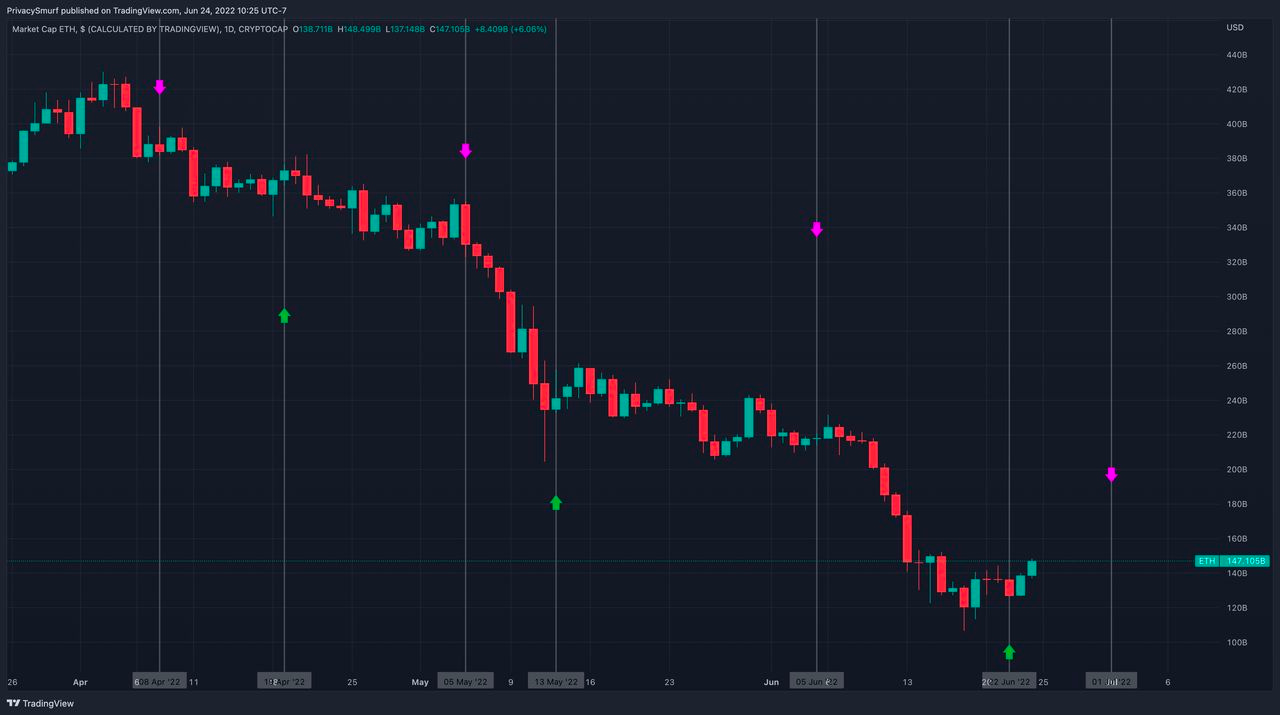
This is why paying attention to the higher timeframe perspective is important and something I’ll be including in forecasts in the future to help keep that context in the forefront. It’s especially more important as we work our way through the higher timeframe bearishness we find ourselves in across the market.
2022 Q3 Forecast
Each chart has an associated link so you can open the charts yourself. This is a way for you to save a copy for yourself and manipulate the charts how you desire. You can flip it to non-dark mode and make a printout. You can change the symbol and see how the forecast/overlay impacts other assets (or doesn’t impact them). You can add your own drawings and set alerts so you don’t forget to check things. Do your own analysis and find out interesting things and correlations that I haven’t thought of.