From the ashes, the crypto market breathes new life.
The total crypto market cap has increased to price levels not seen for the last 300 days. That feels nice. In the face of all this bullishness, I'm now adjusting the formatting of the analysis. As we approached the final high resistance of the long time range with mixed signals, I prioritized keeping speculation and estimations of ranges to a minimum and relying heavily on specific circumstances for evaluating options in both directions. As we have broken out to new highs in the face of this bullishness, the focus will be on letting things go as high as they want and less on trying to tag the reversal play and getting stopped over and over because of irrational and unpredictable bullishness. Overhead resistances are all fairly old now, so I put less weight into those levels. Sure, they may offer resistance, but it is not a certainty, and I don't want to attribute any notions of strength or weakness to them. They will be noted and plotted on the chart, but I'm not looking to take short trades from those levels even if bearish signals appear. I'm waiting for a more conclusive signal in a break of trend structure before I flip to the short side.
If you missed the quarterly forecast or the live stream, I suggest you check them out. Here are those links.
I didn't post anything last week for a synopsis but hedging scenarios of playing long into a potential breakout which I discussed in the synopsis prior to the Q2 Forecast and posted in the "Short Term Chat" box and Discord are all in profit against bearish expectations.
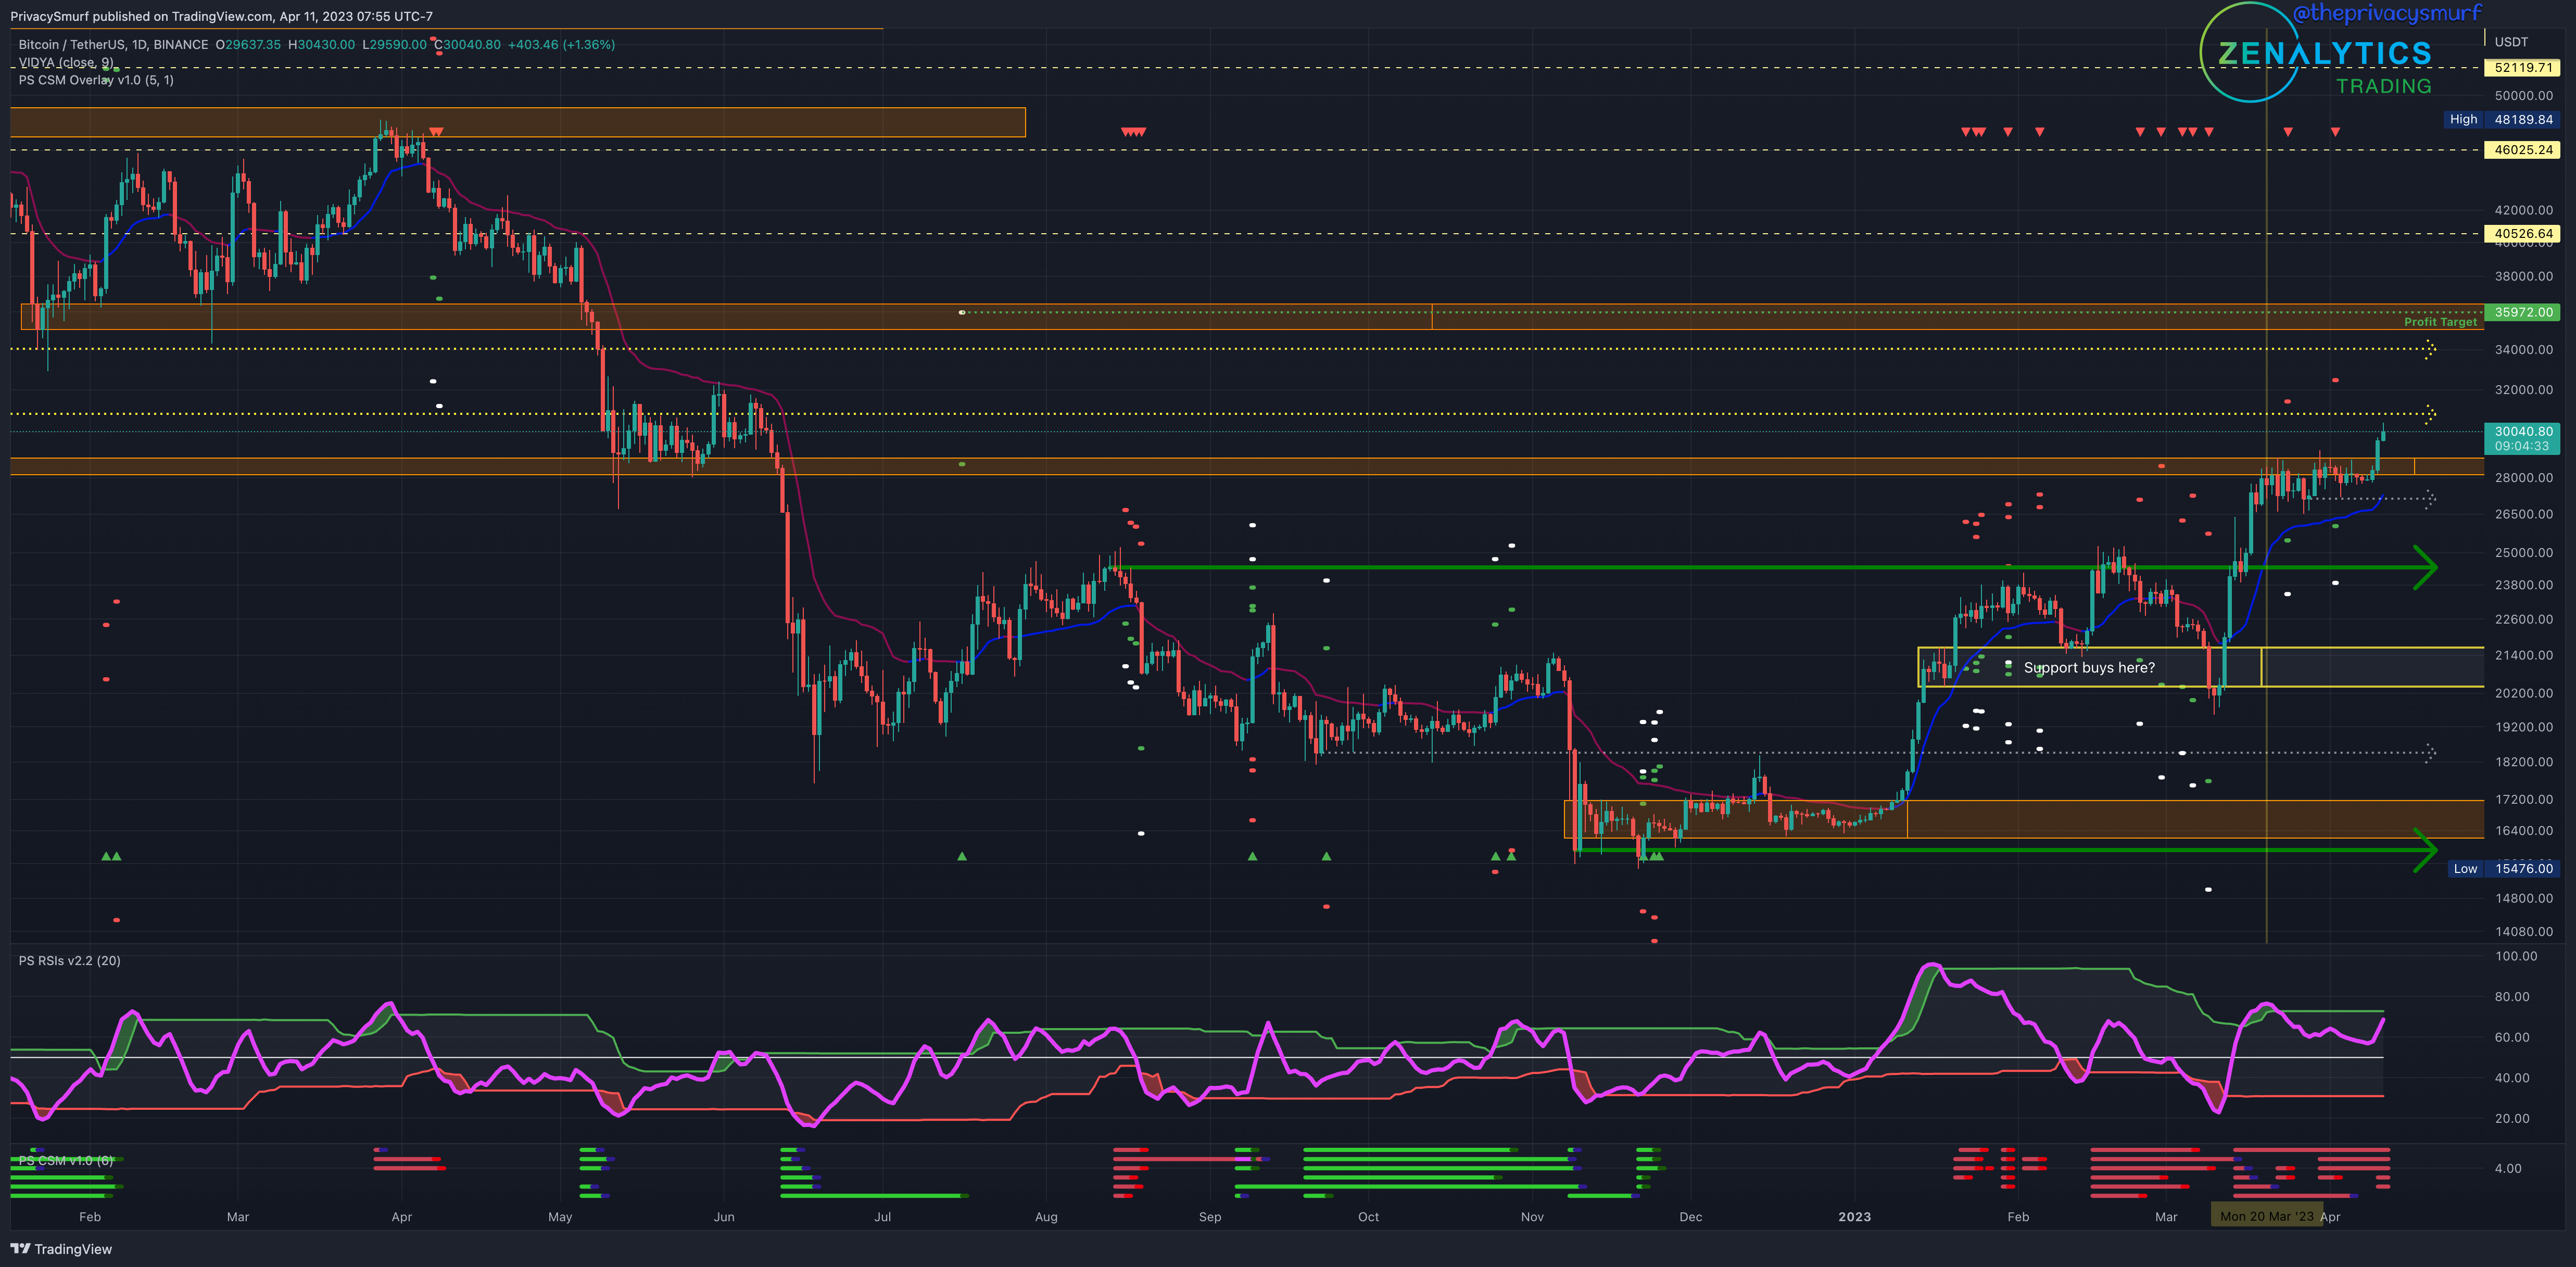
One would have to zoom out pretty far to see some potential resistance levels, but I've done so in the photo below.
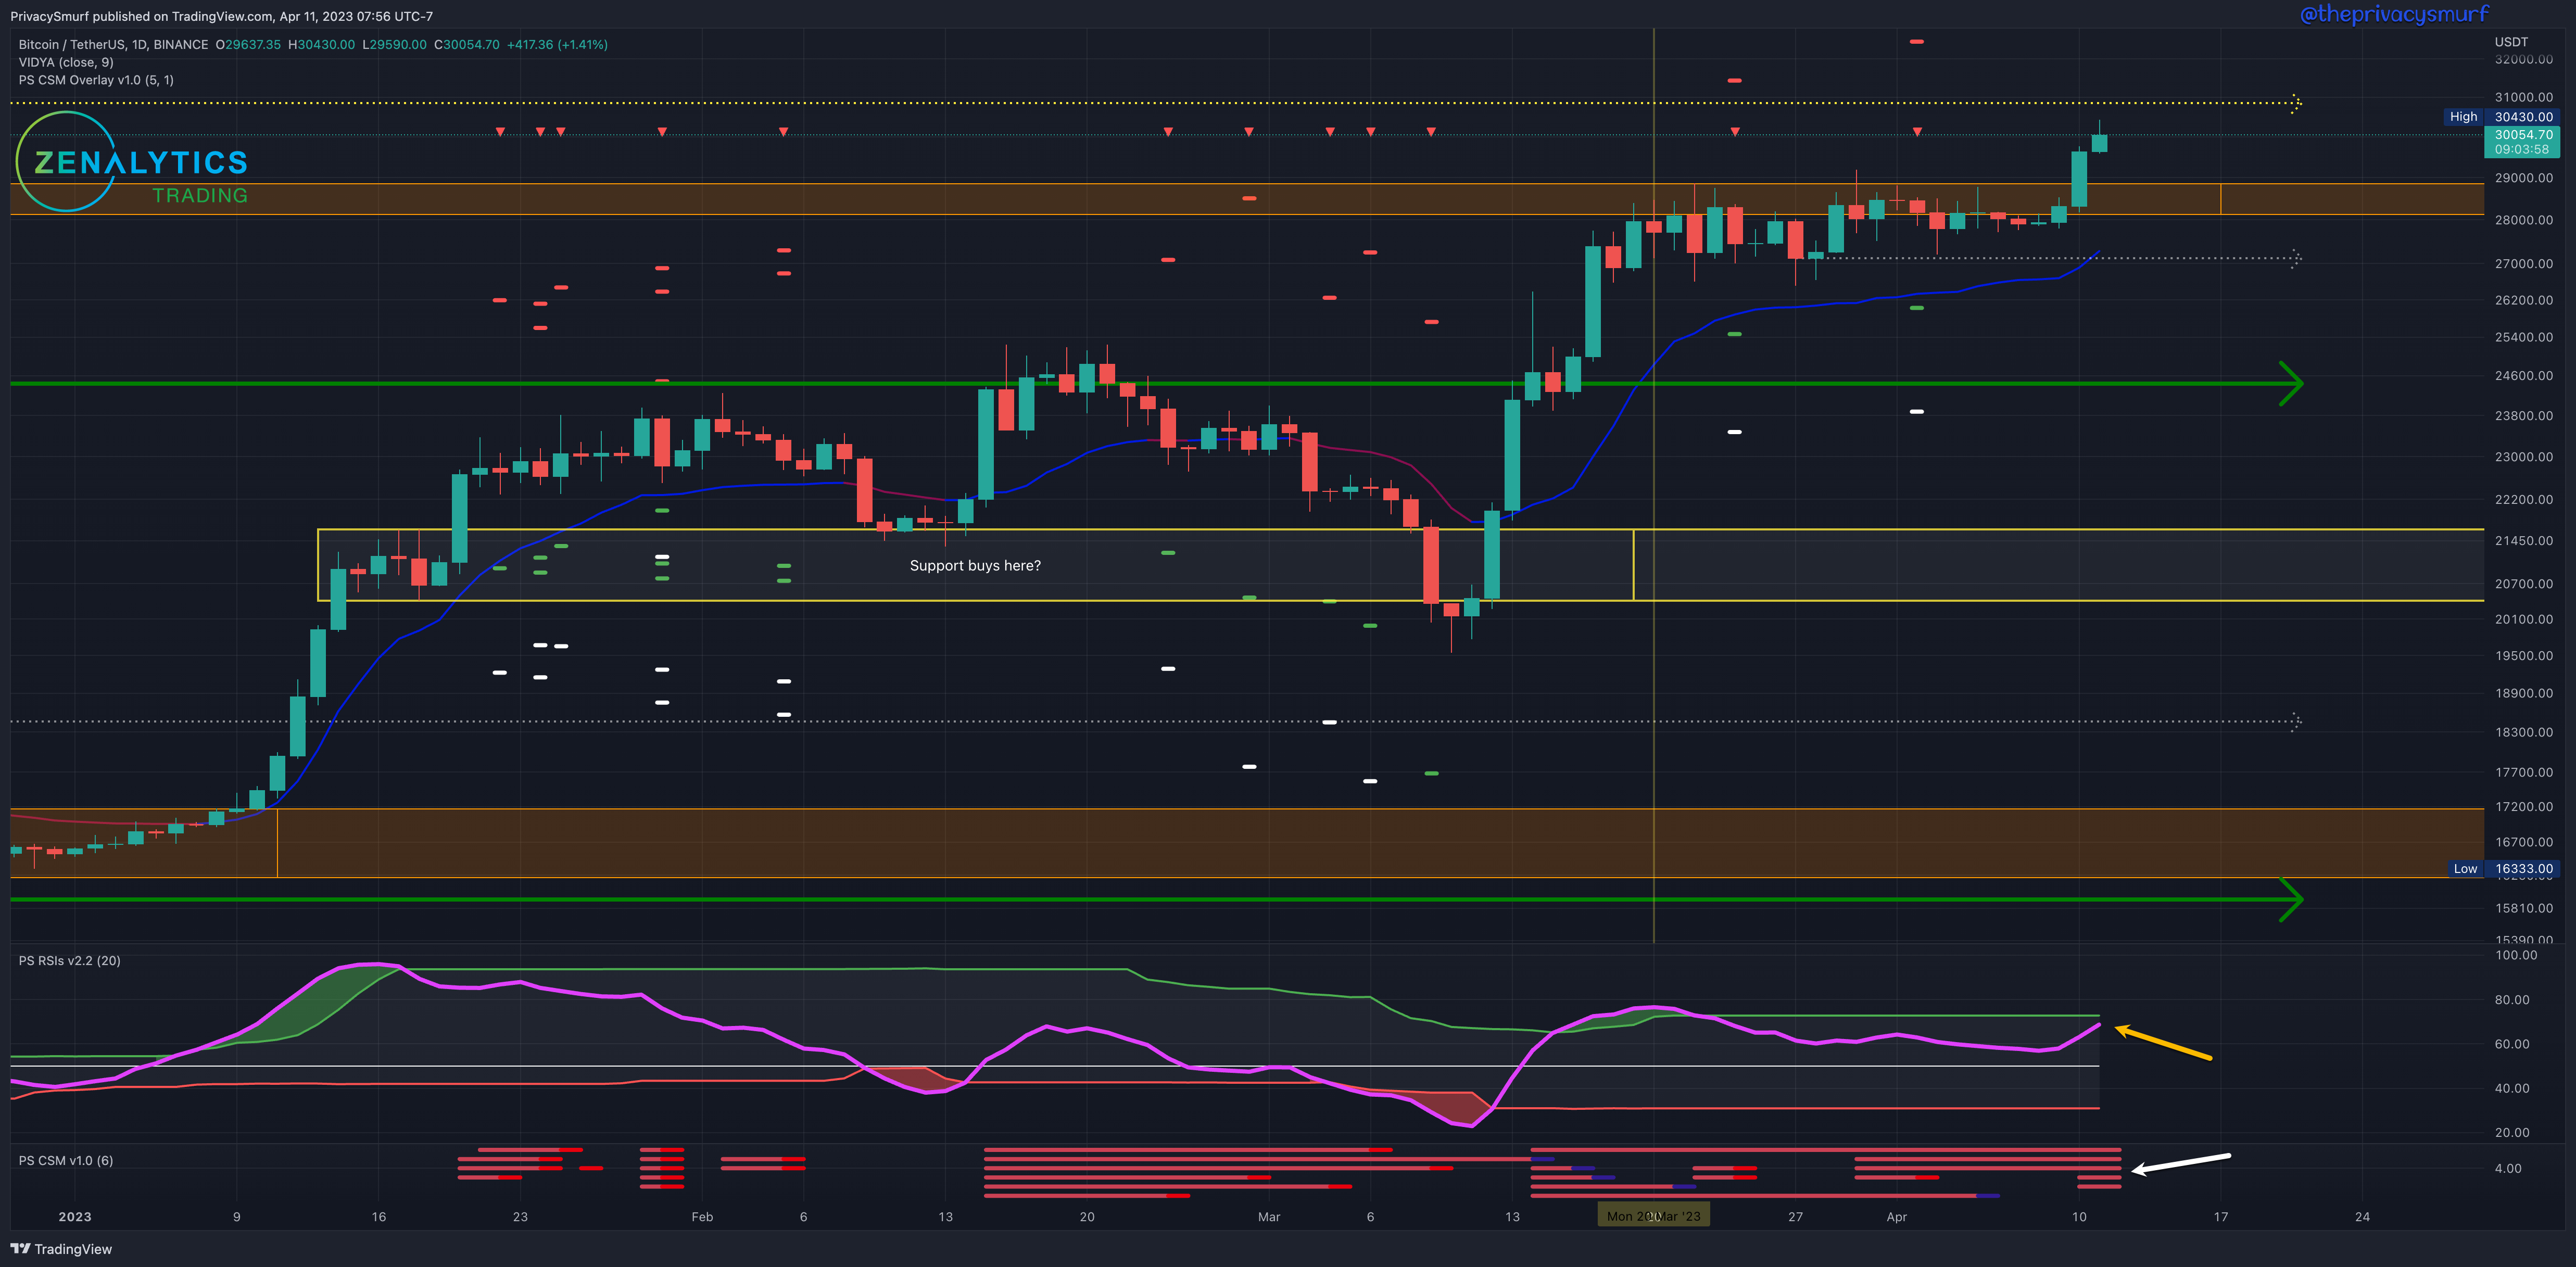
Monday, BTC ripped through the resistance, acting as a ceiling for around three weeks. An older level exists at $30.9k, which may be the first place to act as a resistance as we move higher than $29k. The breakout has occurred while the RSI (yellow) is still within the adaptive bands. A breach to the topside in the coming days, and I'd expect more bullish impulsivity, potentially more green days, and greater range expansion than Monday's price action. My custom indicator, the Correction Streng Meter (white arrow), still shows multiple red bars, which signify bearish divergences on multiple price action oscillators. Momentum across these indicators still shows a slowdown despite price action moving higher. However, the RSI and the other constituent indicators are not far from measurements that will invalidate this bearish divergence. If the RSI breaks above the top bad, I would expect there to be multiple follow-on invalidations of the bearish indicators, which would suggest a bullish price continuation.
Given the week's current technicals, I'd suggest a range normally, but I won't do that. It will be important to monitor the RSI. A break above the band, and I anticipate further bullishness. My trading bias is bullish. If I weren't in a long position, I wouldn't be opening a new position here until higher as we are still under a potential untested resistance. Here are my two considerations for entry if I were not in the market.
The 2hr chart may signal where the next bullish move may cease before a retest of a broken level. A bearish divergence with a matching bearish RSI breakout is a bearish signal I'd consider taking, but it's pretty risky in the face of all of this bullish price action.
The 20min chart is key for watching where the short-term bullish pumps will break to consolidate. When the profile of the RSI in this timeframe starts to move to bearish divergence, I'd expect prices to range between the short-term levels that were broken and tested. On return to the lower levels, it's a place to consider reentering the bullish trend. Additionally, breakouts on the 20min with bearish divergences being invalidated are higher-risk places to consider gaining exposure if any retracements were missed to buy.
As long as daily closes remain above $27k, I have little interest in a short bias. This floor will likely move up with each resistance break.
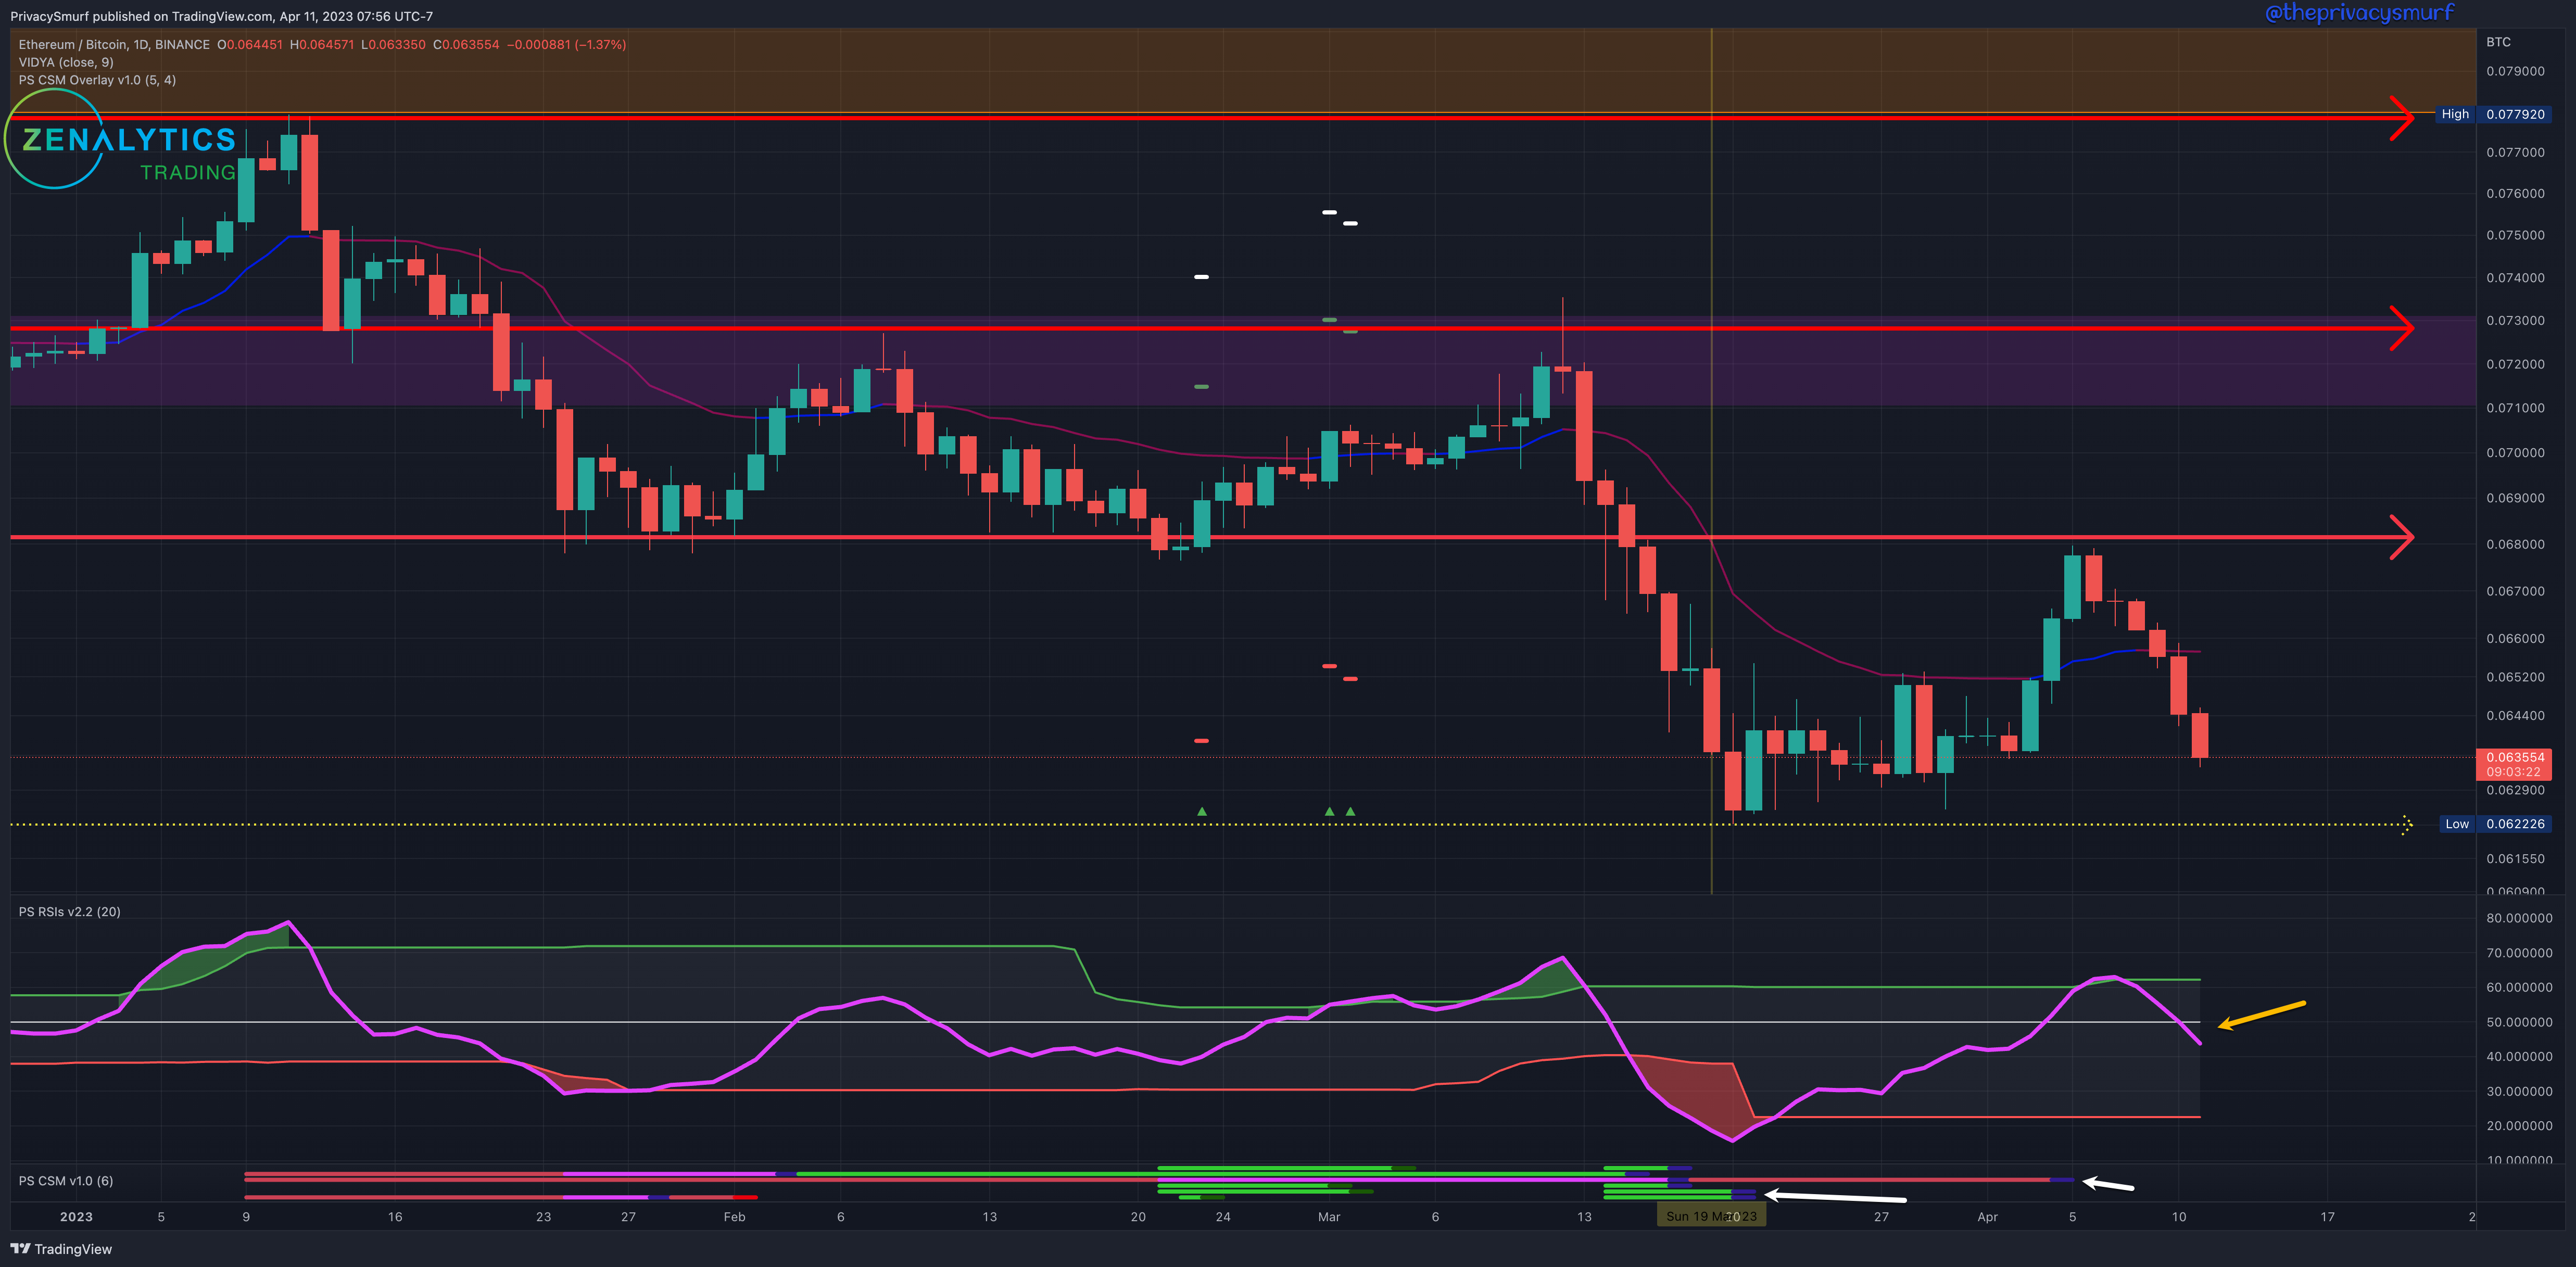
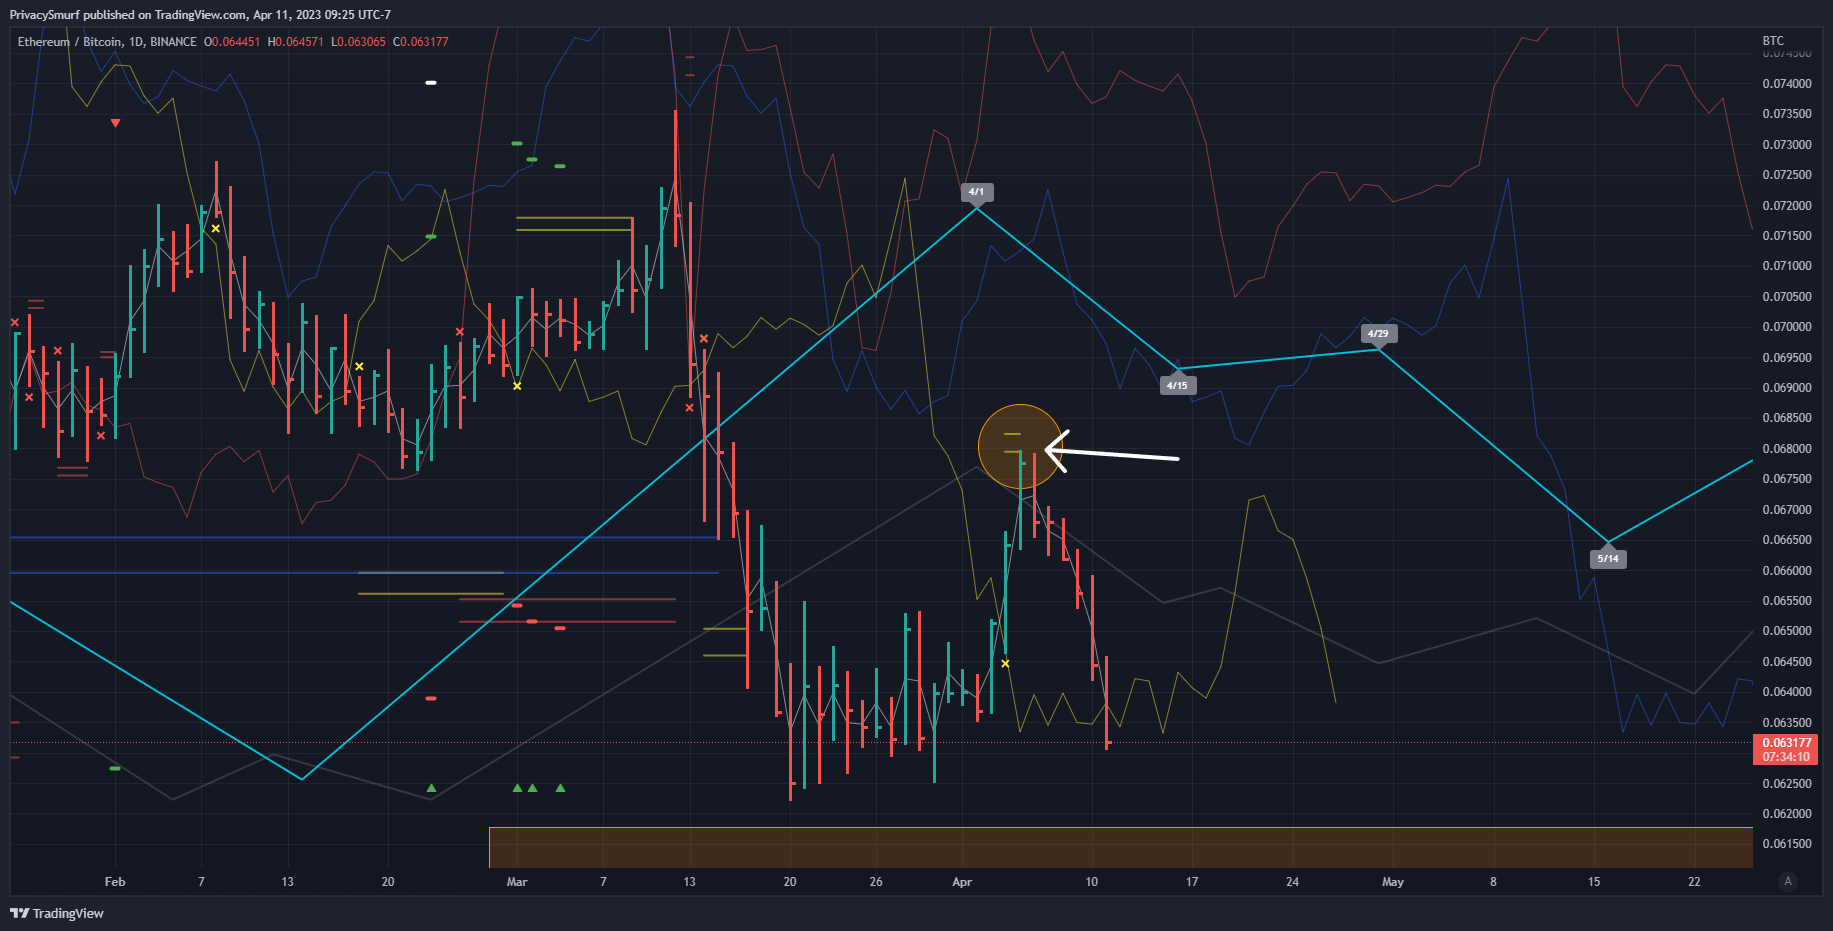
I didn't post anything last week for a synopsis but in the Q2 Forecast Live Stream I touched on an alternative method of cycle analysis and pointed out a short term bullish target for ETH/BTC which was hit the next day and fully retraced from that point as seen in the second picture. Also from the last synopsis "...not entertaining the idea of a new rotation at least until the RSI can move back into the bands, which would suggest a local bottom... historical support... around .062..."
The RSI managed to curl back into the bands confirming the local bottom, which reached 0.062. That may act as temporary support; however, the RSI (yellow arrow) has taken a new position below the midline, suggesting a bearish influence on price action. My indicator, the Correction Strength Indicator (white arrows), points out two places where bullish and bearish divergences have been invalidated. This would suggest that price action is now in line with oscillators, and continuation of the underlying trend may occur (bearishness) or increased and extended-ranging volatility. At the time of writing, the cycle analysis method mentioned above currently has bearish retracement projections down at around 0.596.
Given the current technicals for the week, I’m not entertaining the idea of a new rotation until the chart displays a bullish divergent RSI again. That would mean at least extending below 0.062 again. All this means that ETH and alts will probably underperform BTC. Either BTC will go higher and/or faster or decline less and/or slower. My bias this week is bearish, although I'm not exposed and making no moves in reference to this chart. Pure speculation and nothing I'd actively make a bet on; I'm estimating bottoming to occur on this chart in a range of 0.056 to 0.0617
I didn't post anything last week for a synopsis but hedging scenarios playing long into a potential breakout which I discussed in the synopsis prior to the Q2 Forecast and posted in the "Short Term Chat" box and Discord are all in profit against bearish expectations.
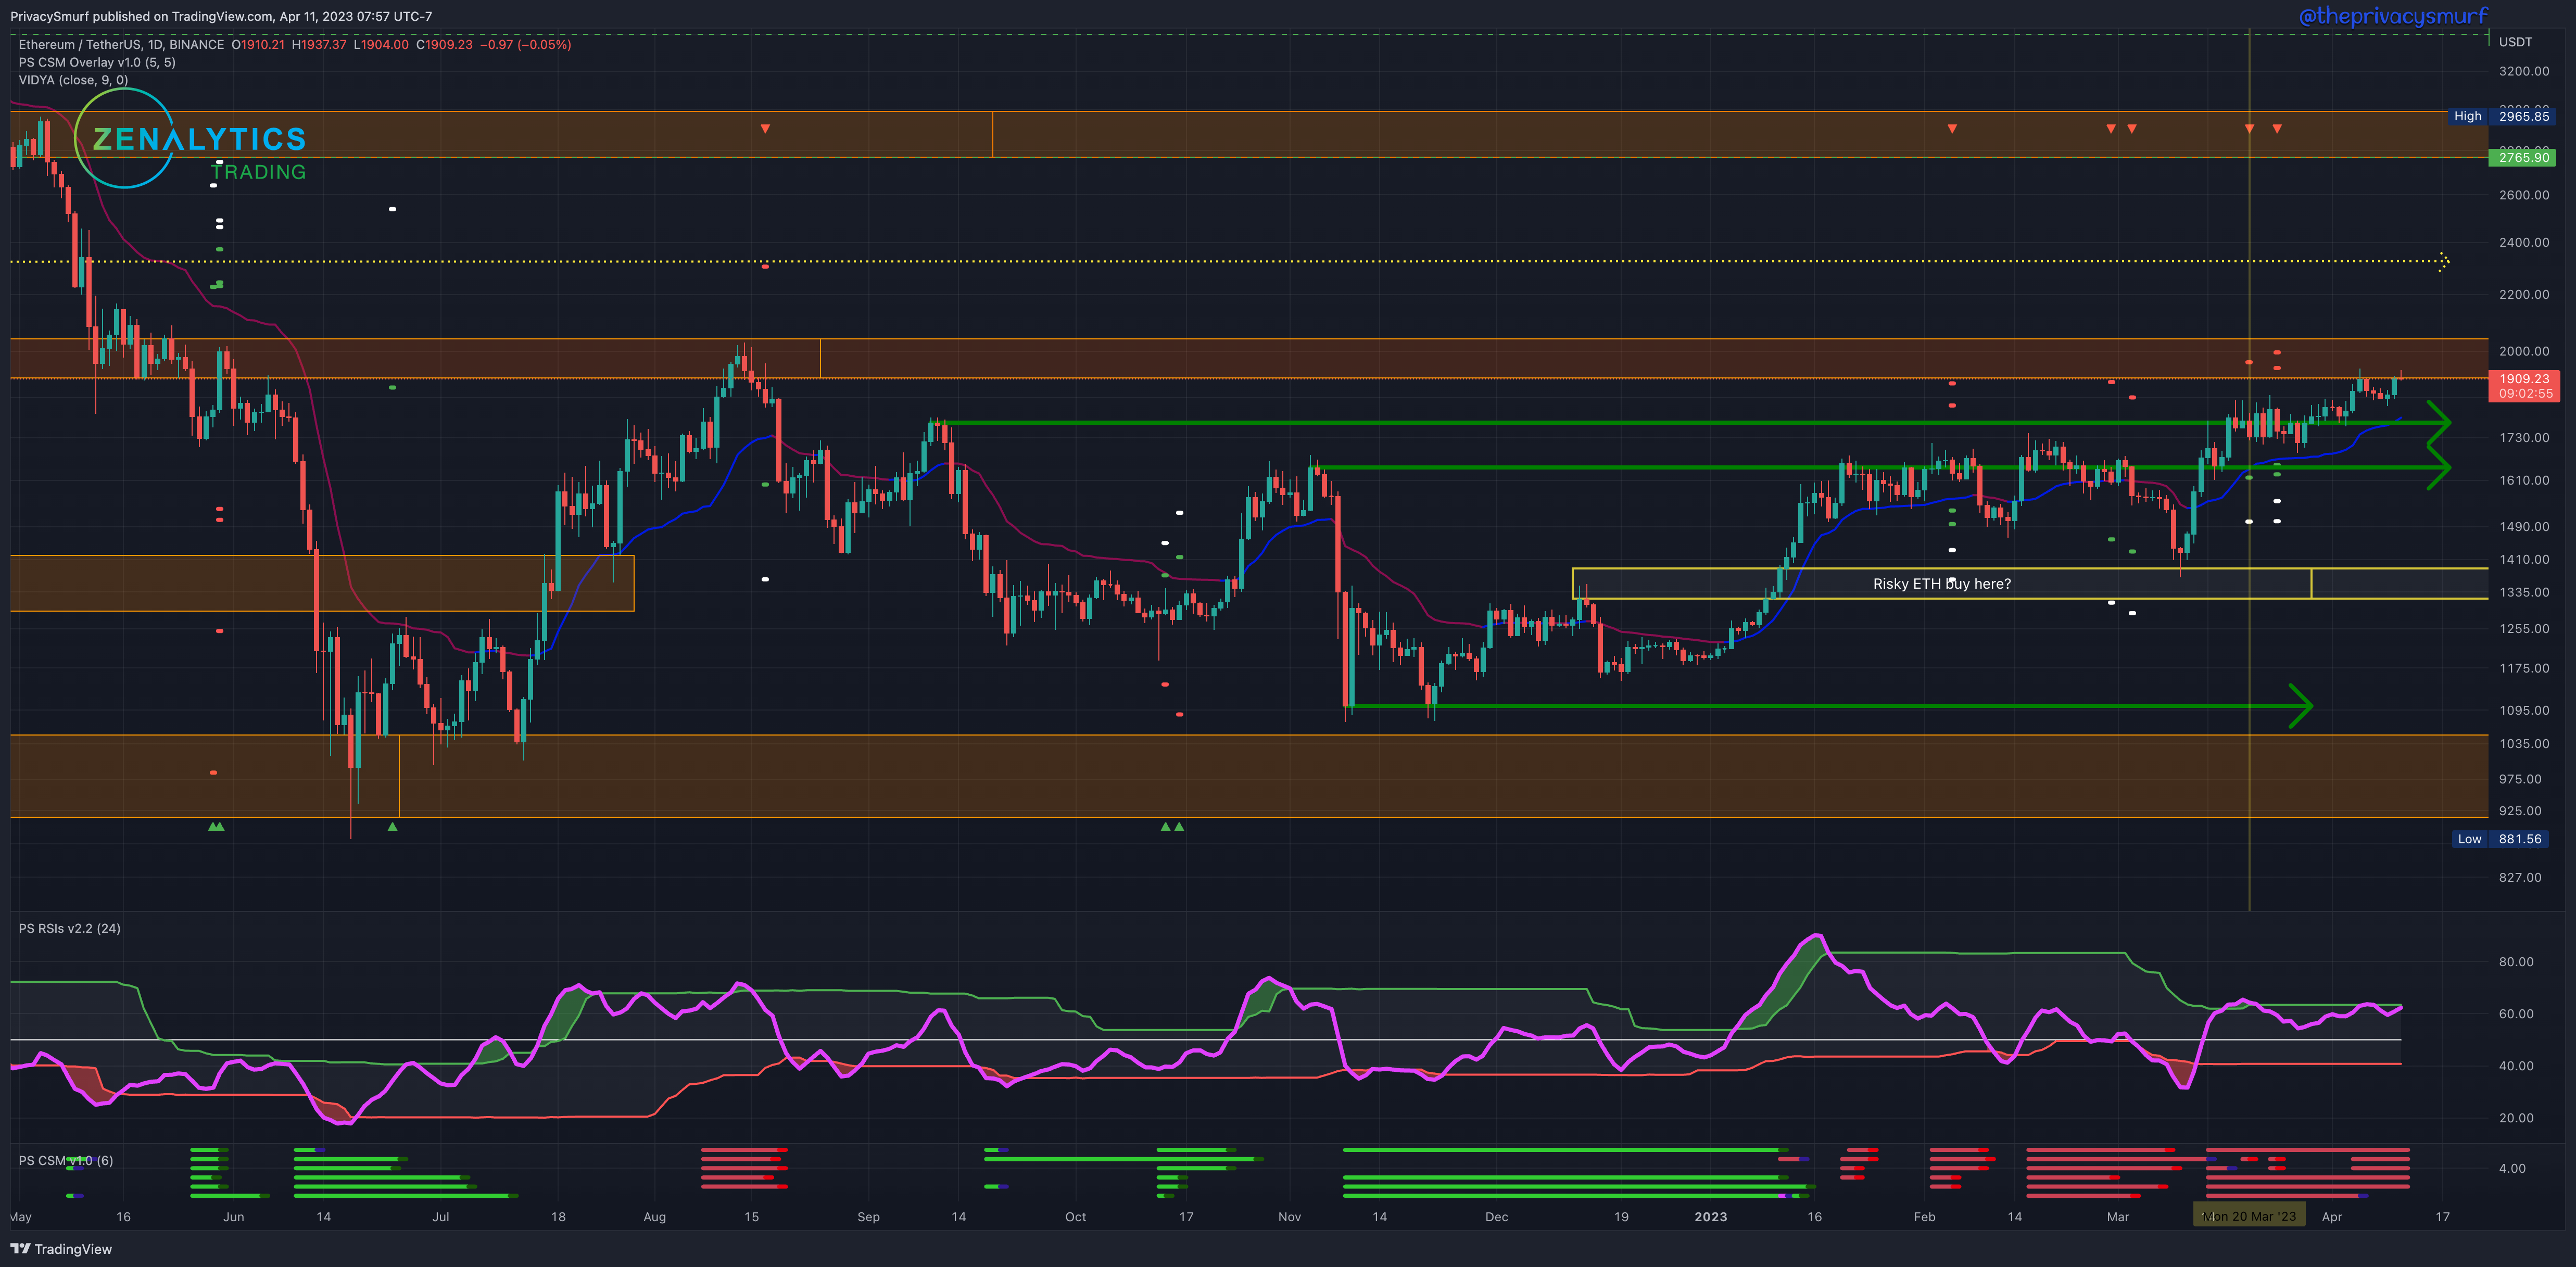
Again I've zoomed out to include a few potential higher resistance levels.
ETH managed to break above the ceiling, holding prices back but was met by another one relatively quickly at around $1910. The zone from $2000-2100 has some price action history and may take some time to work through the resistance memory. Although, the RSI (yellow) is within the adaptive bands and nearing an upward breach. This would lead me to expect more bullish impulsivity, potentially more green days, and greater range expansion potential pushing prices above this zone. My custom indicator, the Correction Streng Meter (white arrow), still shows multiple red bars, which signify bearish divergences on multiple price action oscillators. Momentum across these indicators still shows a slowdown despite price action moving higher. However, the RSI and the other constituent indicators are not far from measurements that will invalidate this bearish divergence; one oscillator has already colored blue, signaling invalidation. If the RSI breaks above the top bad, I would expect there to be multiple follow-on invalidations of the bearish indicators, which would suggest a bullish price continuation.
Given the week's current technicals, I'd suggest a range normally, but I won't do that. It will be important to monitor the RSI. A break above the band, and I anticipate further bullishness. My trading bias is bullish. If I weren't in a long position, I wouldn't be opening a new position here until higher as we are still under a potential untested resistance. Here are my two considerations for entry if I were not in the market.
The 2hr chart may signal where the next bullish move may cease before a retest of a broken level. A bearish divergence with a matching bearish RSI breakout is a bearish signal I'd consider taking, but it's pretty risky in the face of all of this bullish price action.
The 20min chart is key for watching where the short-term bullish pumps will break to consolidate. When the profile of the RSI in this timeframe starts to move to bearish divergence, I'd expect prices to range between the short-term levels that were broken and tested. On return to the lower levels, it's a place to consider reentering the bullish trend. Additionally, breakouts on the 20min with bearish divergences being invalidated are higher-risk places to consider gaining exposure if any retracements were missed to buy.
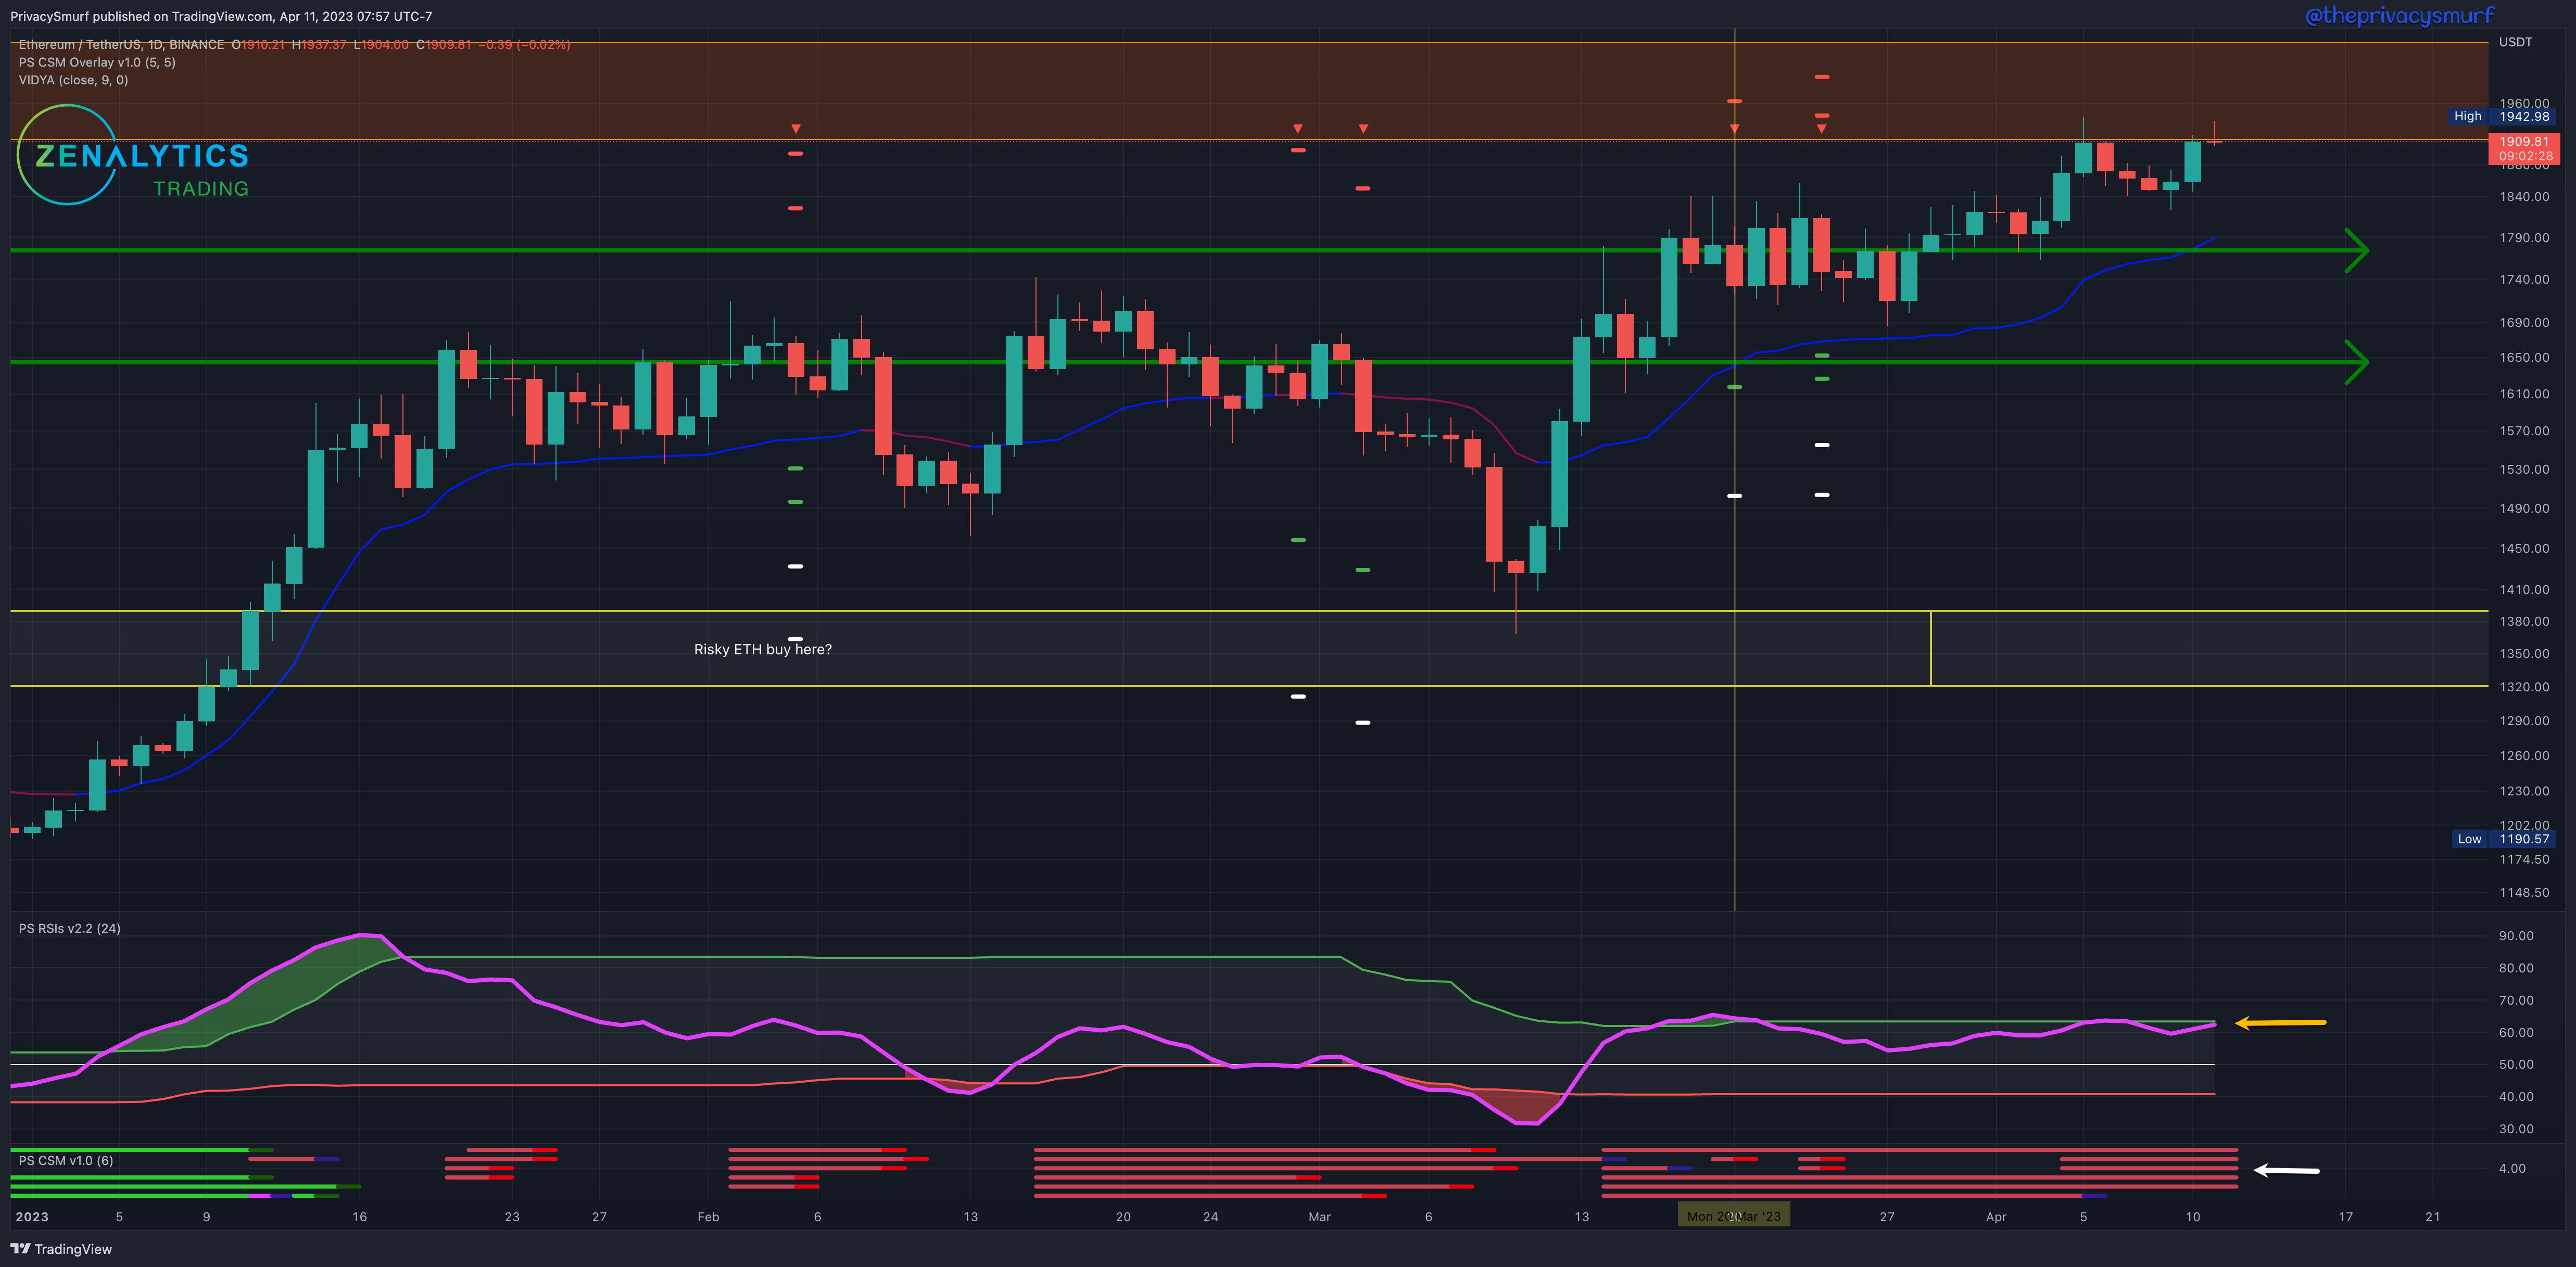
As long as daily closes remain above $1800, I have little interest in a short bias. This floor will likely move up with each resistance break.
The other analytical posts for the short-term and long-term section subscribers will be back up this week as I've transferred most of that data over the break. Next week I'll resume the midweek update in the Short-Term Traders section. I also have a new chart layout I'll be sharing in the next week or two that I've been marking up to illustrate trading phases. There will be layouts for both short-term and long-term sections.
I've started filling out the list of all the scripts I've designed for Tradingview. Some are free some are available for purchase. I'm going over each of those in the Tools section. I'll have posts for each and videos up as well.