I may not know all the ins and outs of the crypto ecosystem, but I can make dollars with it, so it makes sense to me…
Where are we now?
Bitcoin is FINALLY bullish again on a daily timeframe basis. Risk exposure in the market has made another bullish rotation and is setting up another. Retail sentiment has maintained bullish support.
What does all that mean?
The larger-scale bull market is still on. Hopefully, we have just witnessed the next breakout, which will propel us up towards the end of the year. You should understand it won’t be a vertical move. We may be seeing our first area of resistance. We will chop through it in time, but week over week over week of bearish action may be done until late this year or next year.
Let’s observe the latest changes in 4 key market metrics.
Total Market Weekly Structure
https://www.tradingview.com/chart/FEeyCH3q/
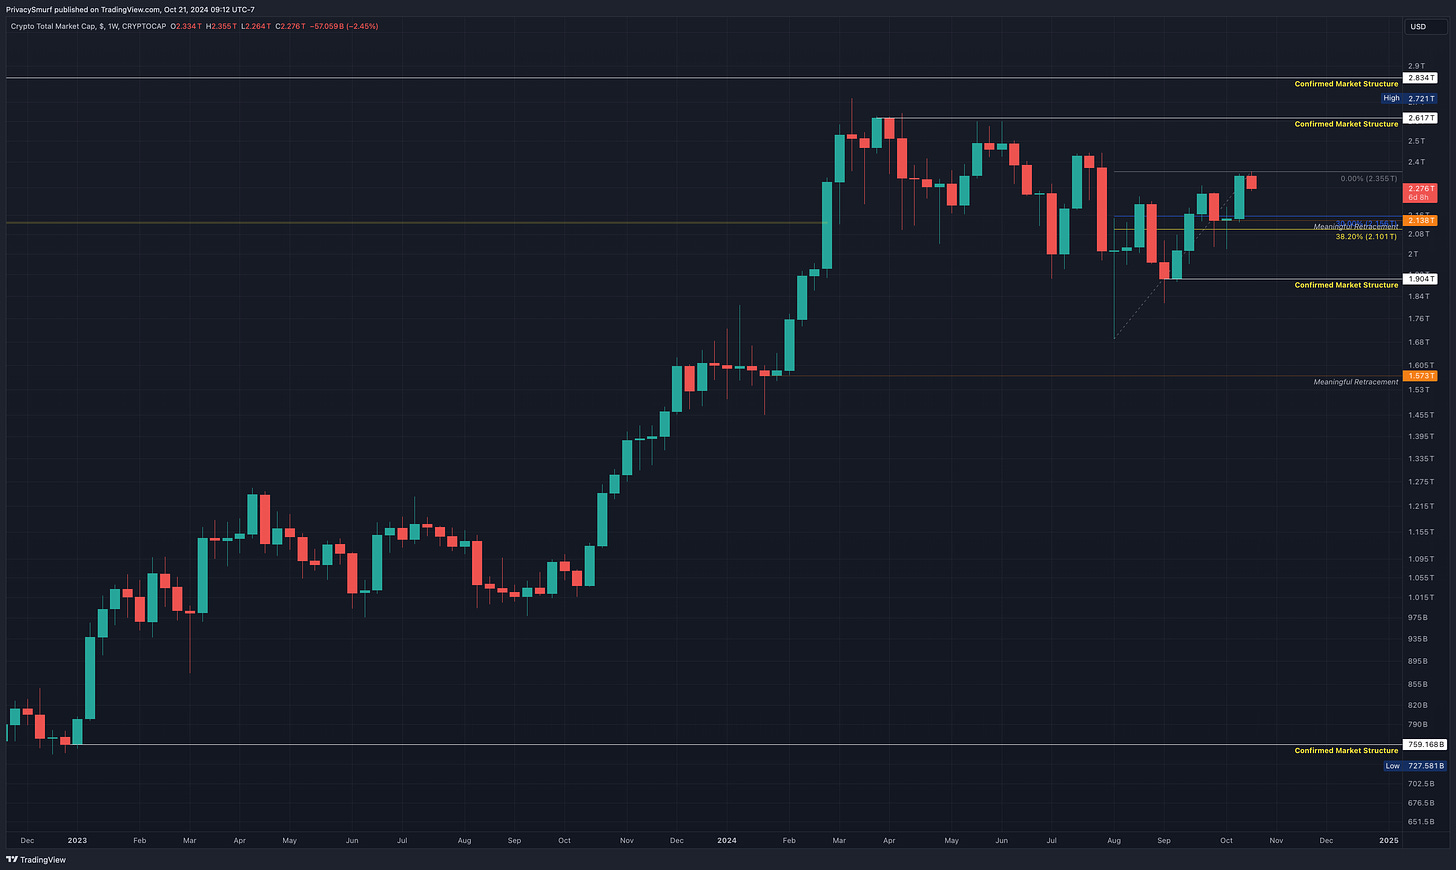
No new changes. Last modification Sept 23, 2024:
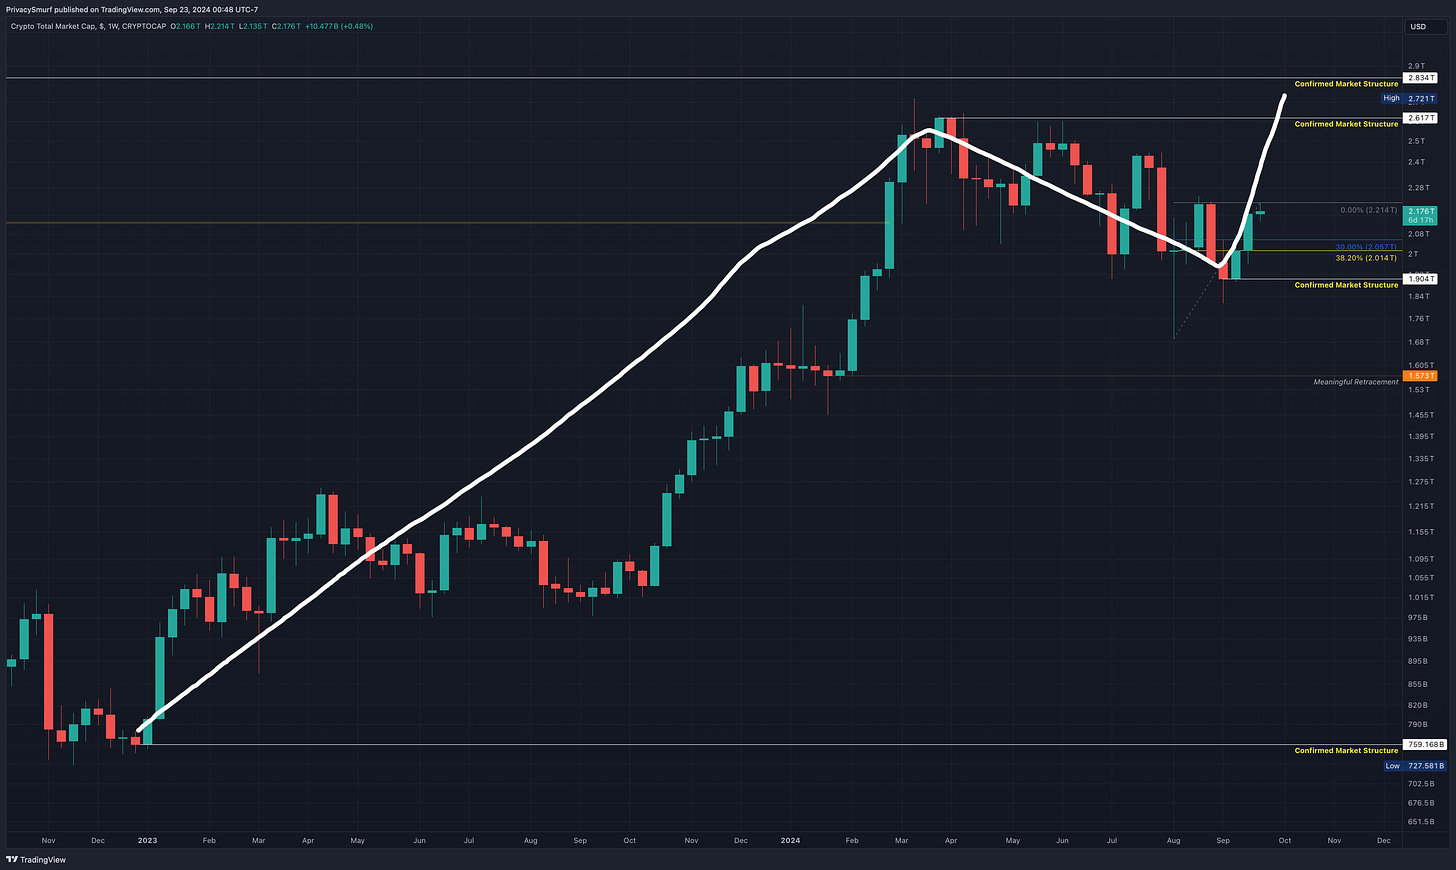
By my rules, the weekly structure trend is still bearish. There are a few possible outcomes from here, but ideally, we will see an eventual close above 2.617T to confirm a trend shift to bullishness on the weekly timeframe. Otherwise, a close below 1.904T will invalidate the recent support structure and delay the bullish trend.
Below is the ideal scenario beginning with the low point at the turn of 2022- 2023, to a high point in March 2024 to a higher low in early September—the baby steps of a bullish trend (low, high, higher low…). Next, we need to close above 2.617T to confirm the trend shift (our higher high).
Total Market Daily Structure
https://www.tradingview.com/chart/25yQcZV1/
New changes!!
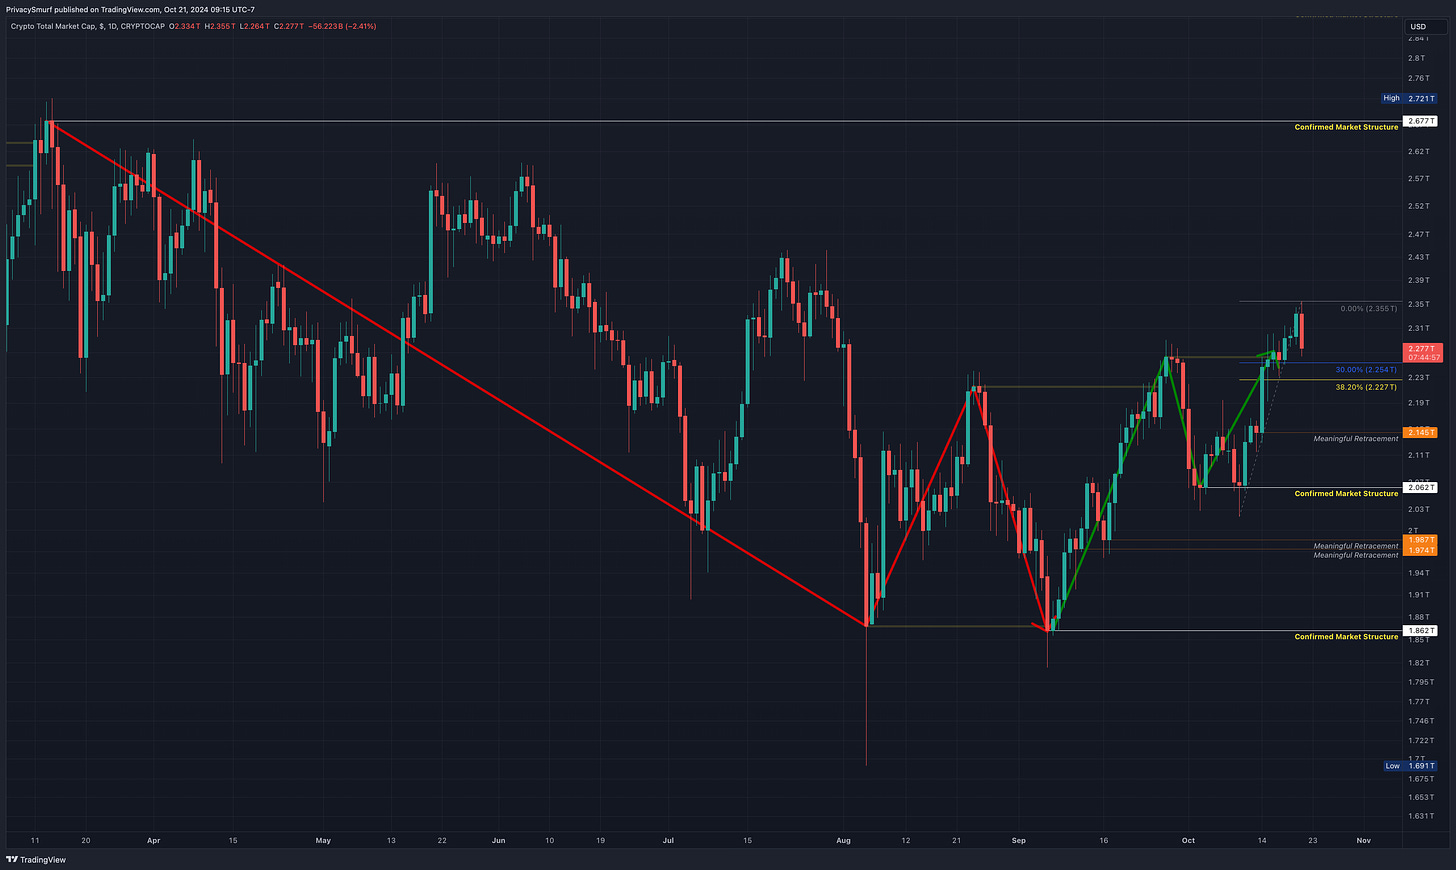
Last modification Oct 16 2024:
The daily market structural trend has shifted to bullish with the close above 2.263T. Now we track prices as they move higher waiting for a retracement deep enough to confirm a resistance. At the moment there needs to be a daily close under 2.227T to put a resistance up at the highest close at 2.334T. There is a level below the current marketcap at 2.145T. This level may be a potential support.
Crypto Money Flow
https://www.tradingview.com/chart/E249oVQY/
New changes!!
Last modification Oct 1 2024:
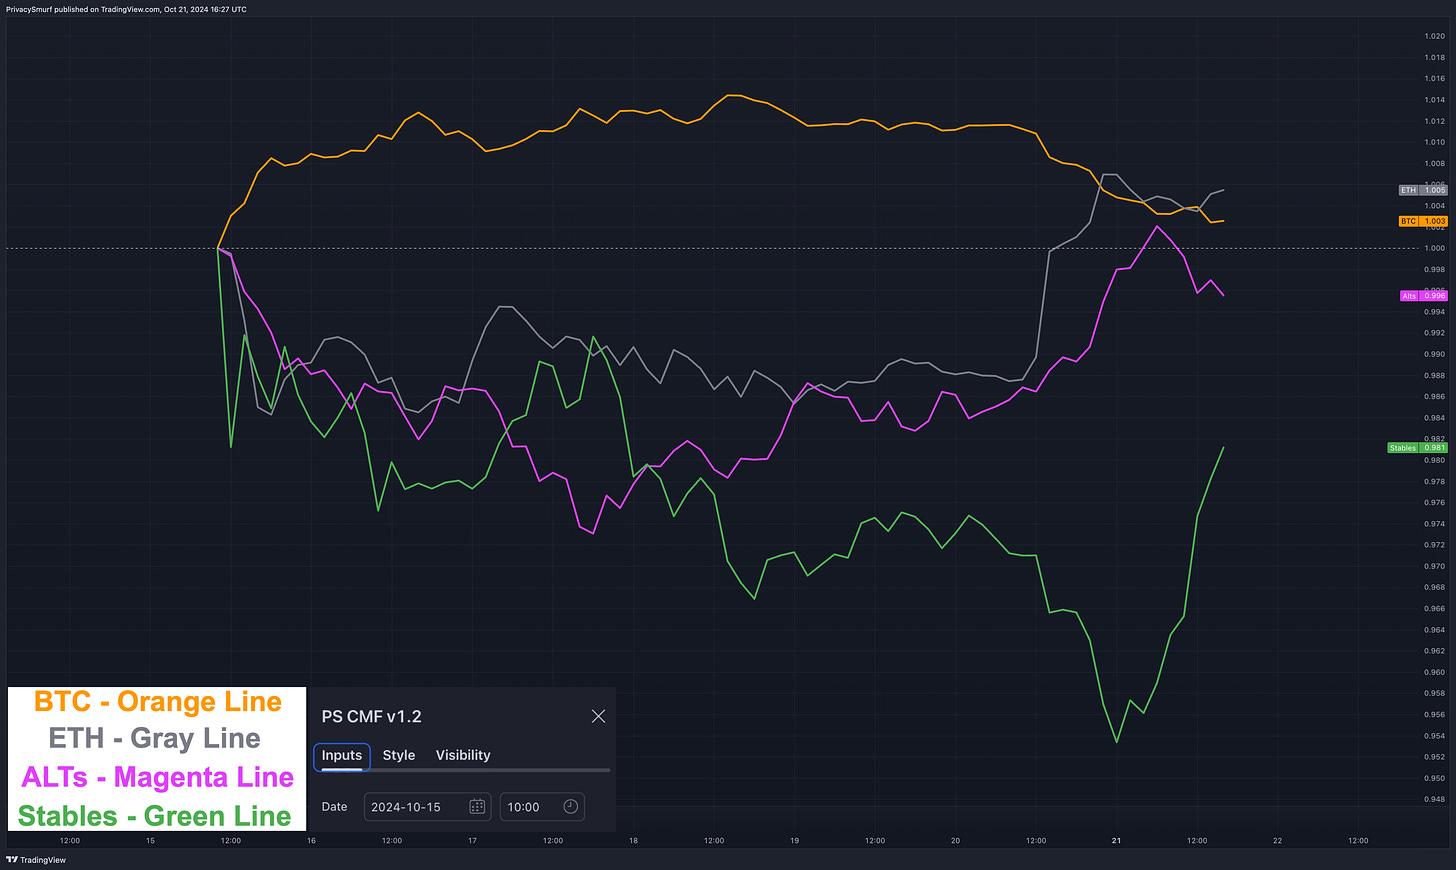
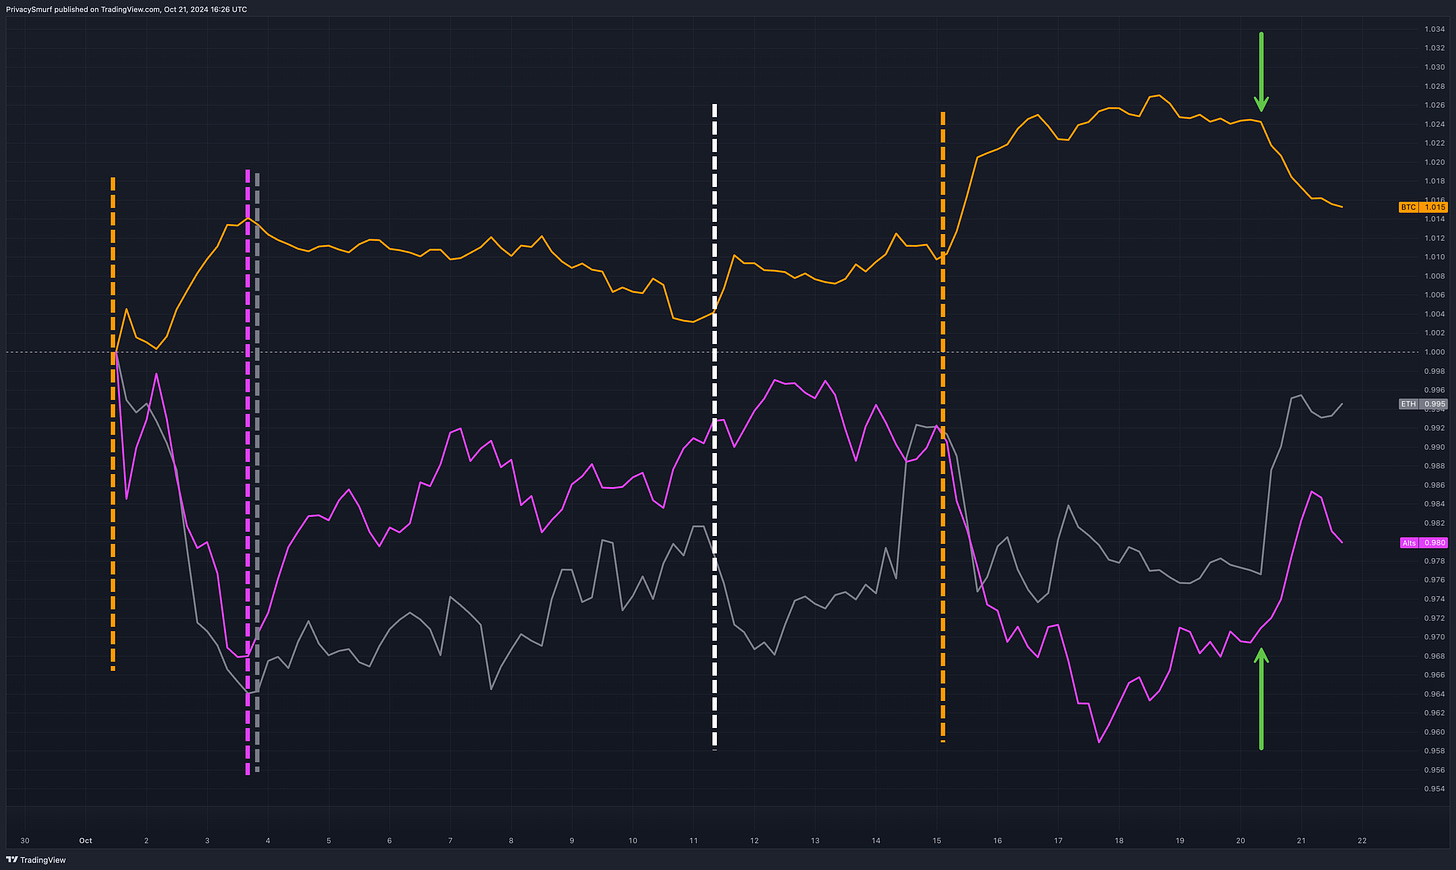
The starting point for the latest rotation on the Crypto Money Flow chart has been updated: October 15, 2024, at 10:00 UTC, as seen above.
In the image below we can see how the previous rotation has played out along with where we are marking the current rotation starting point in the rightmost orange line. We also may be starting an ETH & ALT rotation.
I’v removed Stables to highlight the rotation between the risk on assets a bit better. The segment after the first orange line shows BTC gaining in traders allocation. Around Oct 4th, right of the grey and fuchsia line the BTC gains were rotated into ALTs primarily. At the white line on the Oct 11 there was a brief period of consolidation before the start of the next rotation led my a strong move into BTC at the next orange line. This is the cure for the rotation labeled above. With BTC at resistance and ETH and ALTs gaining marketcap it’s possible we are moving the BTC profits into other coins now (green arrows)
Additional Crypto Metrics
Retail sentiment is bullish reaching a newer hight, broken out of the recent consolidation but is slightly tracing back. Perhaps there are reservations still among traders about jumping on board the recent move.
The Market Validity Score is testing the resistance at the midline of the chart again. The market is on the verge of being majority bullish. Ideally look for chart that are similar picture to this to buy breakouts on.
What do we do with this information?
SHORT TERM
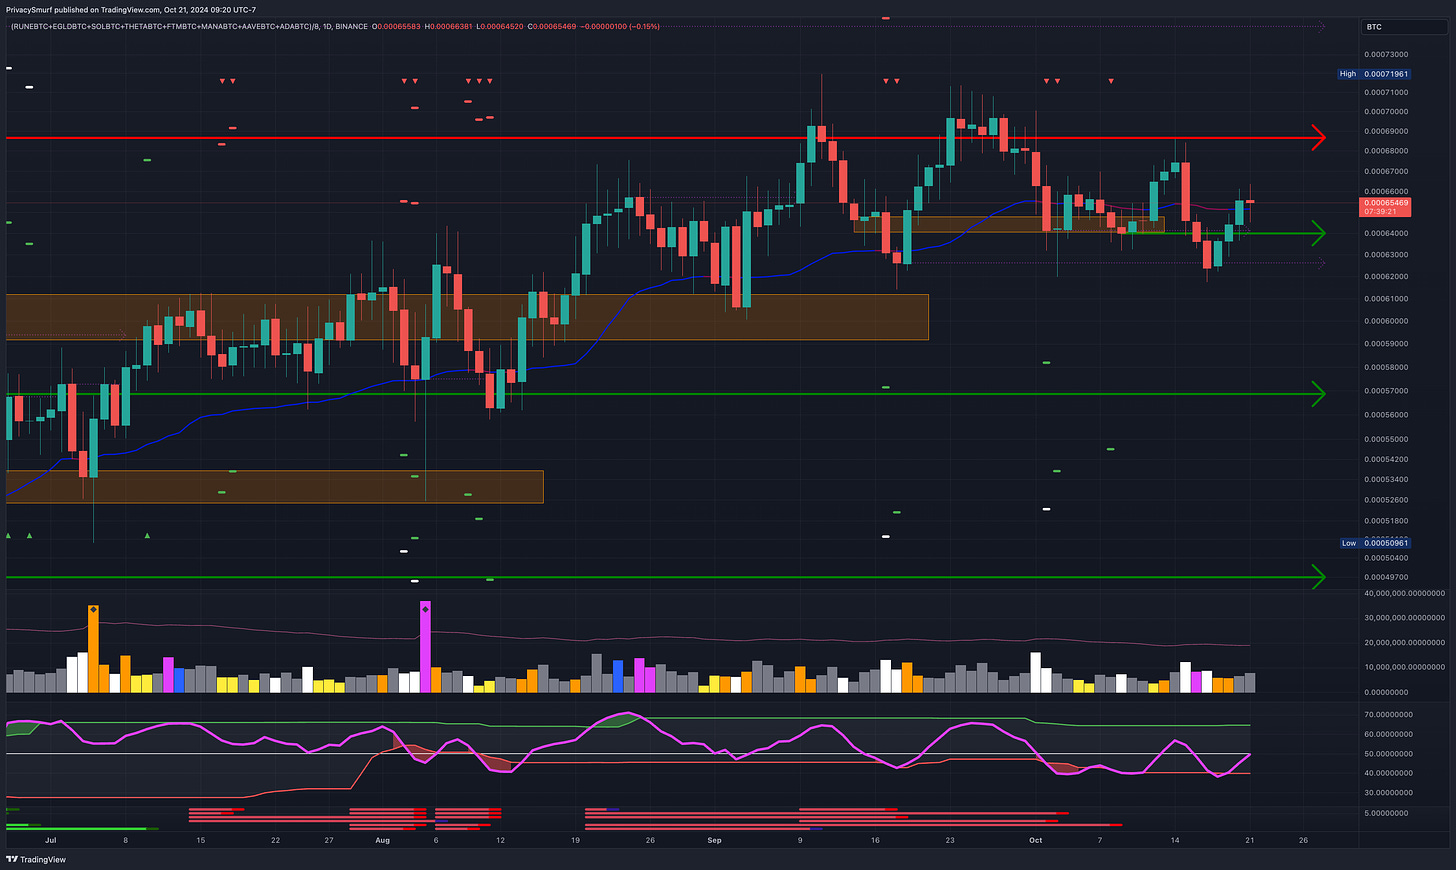
Bitcoin exposure was the name of the game last week. We may have found our resistance. Now it’s time to watch for solid signals on ALT breakouts or support buys on BTC if the market turns to being a retracement instead.
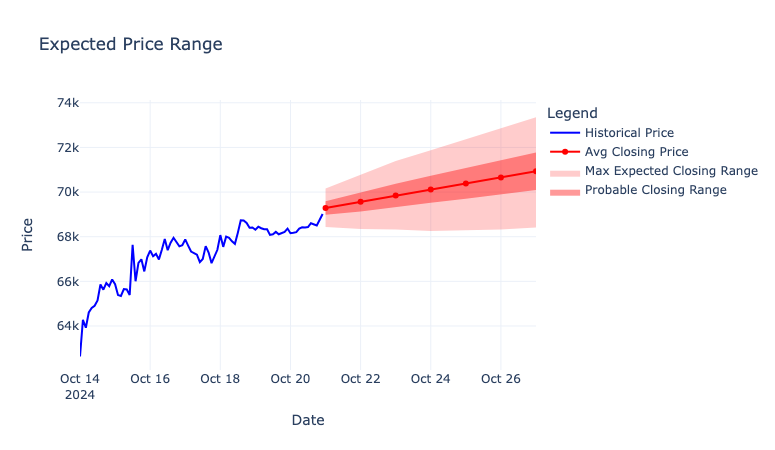
Merging some hard science with the art that is technical analysis now. Stats would put closing prices between $68K to $73K this week for BTC (last week was more bullish)
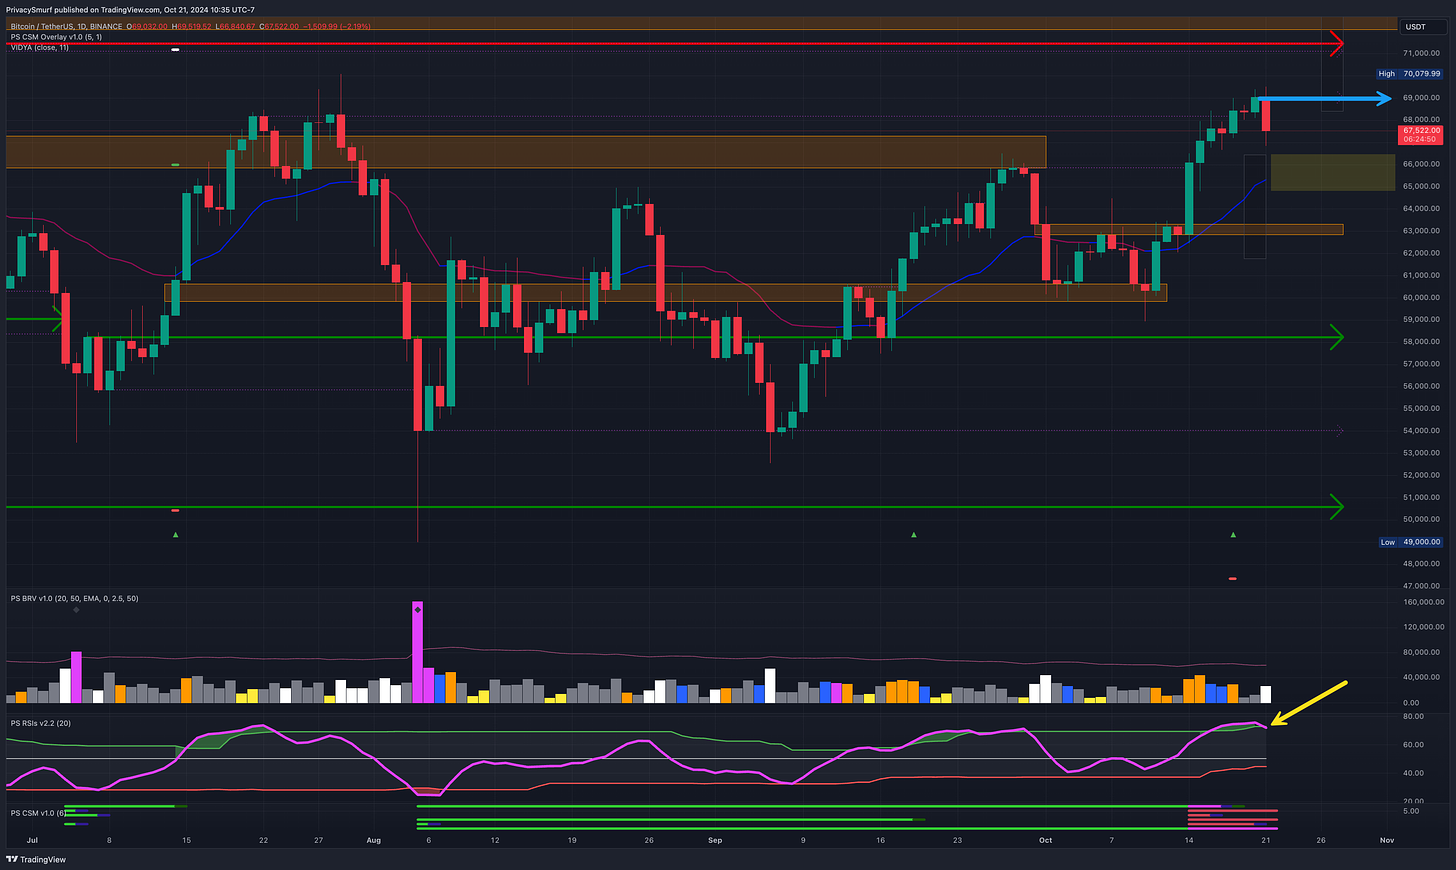
This is a bit more bullish than my expectations and I’ll explain why while borrowing the BTC chart linked at the bottom. The RSI (labeled with the yellow arrow) may be closing back under the top band this would suggest bullish impulsivity is over with for the time being. If this stays teh case by the end of day today I’d be marking a potential ceiling at $69K
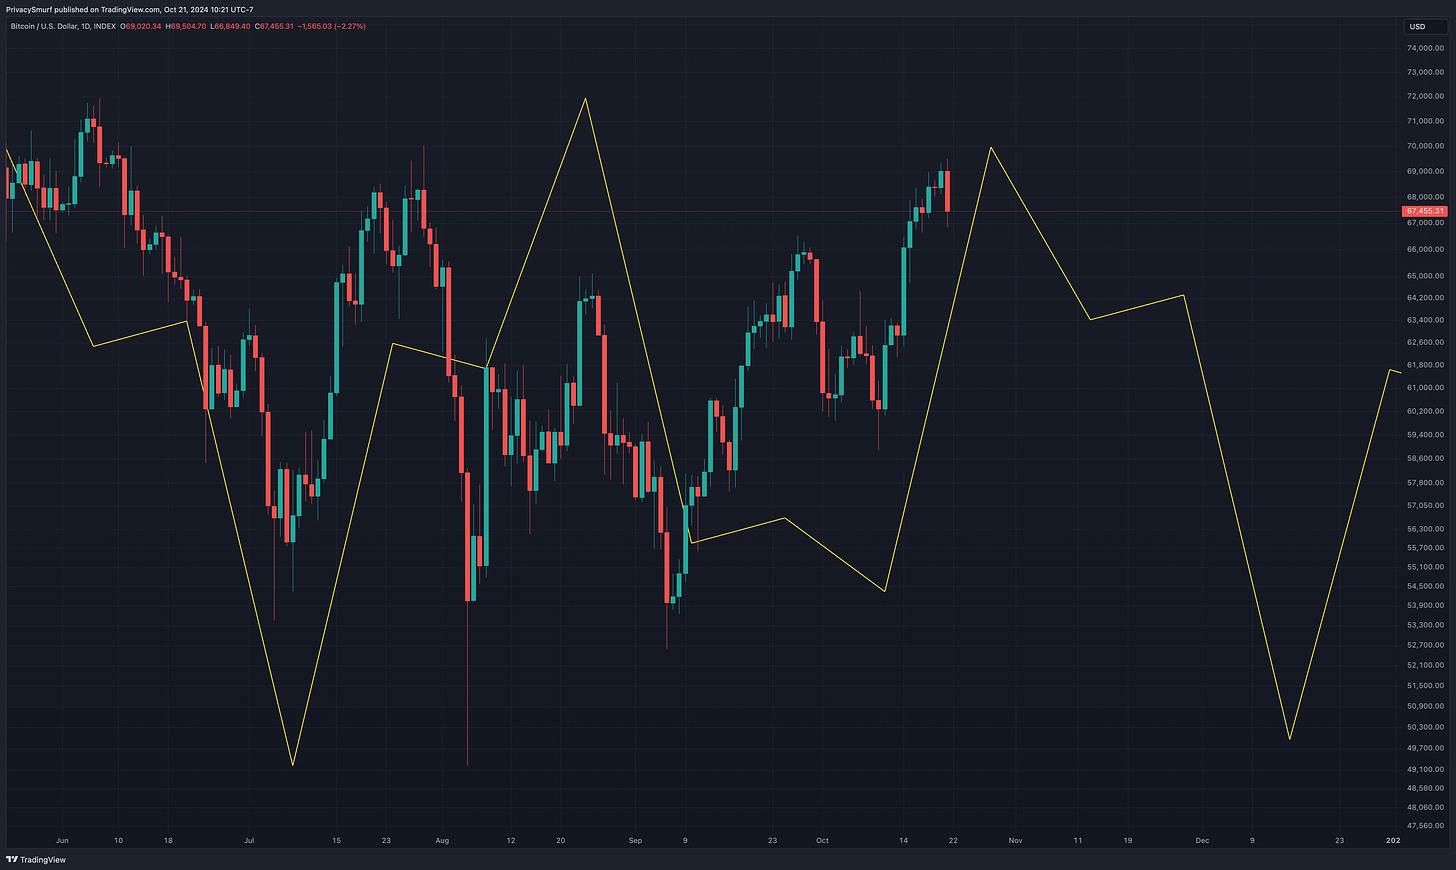
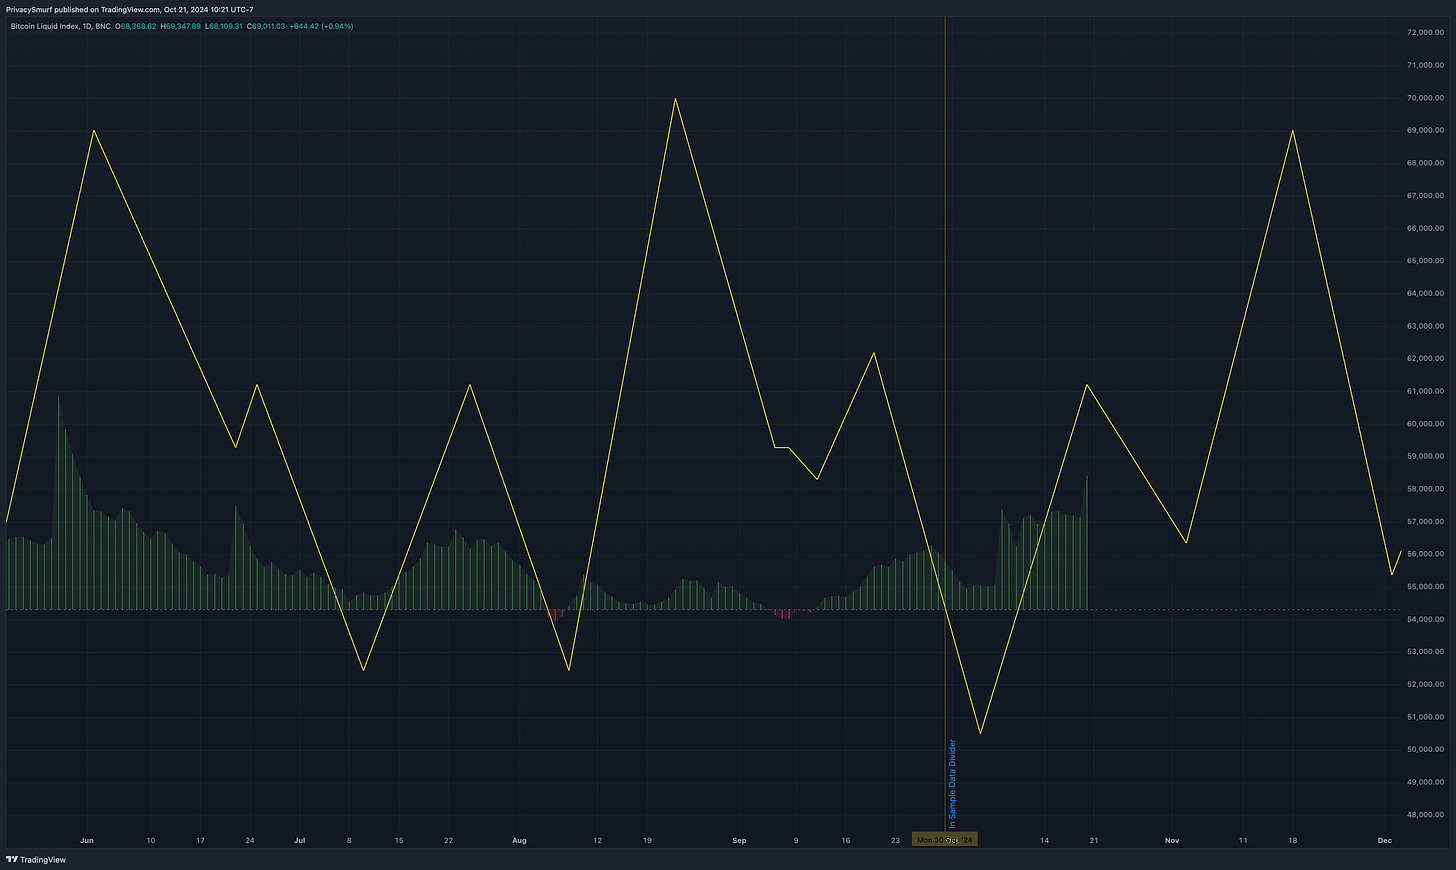
.If for some reason you haven’t read the Q4 analysis, shame on you, but it also backs the notion we may be entering a period of stagnation for a bit. You could have known this ahead of time. Below show if historical patterns continue BTC will experience short pause in the unhindered bullishness for a couple weeks, possibly resuming early November
The same is suggested when looking at patterns in the on chain data. The Spent Output Profit Ratio (SOPR) from Glassnode also shows that folks may be transacting with BTC that was purchased at a higher price. From a pattern analysis standpoint, this is by far one of the more accurate on chain metrics I’ve found, with fewer deviations than studying BTC price action
Overall, I’d be looking in a range from $65K to $70K for closes this week on BTC, with $65 -$66.5K being the range to look for bounce buys.
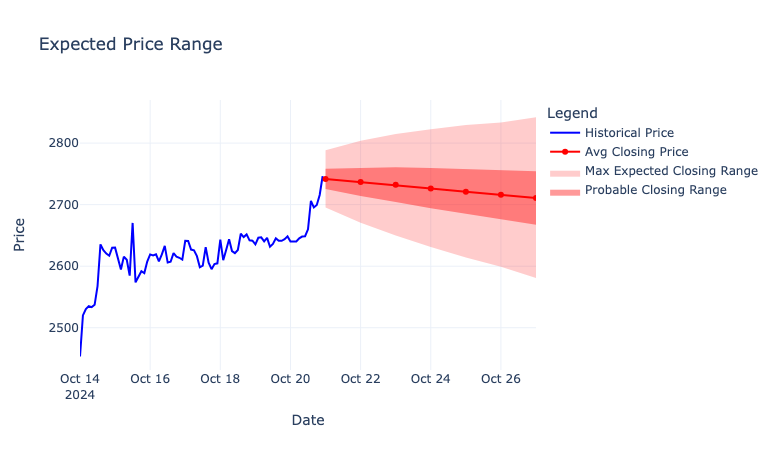
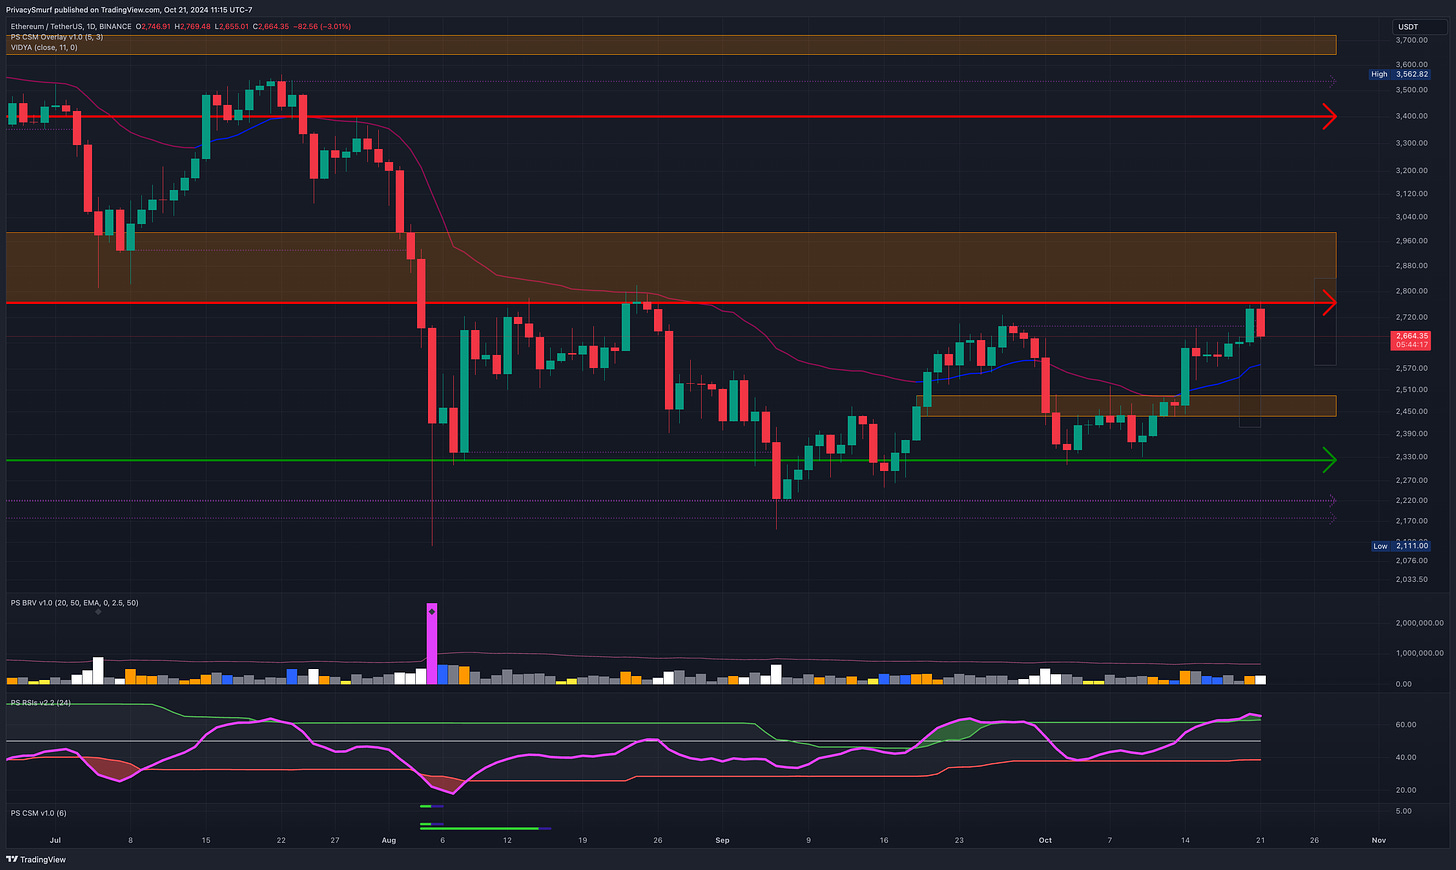
I got my code finished so we can move to ETH, stats would put closing prices between $2581 to $2842 this week for ETH. I feel ok with this for closes this week and don’t have anymore commentary than the supports and resistances marked on the chart I link to at the bottom.
LONG TERM
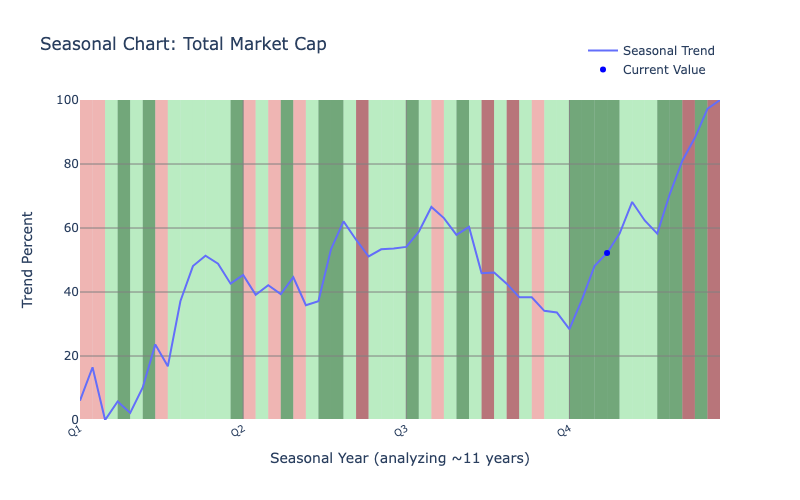
My long-term horizons are unchanged and I anticipate higher prices at the end of the year. The crypto market has struggled its way through all the seasonal bearish times and has no more historical headwinds for the year as shown in the chart below. Any major declines outside of the mid quarter profit taking are all new occurances.
As posted a couple weeks back, the daily chart for BTC signaled a bullish trade based on bullish divergence. The Initial target is around 74K and secondary target around 84K. This aligns with my expectations for pricing on the market top this year. Again this year, same as the 2021 bull run, I’m not expection +100K before the years end.
That’s all for this week’s analysis.
Welcome to the beginning of the end!
You are a true fan of Technical Analysis. Here are some extras to dig into.
Did any of the above sections not make any sense? Try catching up with these explainer posts.
Click the links below if you need a refresher on the checkpoint elements.
Got any questions? Pop into the discord and chat.
*https://discord.gg/MuMP5VUeM9*
Did you miss the Q4 analysis I dropped last week? Check that out here!
https://zenalytics.notion.site/2024-Q4-57593e02f4154db093272183fc9918d1?pvs=74
Read a post about what everyone is getting wrong about the Bitcoin Halving and BTC price action.
Below are the charts I use for my BTC, ETH, and ALT trading. I think I’ll start making short videos about each of them occasionally.
This image is above in my SHORT TERM commentary
See you in next week’s market update!
@theprivacysmurf

