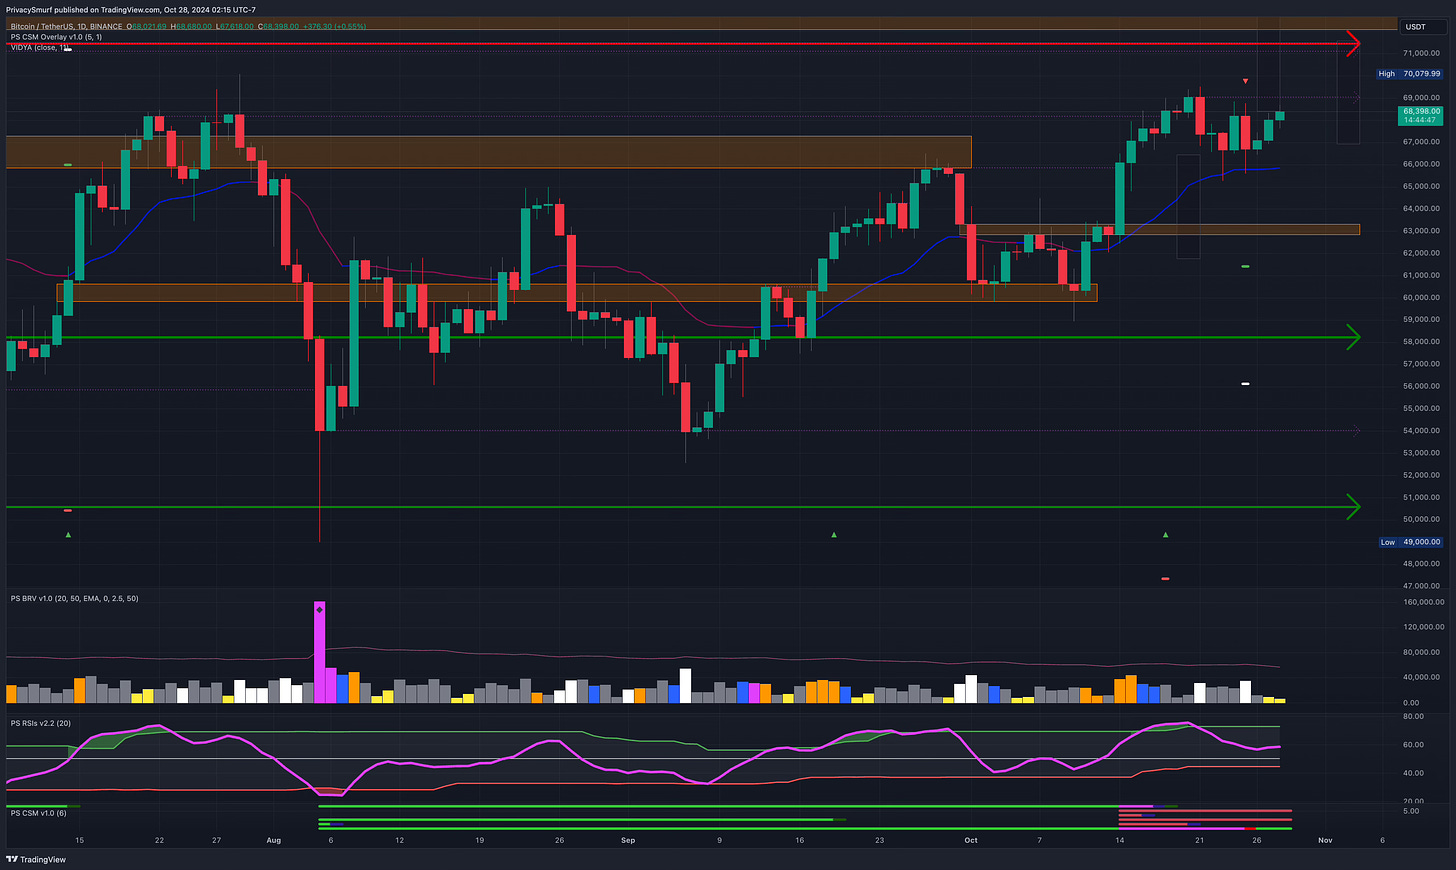
Bitcoin is in rising consolidation, buiding up between a resistance and a higher low. This chart structure has me saying ‘ooh la la!’
Where are we now?
Bitcoin is remains bullish on the daily timeframe. Risk exposure in the market has made another bullish rotation and is setting up another larger move. Retail sentiment has maintained bullish support.
What does all that mean?
The larger-scale bull market is still on. Hopefully, we are on the verge of the next breakout towards the ATH. Keep in mind that break will come with plenty of back and forth volatility, not just straight up pricing.
Let’s observe the latest changes in 4 key market metrics.
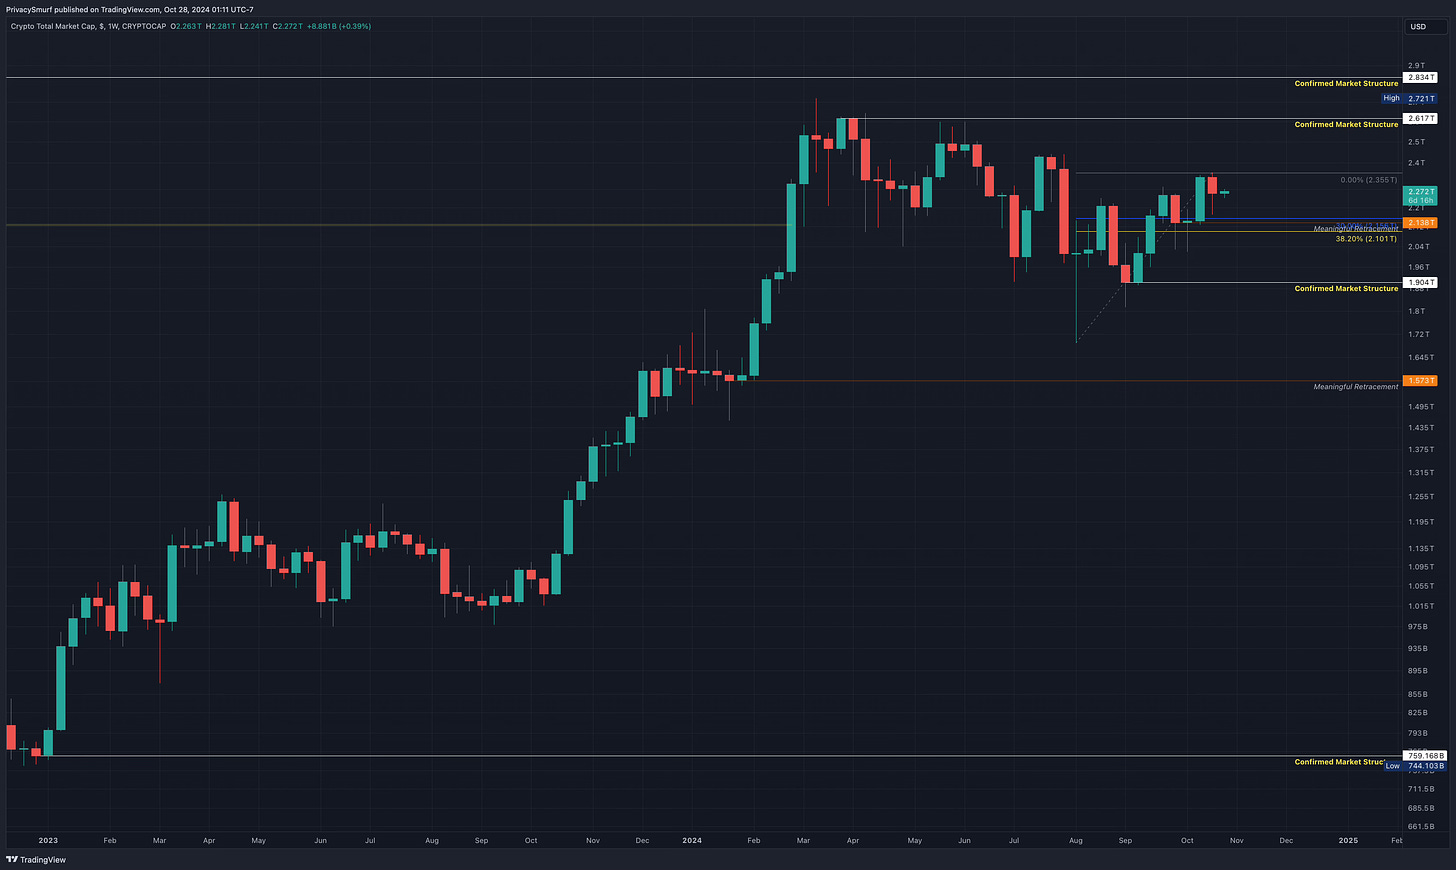
Total Market Weekly Structure
https://www.tradingview.com/chart/FEeyCH3q/
No new changes.
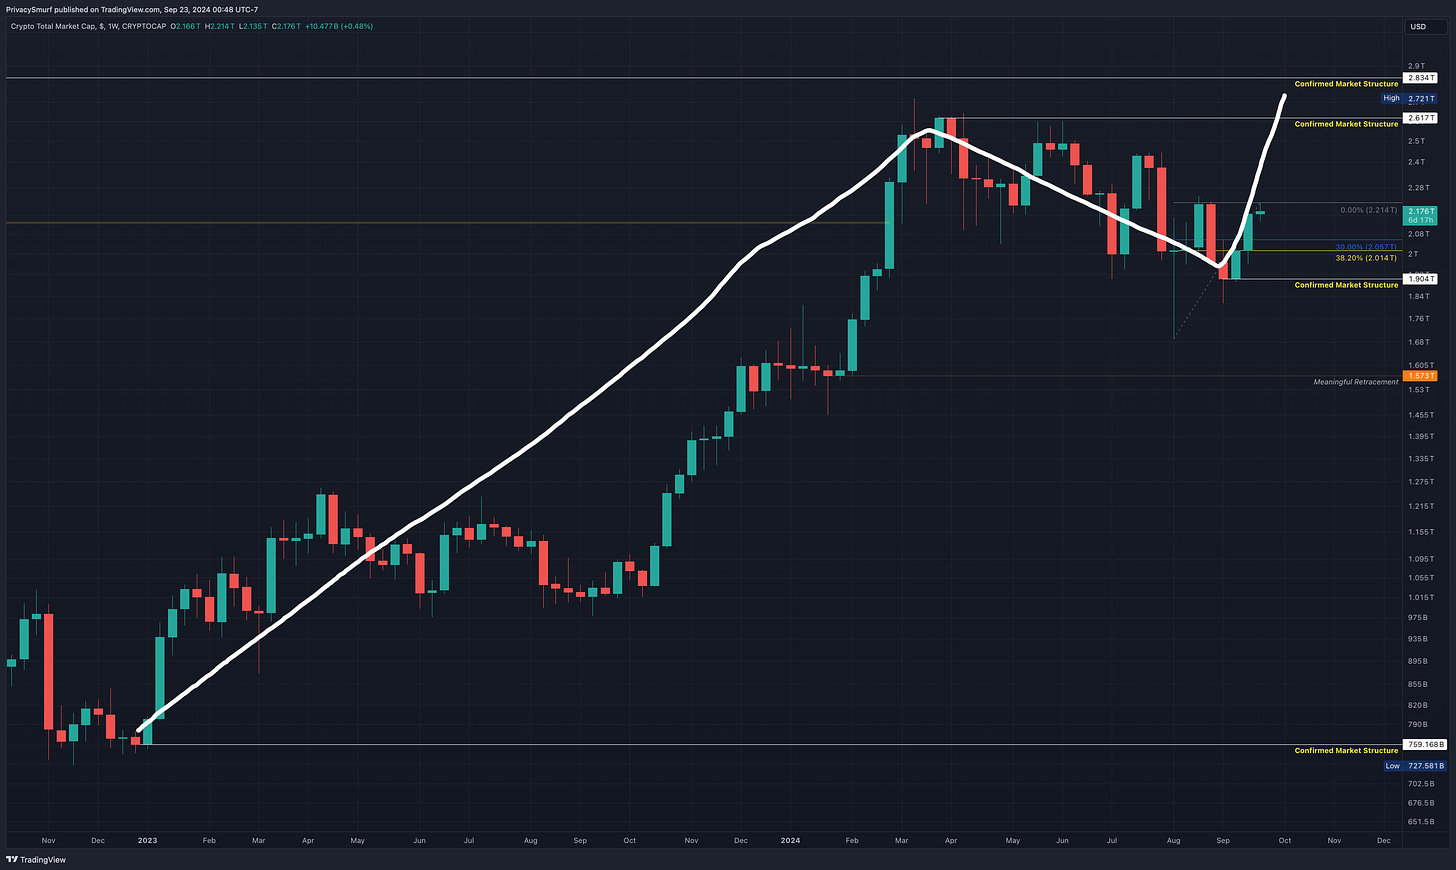
Last modification Sept 23, 2024:
By my rules, the weekly structure trend is still bearish. There are a few possible outcomes from here, but ideally, we will see an eventual close above 2.617T to confirm a trend shift to bullishness on the weekly timeframe. Otherwise, a close below 1.904T will invalidate the recent support structure and delay the bullish trend.
Below is the ideal scenario beginning with the low point at the turn of 2022- 2023, to a high point in March 2024 to a higher low in early September—the baby steps of a bullish trend (low, high, higher low…). Next, we need to close above 2.617T to confirm the trend shift (our higher high).
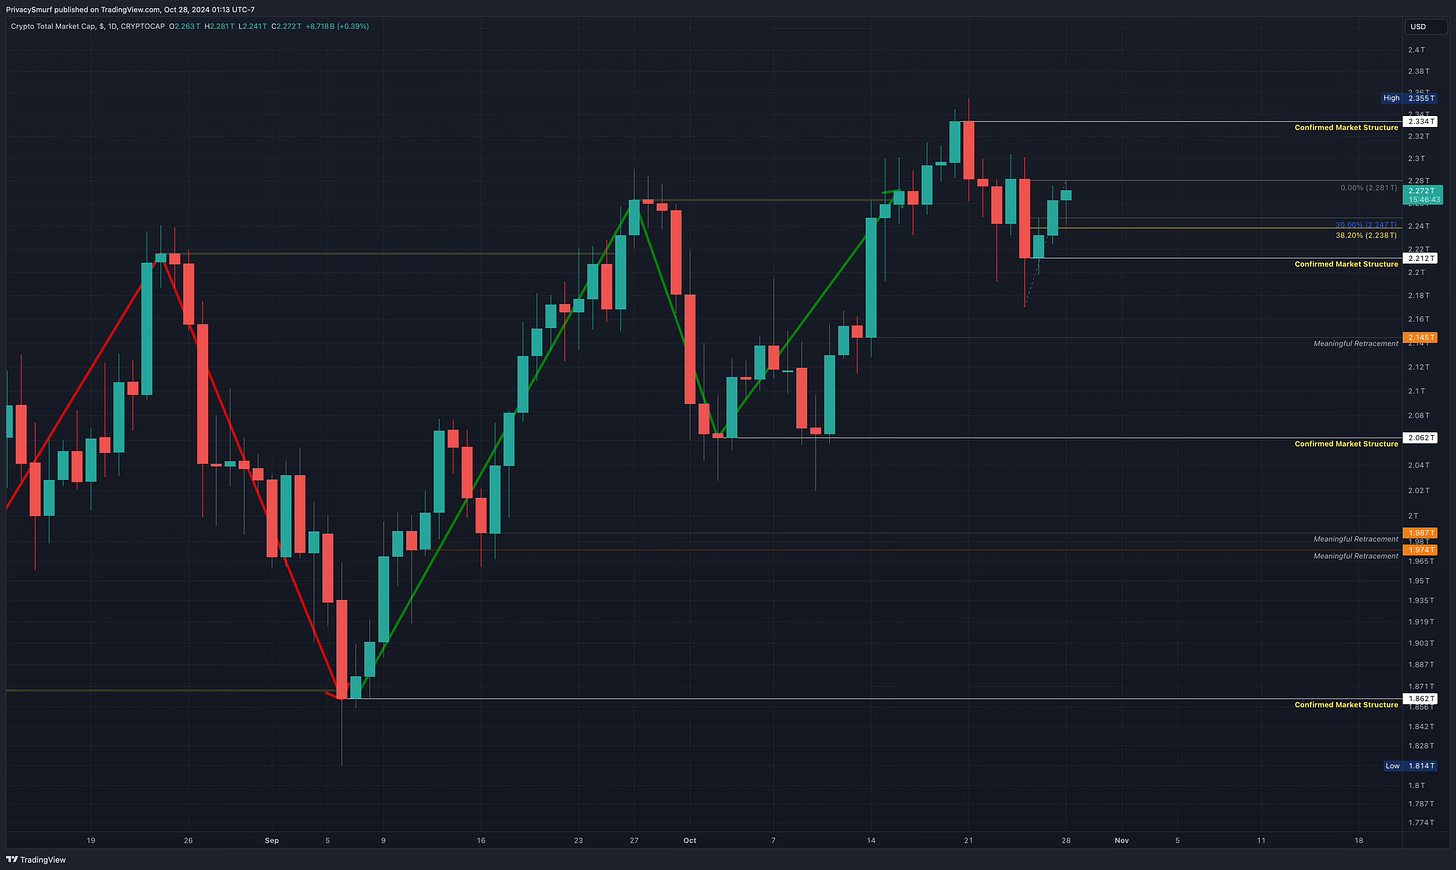
Total Market Daily Structure
https://www.tradingview.com/chart/25yQcZV1/
New changes!!
Last modification Oct 25 & 27 2024:
The daily market structural trend remains bullish. As last week progressed there was enough retracement to confirm a structural resistance at 2.334T, followed by a rally high enough to confirm a higher low structural support at 2.212T in our recently created bullish trend.
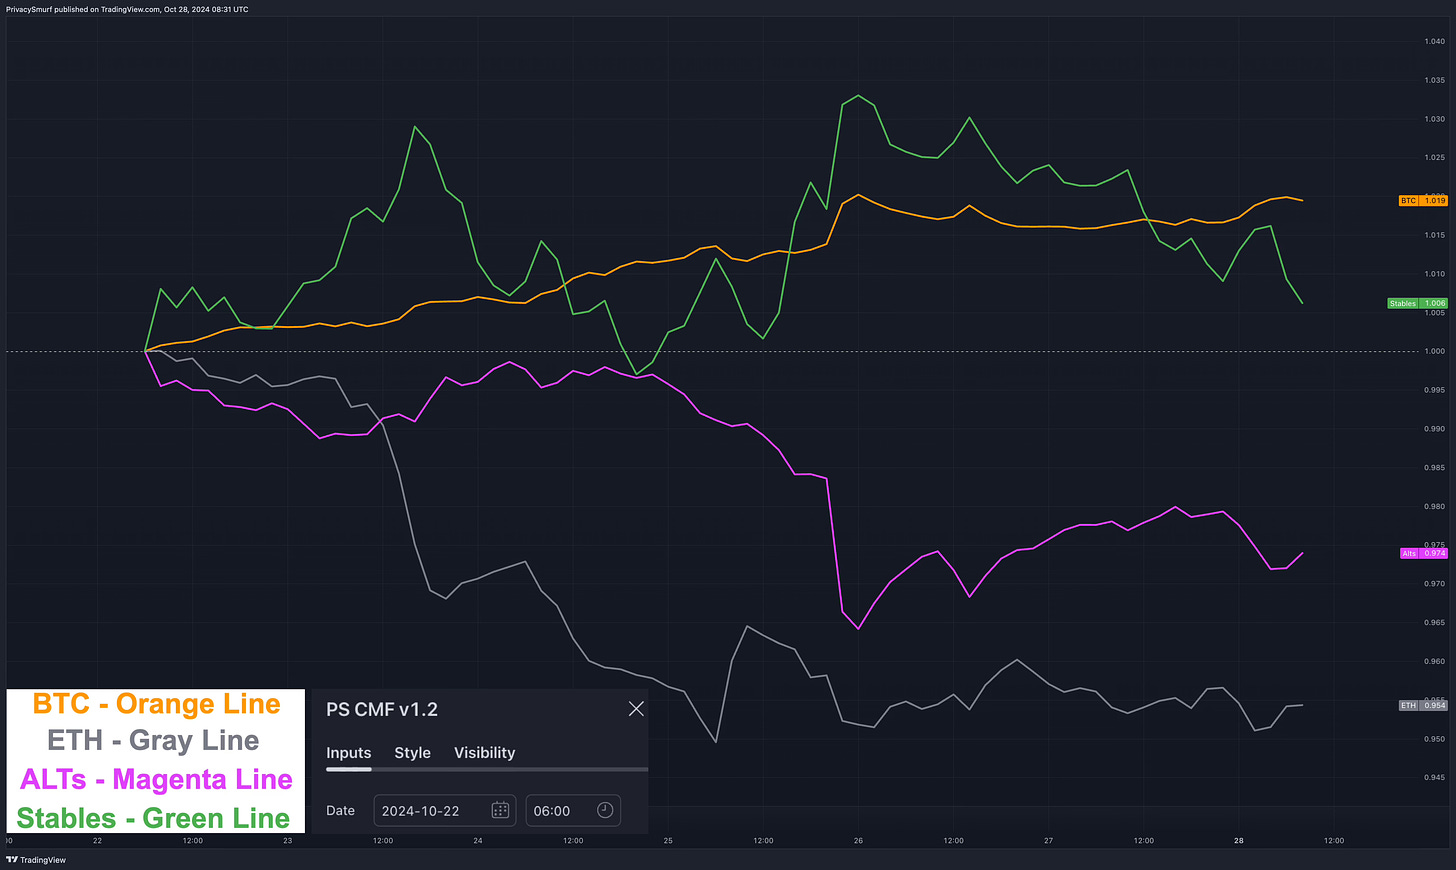
Crypto Money Flow
https://www.tradingview.com/chart/E249oVQY/
New changes!!
Last modification Oct 15 2024:
The starting point for the latest rotation on the Crypto Money Flow chart has been updated: October 22, 2024, at 06:00 UTC, as seen above.
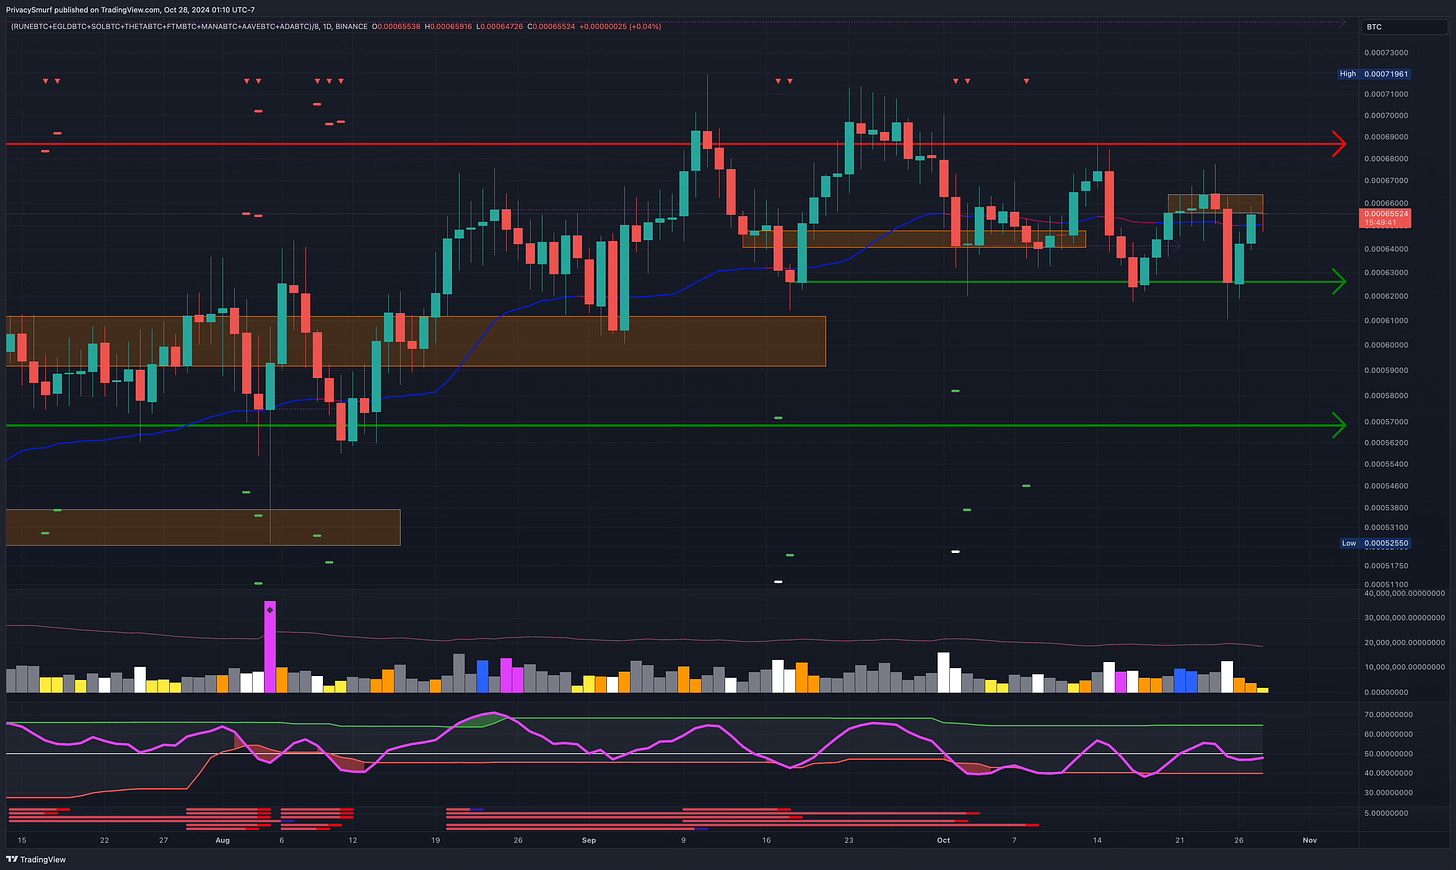
Last week I noted that we were possibly moving into the rotation from BTC into ETH. & ALTs. That did occur but was quite short lived. By the time this was evident on the charts, everything flipped back towards BTC allocation by Tuesday. BTC allocation has steadily been growing over the last week while price has mostly consolidated in a range. This suggests to me a bullish move sometime in the near future as soon as consolidation is completed.
Additional Crypto Metrics
Retail sentiment is bullish but has fallen back into the colosildation range above the midline. There’s a lack of enthusiasm and optimism regarding BTC. “UP-tober” hasn’t delivered and I imagine folks are becoming aprehensive for the possibilites of bullish returns.
The Market Validity Score was rejected from the midline and majority of assets continued the descent into bearish territory. I estimate this is the response to the increasing BTC exposure.
What do we do with this information?
SHORT TERM
ALT exposure didnt play out last week, BTC support buys presented themselves. Resistance was confirmed. BTC support buys presented themselves. They may still yet again this week, but a bullish breakout is on the horizon.
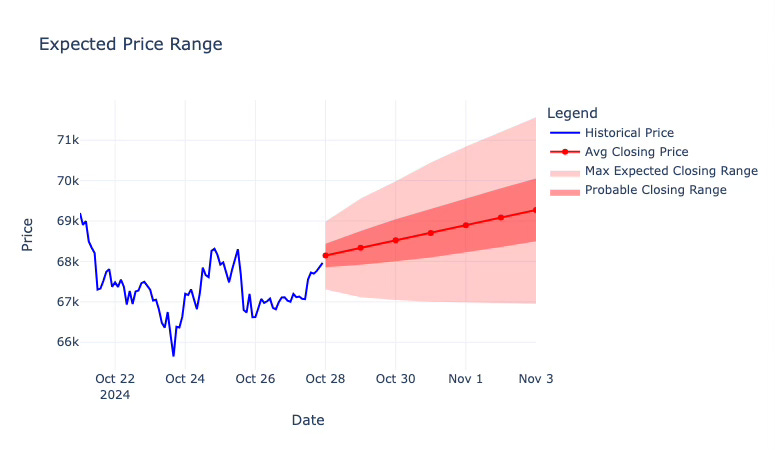
Merging hard science with the art that is technical analysis, stats would put closing prices for the week between $67K to $71.5K for BTC. Last week was more bearish than probabilities suggested, which I also proposed in my breakdown.
This range for BTC fits quite well with my personal TA. I believe we are building towards bullishness but that may bring with it volatility as we try to break the $69K ceiling.
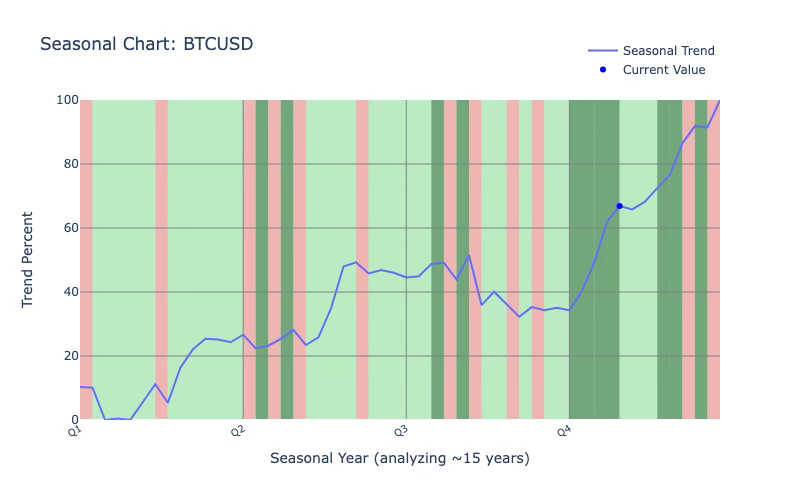
We also have big picture headwinds at the moment both in annual seasonal patterns and more recent fluctuations of price and on chain metrics but those all wrap up over the next couple weeks.
I would be considering buying options on trade signals when/if BTC dips into the $65-$67K region.
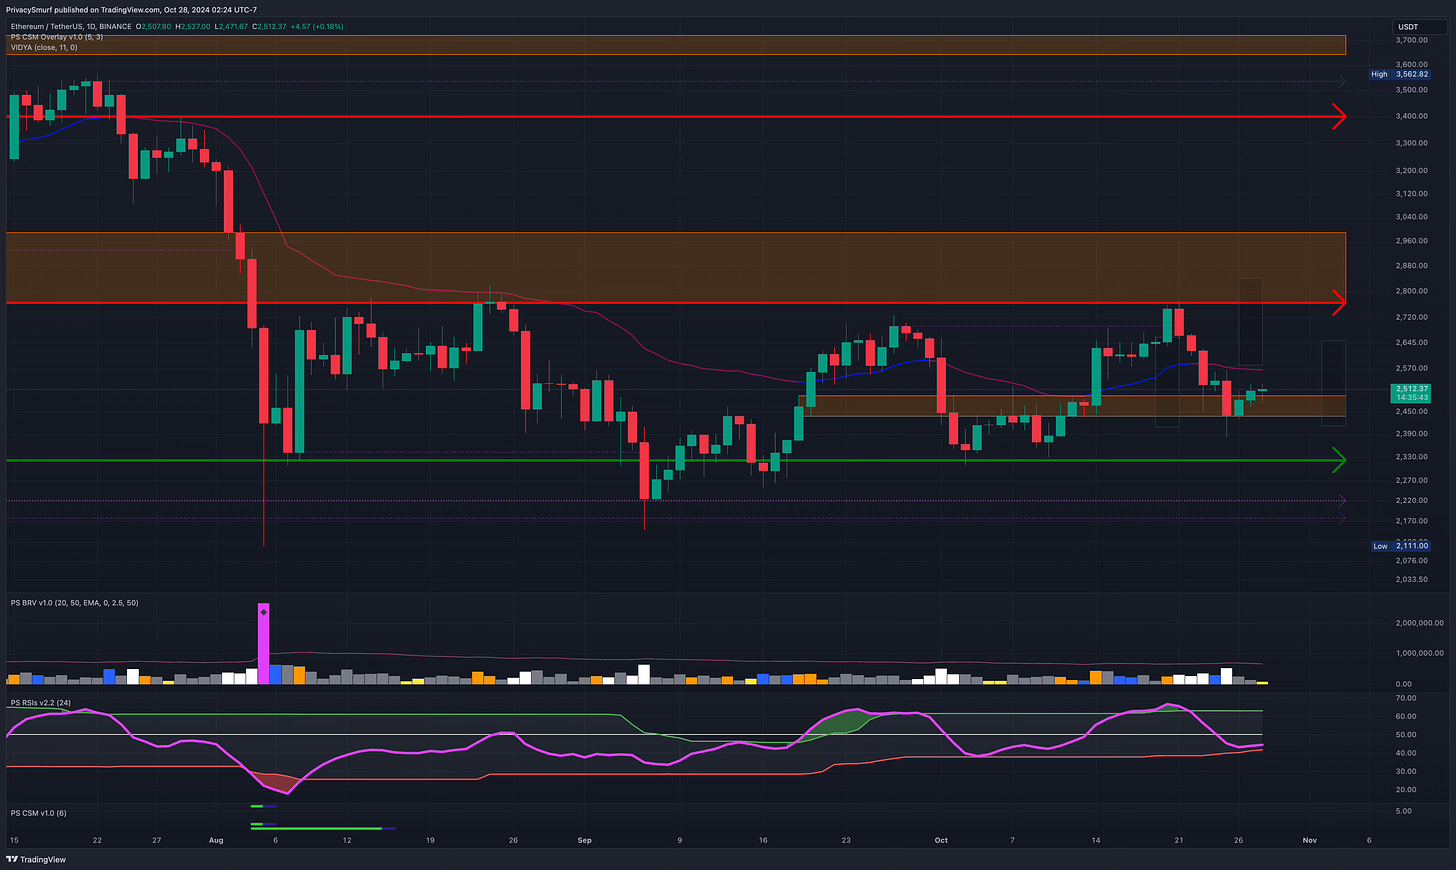
I’m having some serious reservations on continuing analysis on ETH. In terms of price ETH is underperforming (to put it mildly) in relation to BTC. In terms of network effects, ETH has been overtaken in many relevant metrics by SOL. In terms of rotational analysis and pattern analysis it’s frequently been absent as an indicator of rotations and inaccurate/unprofitable as a exposure signal. It will take much more analysis in the near term to determine if SOL currently holds the same sway that ETH once did as a market metric. Either way I’m on top of trying to stay adaptable as the crypto market changes over time.
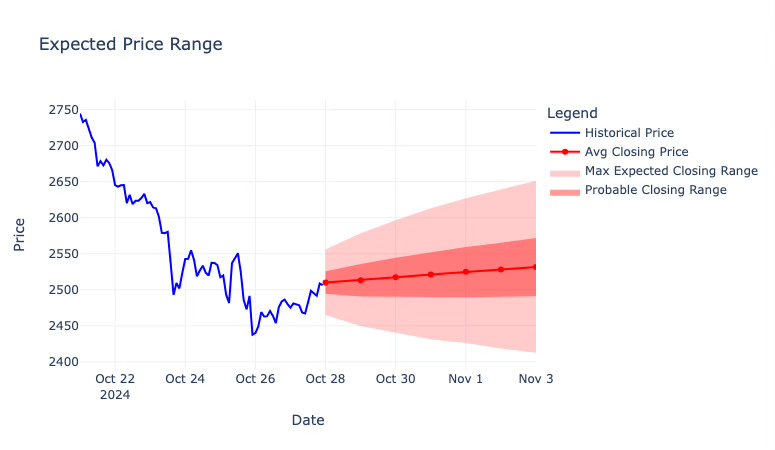
That being said (before I give up entirely on ETH), stats would put closing prices between $2412 to $2651 this week for ETH.
I feel mostly ok with this but it may be a little too bearish. I imagine there will be some retracement if BTC continues gaining in marketcap dominance which will keep ETH at the lower end of the range, but a rising tide lifts all ships, and ultimately ETH will eventually rise in response to BTCs price appreciation. I still expect some level of rejection at the $2800 level.
LONG TERM
My long-term horizons are unchanged and I anticipate higher prices at the end of the year. Something to note on BTC this upcoming week has been historically bullish but the net returns across the years has been negative. This means the fewer bearish weeks that existed were really bad and outweighs the net gains of the bullish weeks. While we are seasonally bullish through the end of the year, this week and next have been lackluster in regards to performance.
Just a reminder on my end of year expectations base on pure technical trade signals. As posted a couple weeks back, the daily chart for BTC signaled a bullish trade based on bullish divergence. The initial target is around 74K and secondary target around 84K. This aligns with my expectations for pricing on the market top this year. Again this year, same as the 2021 bull run, I’m not expecting +100K before the years end.
That’s all for this week’s analysis.
Welcome to the beginning of the end!
You are a true fan of Technical Analysis. Here are some extras to dig into.
Did any of the above sections not make any sense? Try catching up with these explainer posts.
Click the links below if you need a refresher on the checkpoint elements.
Got any questions? Pop into the discord and chat.
*https://discord.gg/MuMP5VUeM9*
Did you miss the Q4 analysis I dropped last week? Check that out here!
Read a post about what everyone is getting wrong about the Bitcoin Halving and BTC price action.
Below are the charts I use for my BTC, ETH, and ALT trading. I think I’ll start making short videos about each of them occasionally.
See you in next week’s market update!
@theprivacysmurf


