I’ve been busy these past few weeks, ensuring I’m staying on top of the market analysis and refining my methods. It feels like my ‘work is never over,’ but it’s all worth it to make the products ‘harder, better, faster, stronger.’ You’ll see some new things soon…
Where are we now?
Bitcoin remains bullish on the daily timeframe, and Bitcoin exposure continues to increase. Retail sentiment has maintained bullishness despite a lack of substantial price gains for “UP-tober.” Expectations from last week's analysis were on point.
What does that mean?
The larger-scale bull market is still on. We have made one attempt to achieve the all-time high. The market continues to allocate towards BTC, suggesting a break of that high will be in the future. Maybe not this week, but it will likely come before the year’s end. Being a US presidential election week, we may get enough price fluctuations to the downside for another support buying opportunity with BTC, but a positive week is expected.
Let’s observe the latest changes in 4 key market metrics to see how I reached this conclusion.
Total Market Weekly Structure
https://www.tradingview.com/chart/FEeyCH3q/
No new changes.
Last modification Sept 23, 2024:
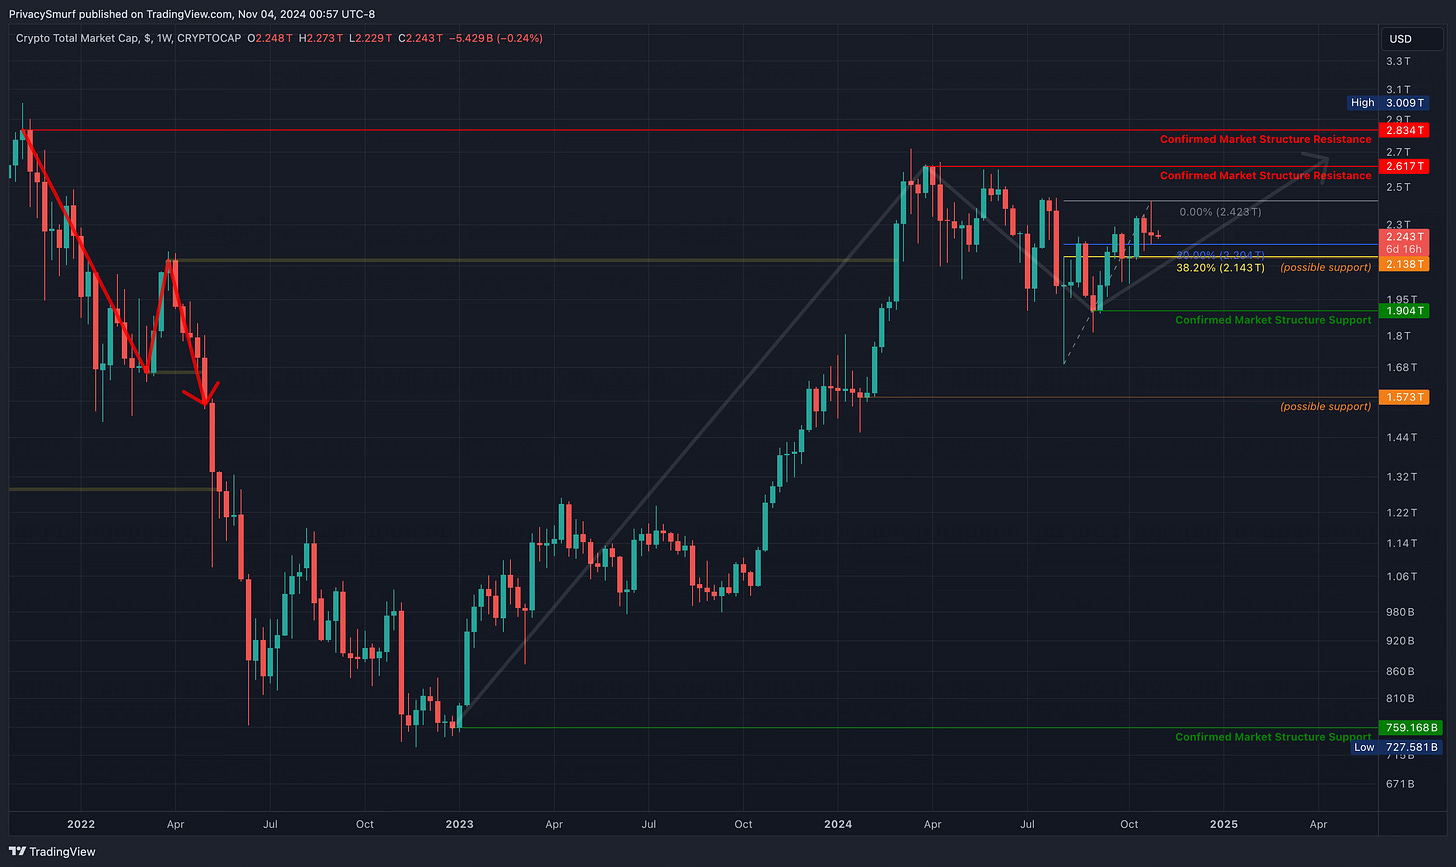
By my rules, the weekly structure trend is still bearish. There are a few possible outcomes from here, but ideally, we will see an eventual close above 2.617T to confirm a trend shift to bullishness on the weekly timeframe. Otherwise, a close below 1.904T will invalidate the recent support structure and delay the bullish trend.
A shaded white arrow on the chart depicts the ideal scenario beginning with the low point at the turn of 2022- 2023, to a high point in March 2024, and a higher low in early September—the baby steps of a bullish trend (low, high, higher low…). Next, we must close above 2.617T to confirm the trend shift (our higher high).
Total Market Daily Structure
https://www.tradingview.com/chart/25yQcZV1/
New changes!!
Last modification Oct 31, 2024:
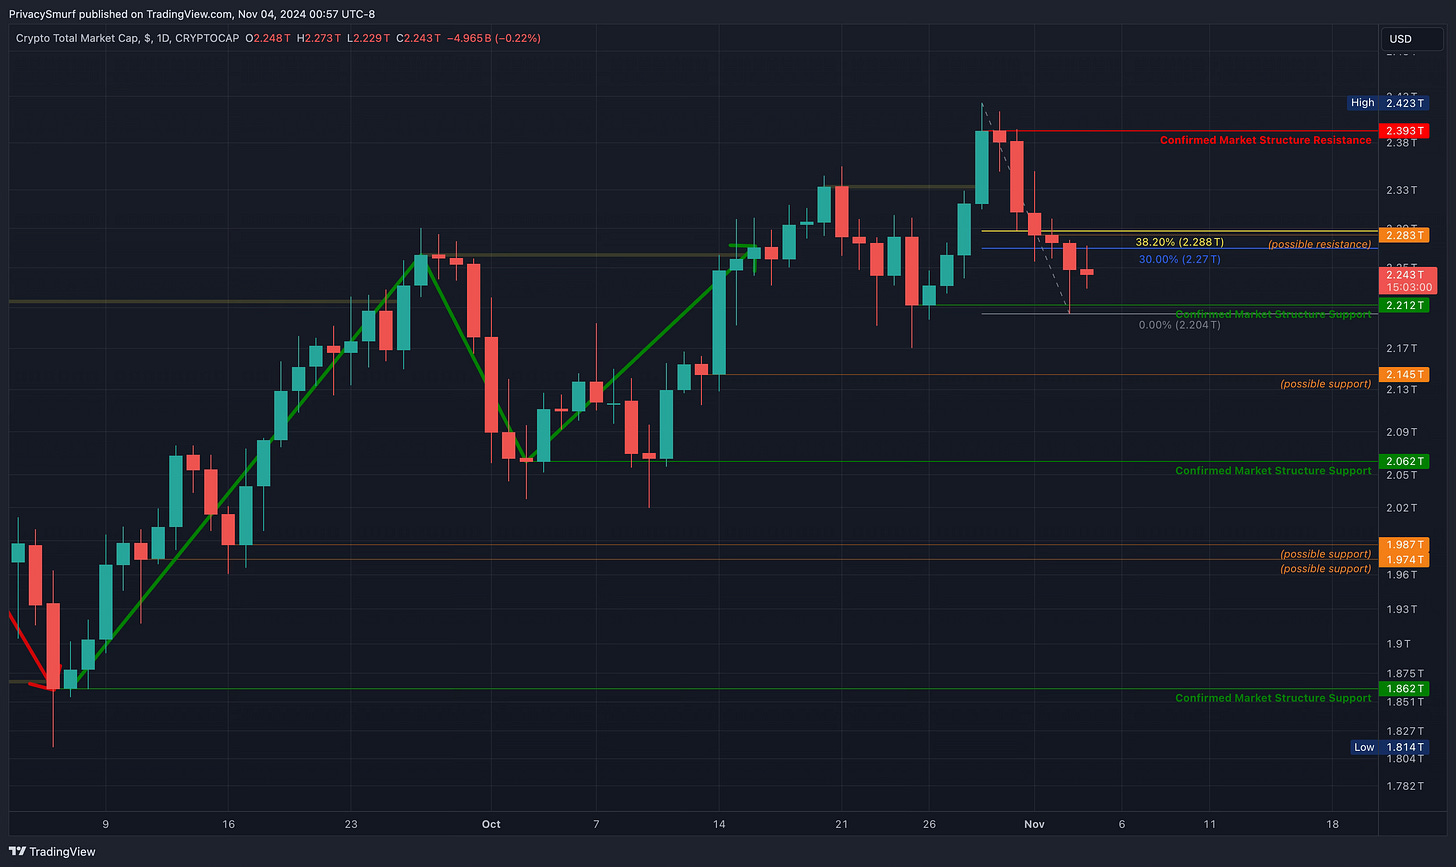
The daily market structural trend remains bullish. As last week progressed, the crypto market cap broke the prior structural resistance, followed by enough retracement to confirm structural resistance at 2.393T. There is structural support at 2.212T. Closing below will not shift the trend but may mean a consolidation period under the new resistance before we continue the move up to break it.
Crypto Money Flow
https://www.tradingview.com/chart/E249oVQY/
No new changes.
Last modification Oct 22, 2024:
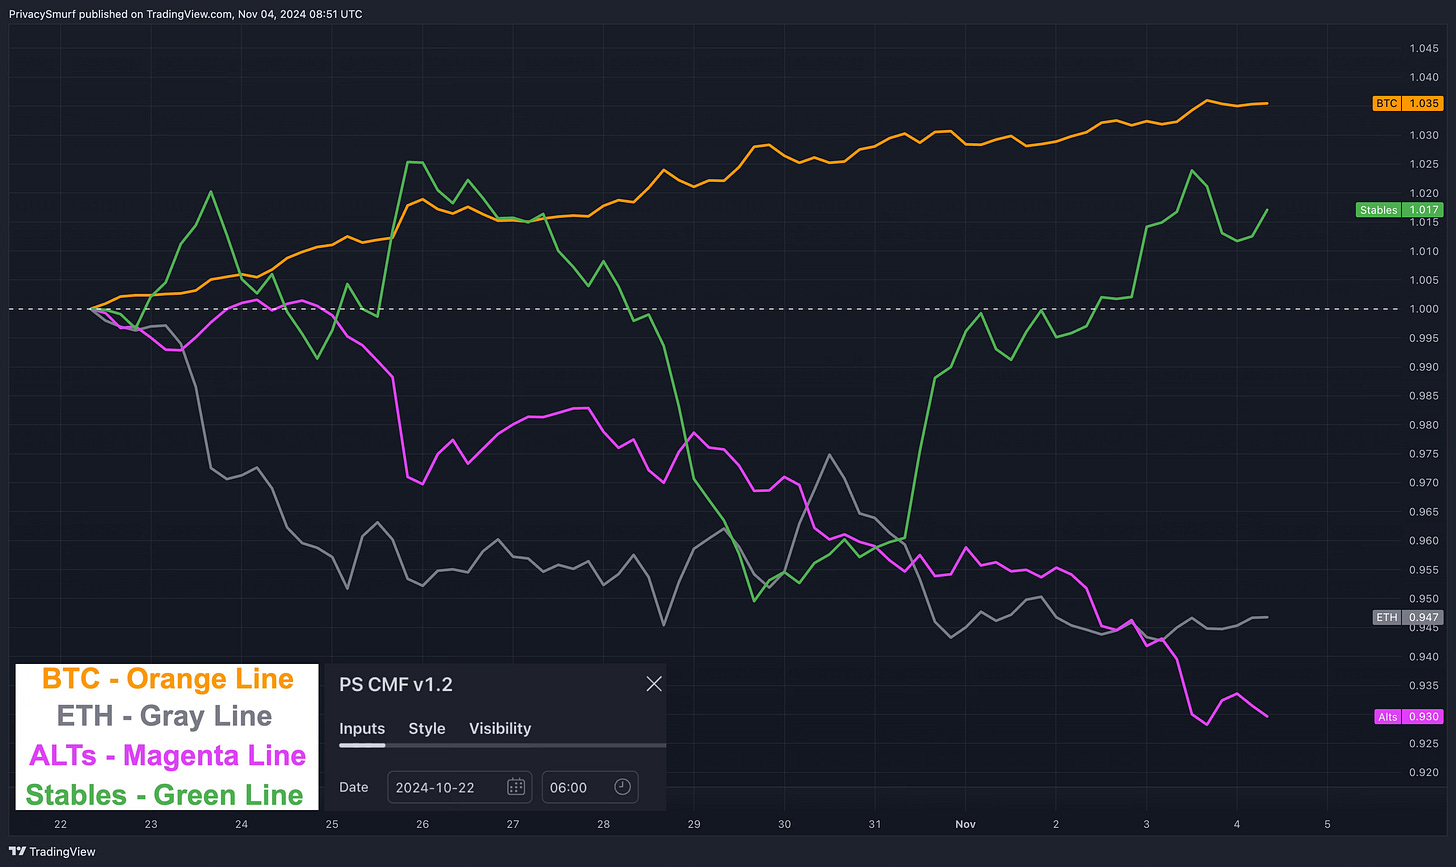
The starting point for the latest rotation on the Crypto Money Flow chart remains unchanged: October 22, 2024, at 06:00 UTC, as seen above.
BTC allocation has steadily been growing over the last two weeks. This may be a protectionary move, and we may see further downside. Still, I suspect we will lean towards one of the other possible outcomes: a rotation into ETH and ALTs while BTC stalls or BTC continues its rally, leaving most other assets in the dust.
To identify the rotation out of BTC that will likely look like one of these two shapes with ETH and/or ALTs breaking beyond both angular AND horizontal resistances with BTC declining as well.
Additional Crypto Metrics
Retail sentiment is bullish but has fallen back into the consolidation range above the midline. There’s a lack of enthusiasm and optimism regarding BTC. Even though we just nearly missed the all-time high, “UP-tober” didn’t deliver, and I imagine folks are becoming apprehensive about the possibility of further bullish returns.
The Market Validity Score is continuing its downward trend. This decline may be in response to the increasing BTC exposure rather than ALTs. It will be worth monitoring whether another movement to the lower extremity occurs. During this cycle, we've witnessed more touches of the lower extremity than in any previous cycle.
As I've mentioned before, it bears repeating—the market is becoming saturated with excessive non-performing assets. With token creation being more accessible than ever, most new projects will fail to gain traction, consequently pulling down the overall average. Looking ahead, I may need to modify these calculations to incorporate custom weighting factors to produce a more meaningful analysis from the Market Validity Score.
What am I doing with the above as context?
SHORT TERM BTC
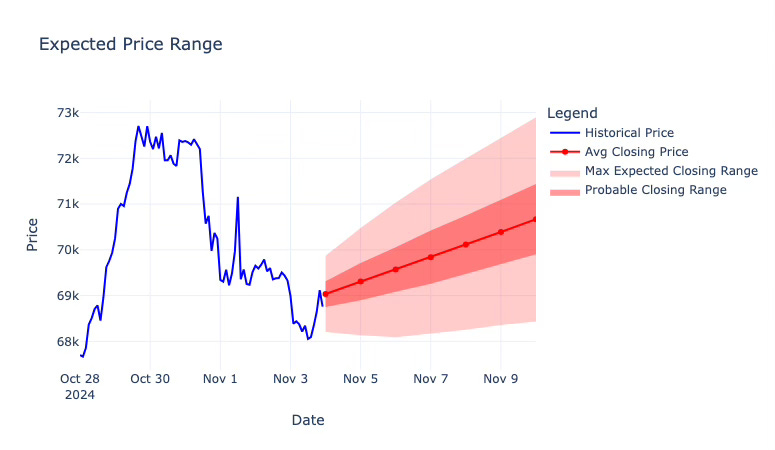
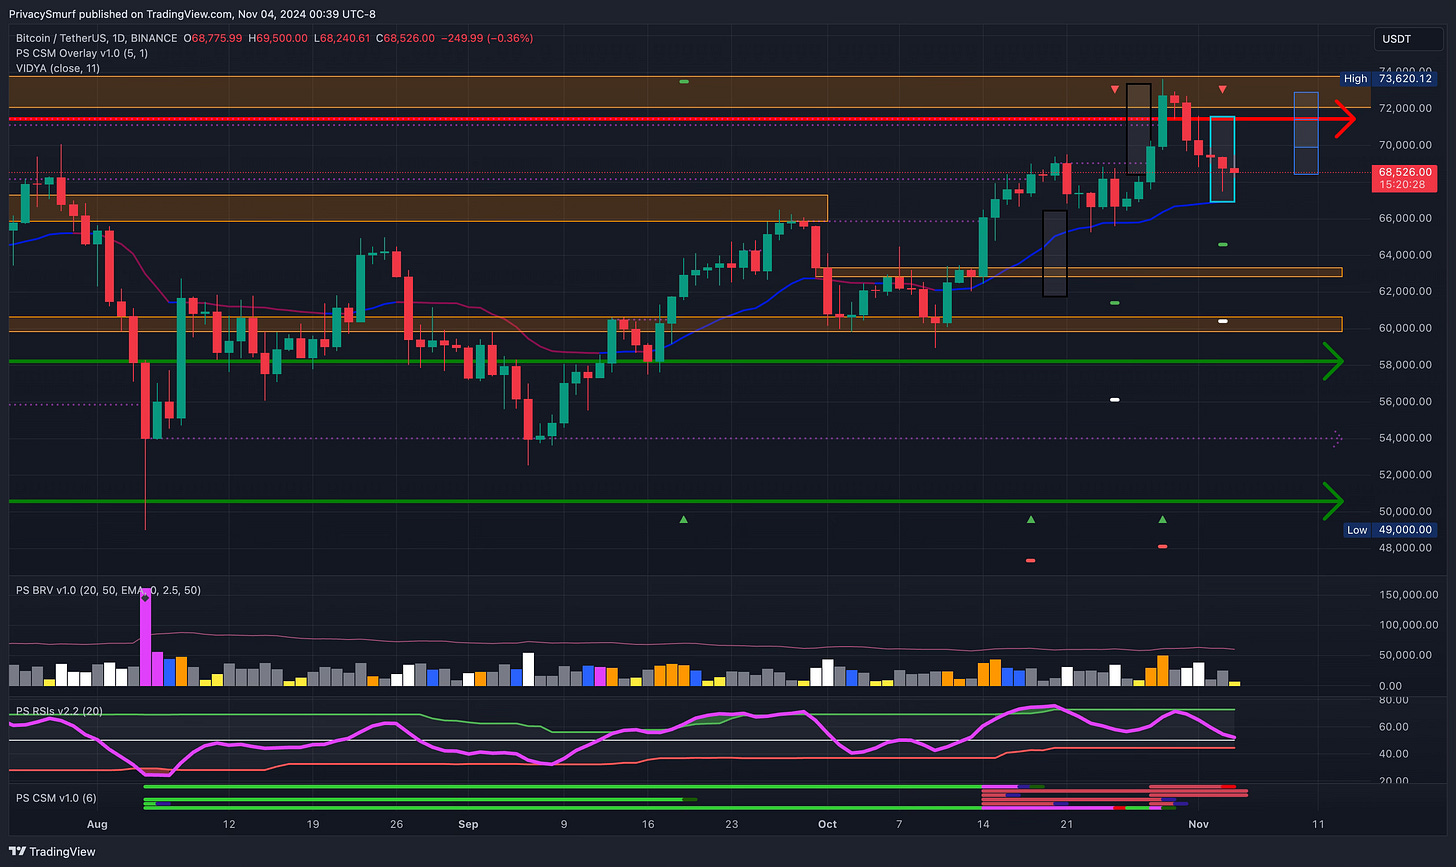
Merging hard science with the art of technical analysis, stats would put BTC's closing prices for the week between $68.5K and $73K.
This BTC closing range feels okay compared to my personal TA, as I believe we are building to another bullish spurt (possibly over the ATH next week). However, it ultimately depends on how the market responds to a test of $67K if that comes this week. If multiple days trade and close below $67K, I anticipate a sharper downside, possibly even in the $61K to $65K range. This is probably where the midline of retail sentiment would be tested.
Still, I would consider buying options on trade signals when/if BTC dips into the $65 to $67K region. Monitoring momentum and identifying whether it is increasing despite declining prices while in this range will be imperative. Otherwise, I’d pass on any buys at this level and wait for lower prices.
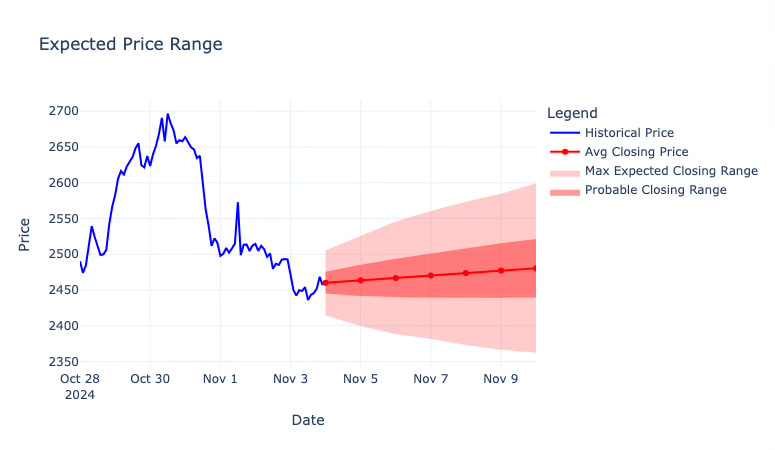
On a side note, last week’s close landed inside the dark red “probable closing range” for BTC and the “max expected range” for ETH, marking it the first accurate week since I started three weeks ago. We’ll see how this goes as time progresses.
SHORT TERM ETH
Statistics would put closing prices between $2360 and $2600 this week for ETH.
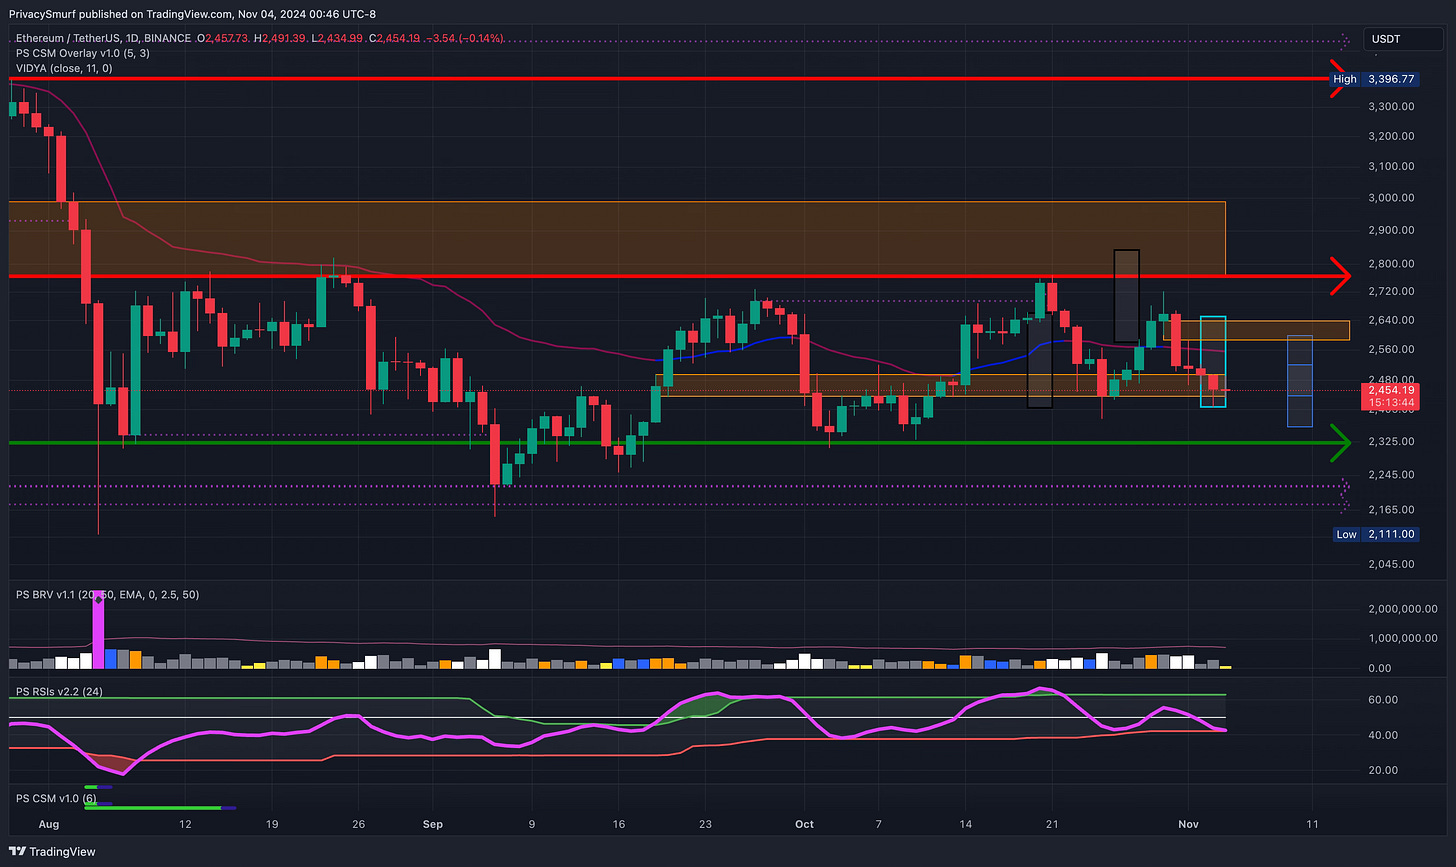
I feel okay with this even if BTC misses its mark as long as it closes above $65K. I imagine there will be some retracement if BTC tests $65K, but ETH is sitting just above a few historical supports (seen in the charts at the bottom), which may provide some price stability. Any/All of those would be potential buying opportunities, provided momentum is increasing despite the price decline.
LONG TERM CRYPTO
My long-term horizons are unchanged, and I anticipate higher prices at the end of the year. Something to note on the crypto market: we are at a turning point in the context of seasonality and algorithmic pattern analysis. A bullish trend can not start without a shake-out of some sort. There must be a changing of hands from short-term holders to longer-term holders when the market declines. This week may be that week. If so, I expect the structural supports on the crypto total marketcap chart to hold, I’d look for bounces and expect 2.136T to be the max drawdown we’d see in a decline.
In the images below, we can observe the seasonal patterns for the S&P 500, the crypto total market cap, and BTC prices (the dot is where we are today as of publication). All are historically bullish this week (green background), but the return lines are flat or negative. This suggests that we may be beginning the last big shakeout of the year before our final bullish push.


Also, here are two up-to-date images from charts in my quarterly report, which you can read linked below


The first image depicts the accurately timed peak for BTC prices with the initial decline, and the second image shows the same accurately timed peak and decline in patterns on-chain. If patterns hold in on-chain data, there will be a shift towards profitable BTC transactions shortly, which may mean slowing the declining pattern in BTC prices a little early or a quick, deep decline that is bought up heavily. You can read up on that quarterly post in a link provided a little further down.
In this post (CC#109), the week before releasing my quarterly post, I shared my expectations on the prices for this bull run based on purely technical trade signals. This past week, the initial targets were hit.
It’s common to see a pullback after achieving the first profit target in this methodology. The secondary (and final) bullish target remains near $84K for our end-of-year push.
That’s all for this week’s analysis.
Welcome to the beginning of the end!
You are a true fan of Technical Analysis. Here are some extras to dig into.
Did any of the above sections not make any sense? Try catching up with these explainer posts.
Click the links below if you need a refresher on the checkpoint elements.
Got any questions? Pop into the discord and chat.
*https://discord.gg/MuMP5VUeM9*
Did you miss my quarterly report? Check that out here.
Read a post about what everyone is getting wrong about the Bitcoin Halving and BTC price action.
Below are the charts I use for my BTC, ETH, and ALT trading. I think I’ll start making short videos about each of them occasionally.
See you in next week’s market update!
@theprivacysmurf


