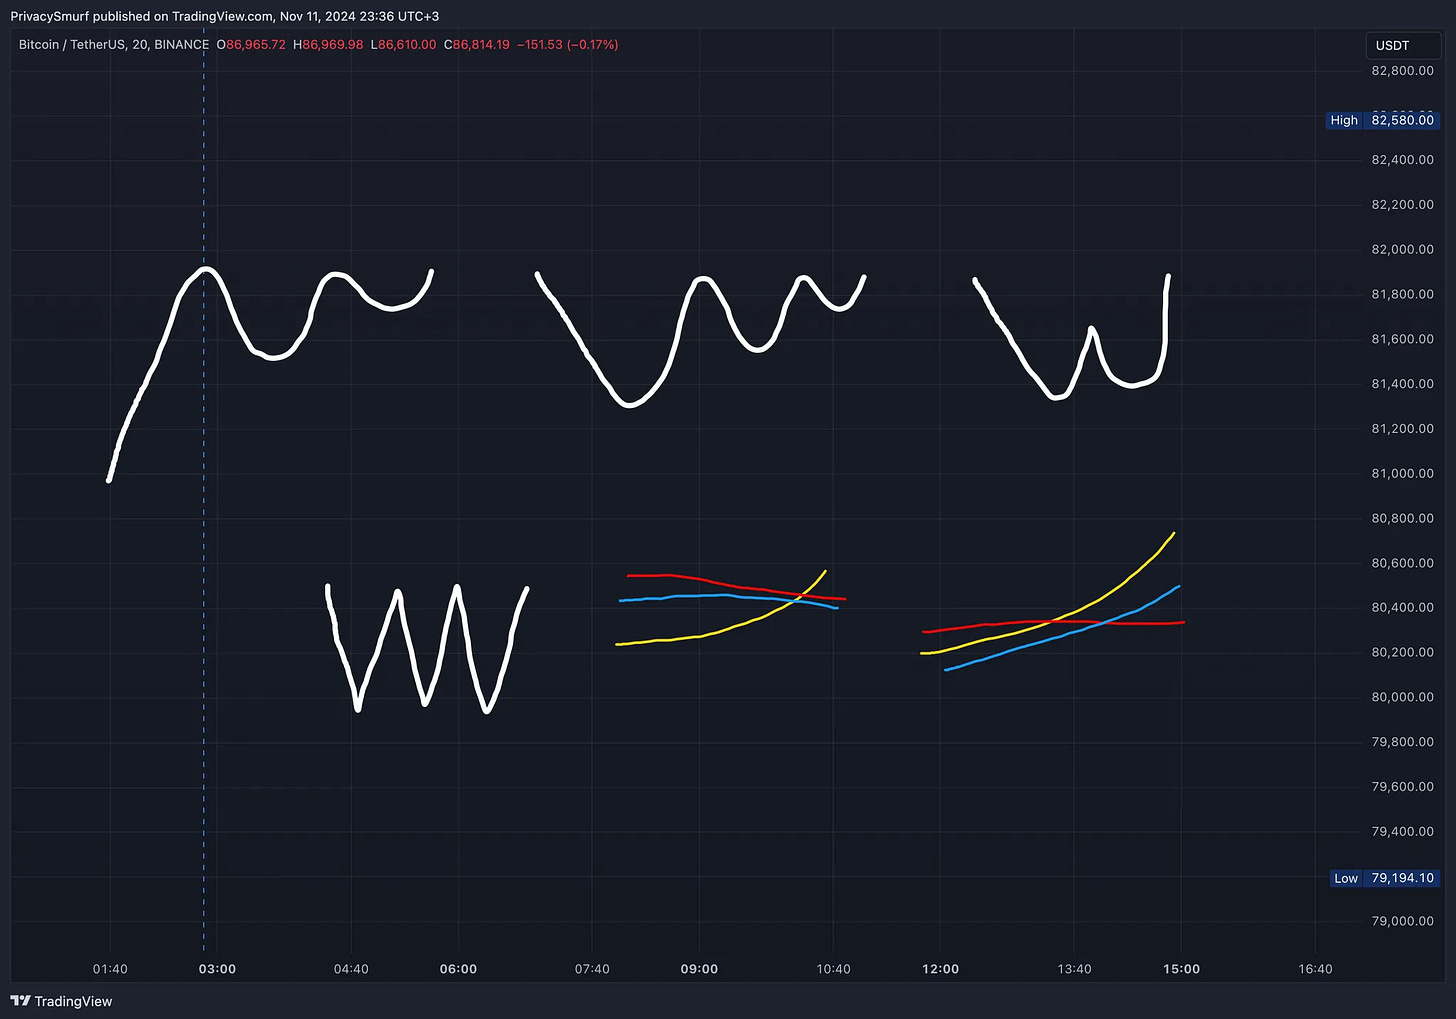
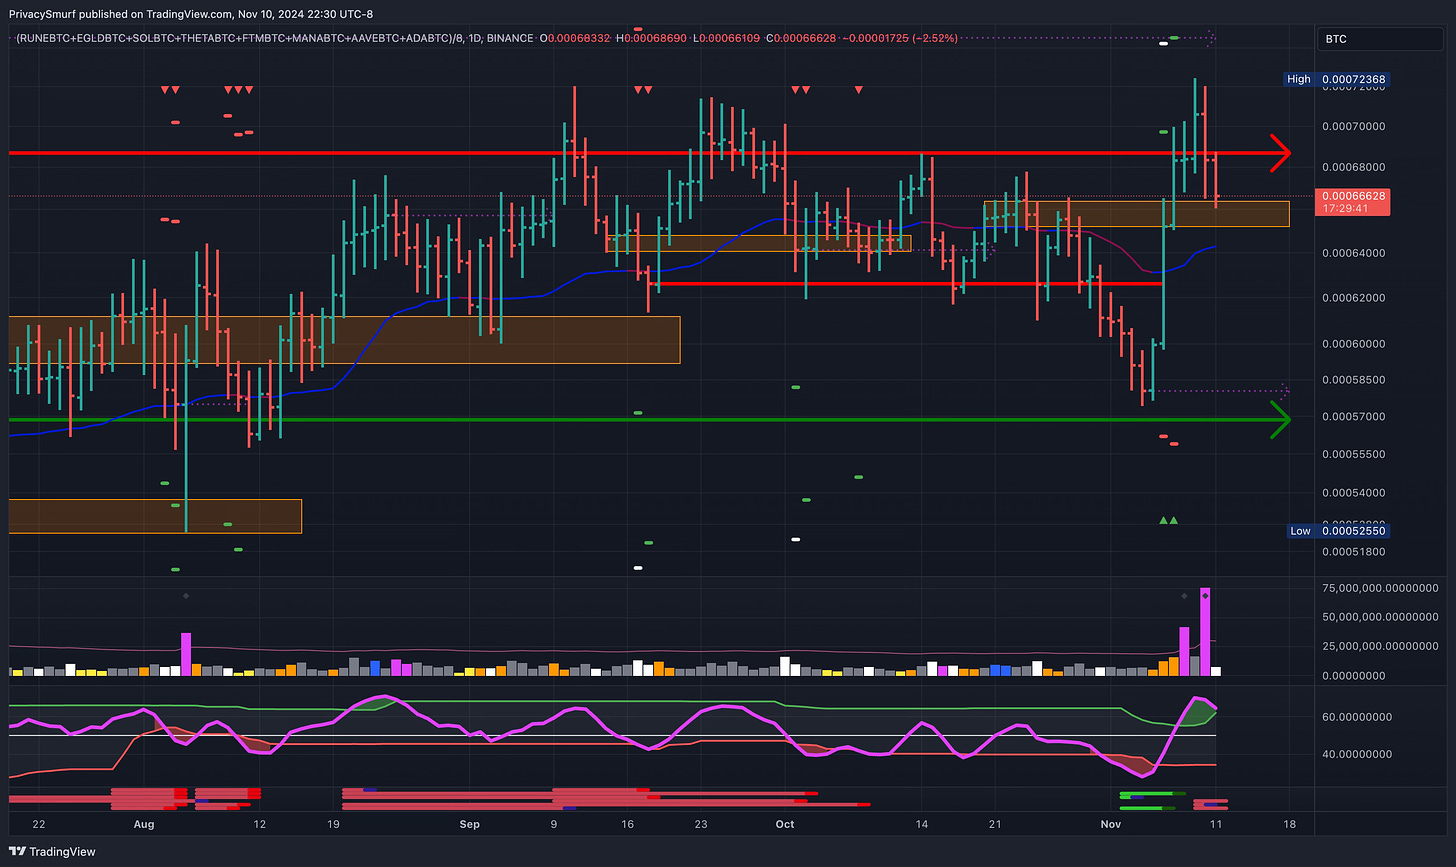
As a teaser for what I mentioned last week about some new releases soon. Here’s a no-context screenshot of what one new project I’ve built will focus on.
Also, I’ll expand the analysis and Discord daily downloads/analysis to feature stock symbols because I’ll probably increase my exposure in that arena. I expect it to become more relevant for money-making if crypto tops out soon. This work is coming at a considerable cost of time and money for me, so I can’t guarantee it will all be free. However, any of my crash test dummies utilizing the lists can attest to their potential. And if you haven’t already been using the crypto lists in the discord, shame on you. Join here. https://discord.gg/vtSUR2JQ7M
ANALYSIS TL:DR
The market is bullish—duh. It’s not too bullish yet, but it’s getting close to that point. After hitting my strategies' targets like BTC did at $84K, a short-term pullback would fit anecdotal trends. However, I’m hesitant to buy that dip. Instead, I’m focusing on ALT exposure.
Where are we now?
The larger-scale bull market is in full swing, with most assets bullish on daily and weekly timeframes. Bitcoin exposure is increasing after a short rotation into ETH and ALTs. Retail sentiment is significantly boosted, with Bitcoin breaking into new all-time highs.
What happened to get us here?
Expectations from last week's analysis were on point, with an anticipated retracement towards $67K. Still, they were wildly off the mark, as that bounce launched the market beyond all upside targets.
Let’s examine the key metrics I used to reach and create the TL:DR.
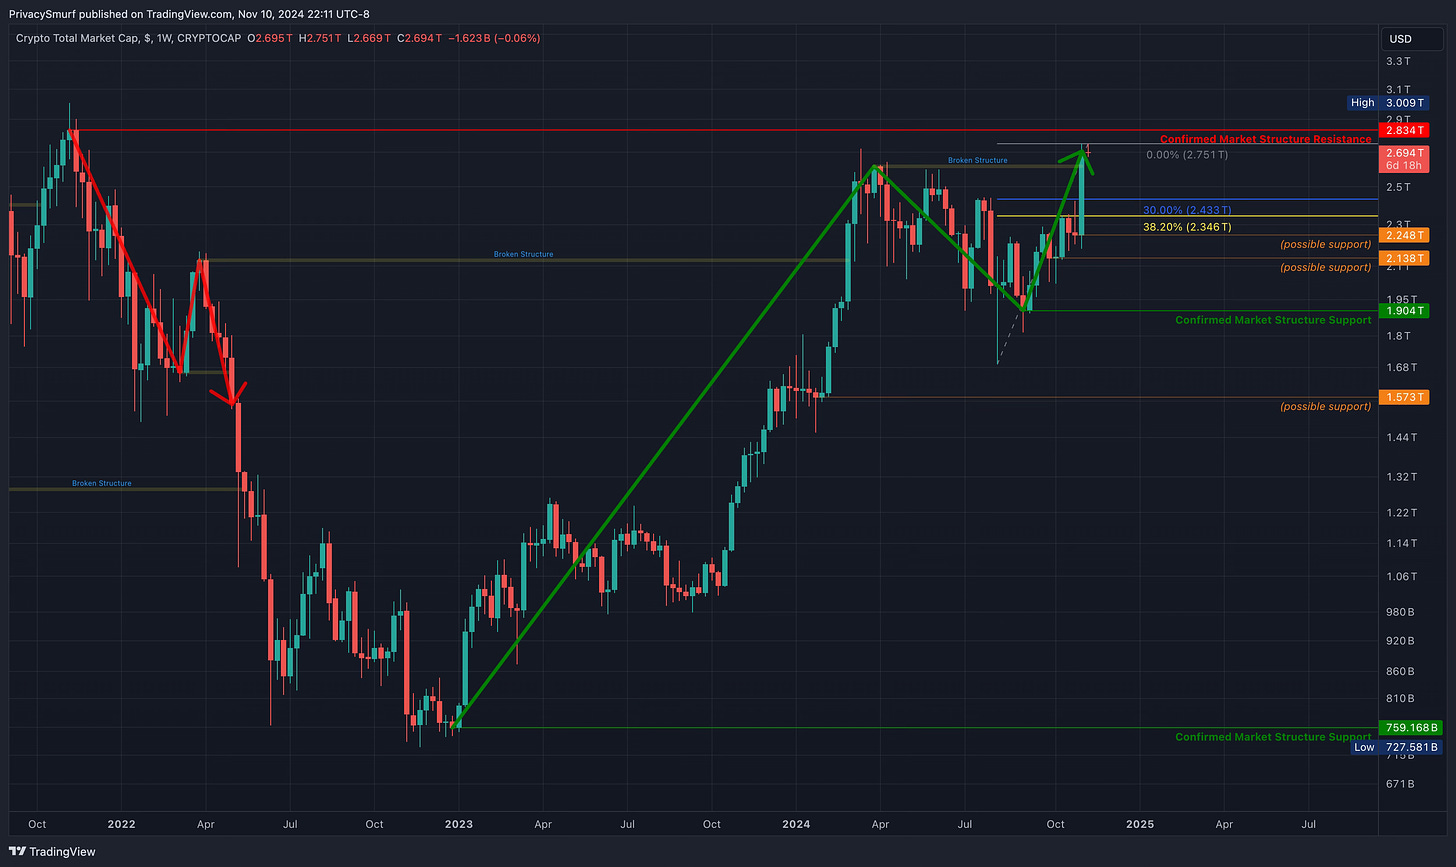
Total Market Weekly Structure
https://www.tradingview.com/chart/FEeyCH3q/
New changes!!
Last modification Nov 10, 2024:
With the latest weekly close above 2.617T, the weekly chart confirms a bullish trend, with the pivot points highlighted in the green zigzag arrow line. However, structural resistance still exists at 2.834 T, which is the final resistance before the crypto market cap enters uncharted territory.
While the crypto market is relatively young (relative to the stock market or other assets), this is the first time in the weekly timeframe that it has shifted to a bullish trend without already breaking above the prior bull trend all-time high. I don’t really know what this means or if it means anything in the big picture. I anticipate selling to come in at that level, which may limit growth.
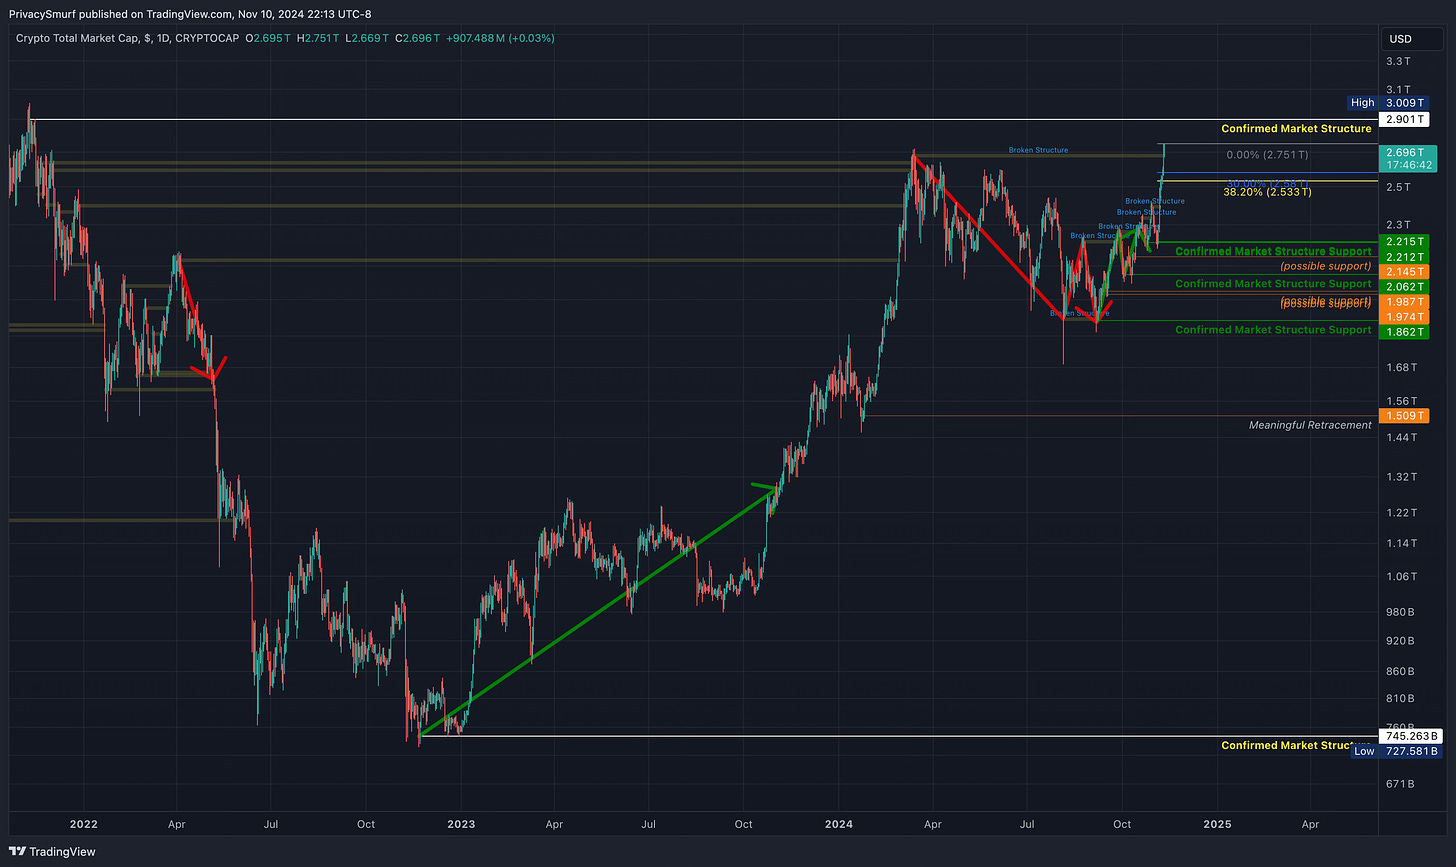
Total Market Daily Structure
https://www.tradingview.com/chart/25yQcZV1/
New changes!!
Last modification Nov 10, 2024:
The daily market structural trend remains bullish. The crypto market cap broke the prior structural resistance at 2.68T as last week progressed. Similar to the weekly timeframe, there is only one remaining structure resistance. On the daily that resistance level is 2.901T. I anticipate selling to come in at that level, which may limit growth.
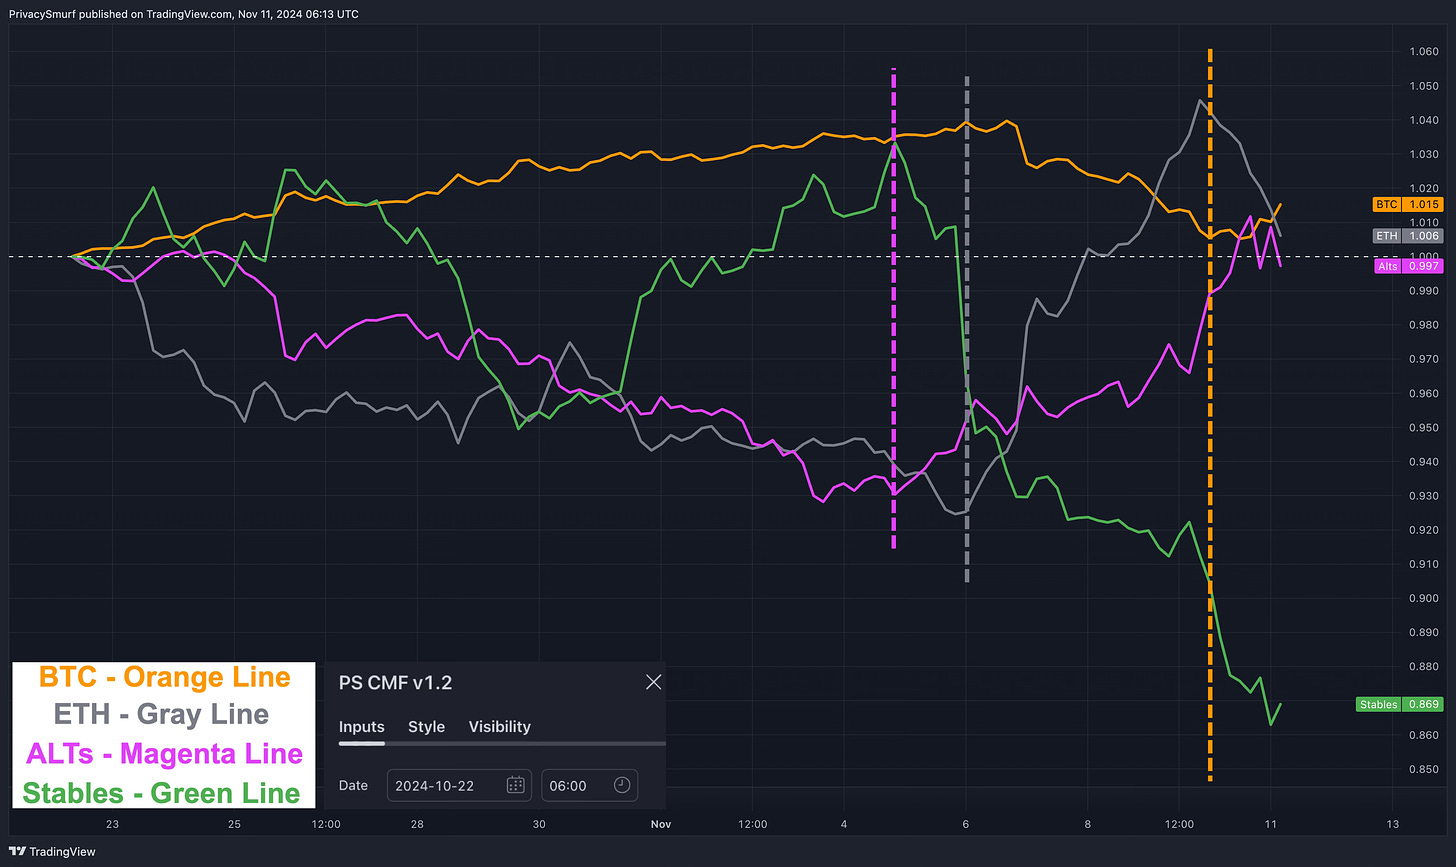
Crypto Money Flow
https://www.tradingview.com/chart/E249oVQY/
No new changes.
Last modification Oct 22, 2024:
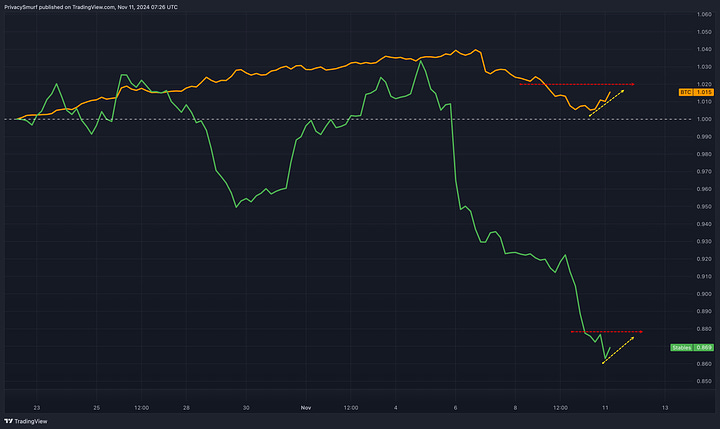
The starting point for the latest rotation on the Crypto Money Flow chart remains unchanged: October 22, 2024, at 06:00 UTC, as seen above.
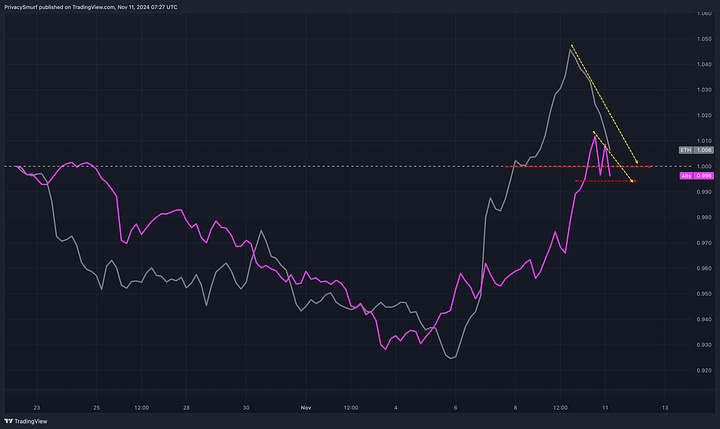
The rotation out of BTC for a short-term ETH and ALT rotation played out precisely as charted in lasts new’s newsletter. The start of those rotations is marked with the fuchsia and grey dashed lines.
The orange dashed line marks a potential new rotation. It’s a little early to make that call, though. This could be a continued BTC pump or a selloff. Either way, watch for BTC to continue to break out and ETH and ALTS to break down, as shown below. If Stables are going down, that may indicate a BTC pump instead of a protective stance (aka a market-wide selling event).
Additional Crypto Metrics
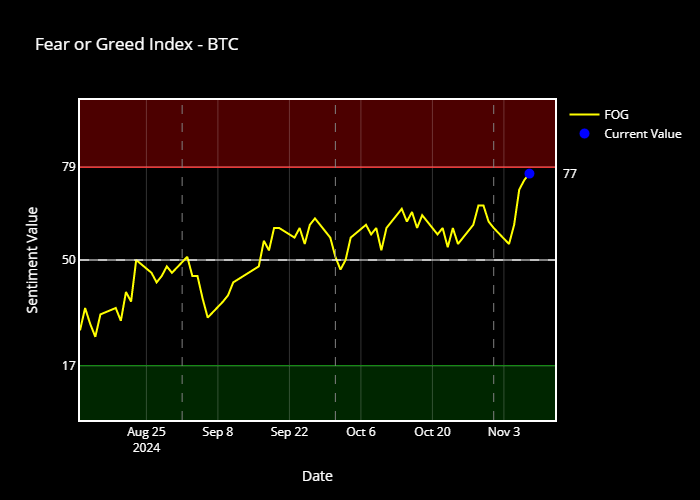
Retail sentiment has rocketed up in the last few days, mirroring price action. This brings us close to the greed zone. A few more days of bullish behavior, and I expect us to breach that high level. This, in turn, gives me a reason to suspect a more significant selling event is coming soon.
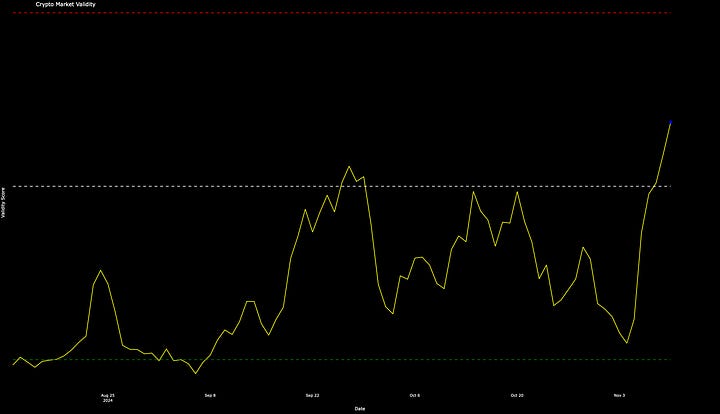
The Market Validity Score responded the same as sentiment, with a massive increase. Most assets in the market now exhibit a bullish price structure. Suppose we continue with another BTC push and alt rotation. In that case, I imagine we will be at the high extremes, which, like sentiment, will give me reason to suspect a more significant selling event is coming soon after.
It’s really amazing how quickly things can change in this market.
What am I doing with the above as context?
SHORT TERM BTC
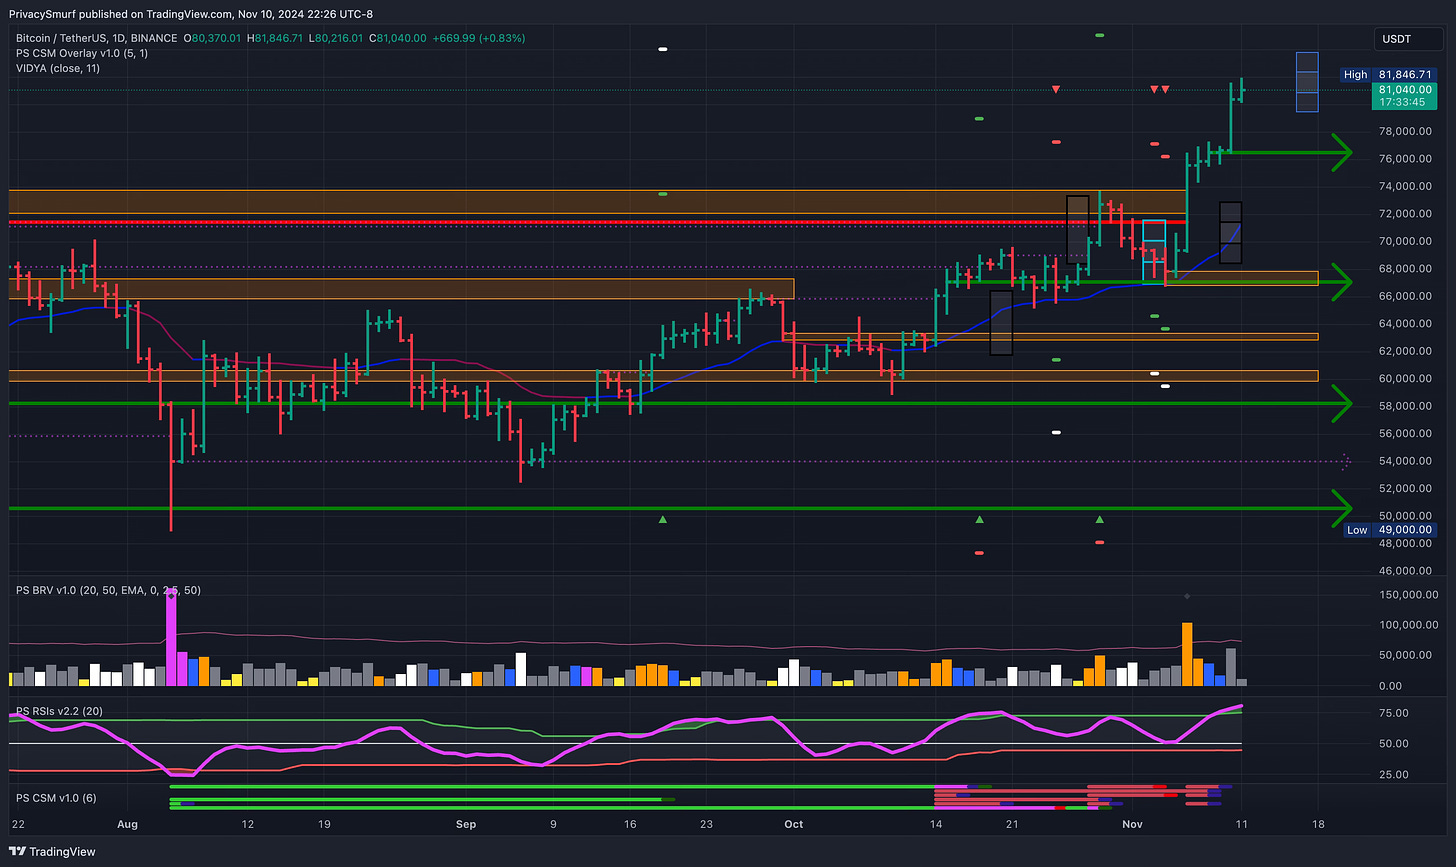
This is a great place to be at the moment. BTC is in price discovery as it’s reaching levels never seen before. My daily chart bullish trade from CC#109 has now hit its second profit target ($84027 for ~32% gain), so all my highest expectations based on technical trade signals have been met. Now, I let the market go as high as it wants and utilize trailing stops using daily chart closing prices. We are experiencing rapid and exuberant price fluctuations, and there’s not really any point in making some guess because that is trying to pin rationality on an irrational moment in time. That being said, I can still try to use statistics.
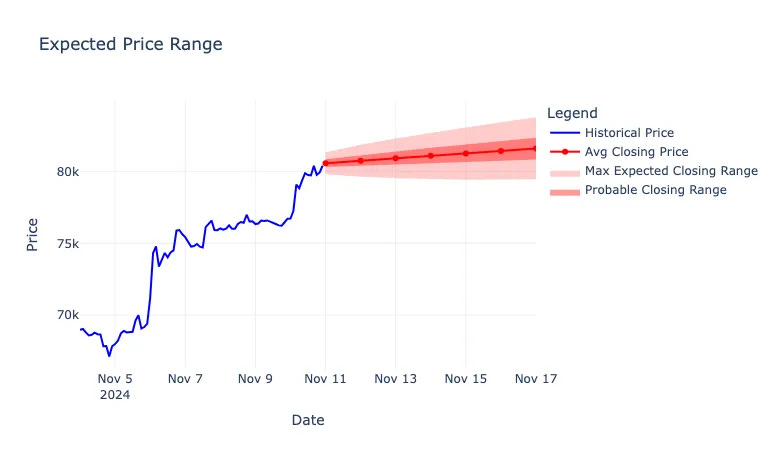
Merging hard science with the art of technical analysis, stats would put BTC's closing prices for the week between $79.5K and $83.8K.
I’m unsure how plausible that is because things can dramatically change 20 minutes after posting this newsletter. We’ll see where things end up at the week’s end.
Buying any dip right now is out of the picture for me. If we keep going up, we start creating multiple conditions that typically pop up around market tops, and I’d rather not buy the top. I’m just a passenger of this move now—no more driving.
On a side note, last week’s close landed outside the ranges for BTC and ETH, but I’ll take being wrong to the plus side any day. :-p
SHORT TERM ETH
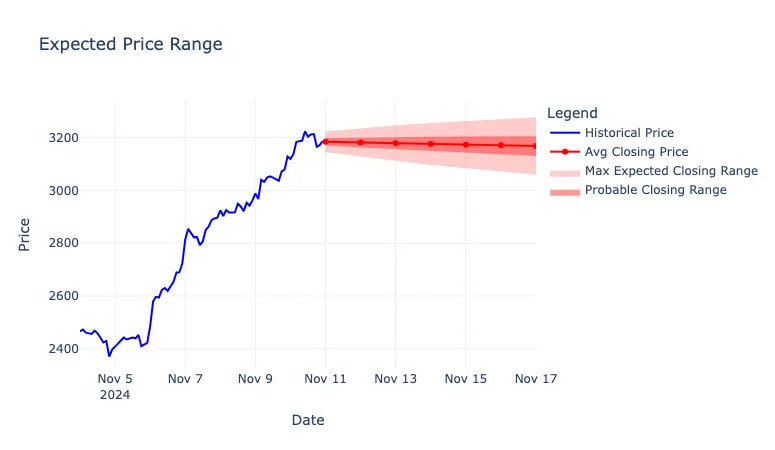
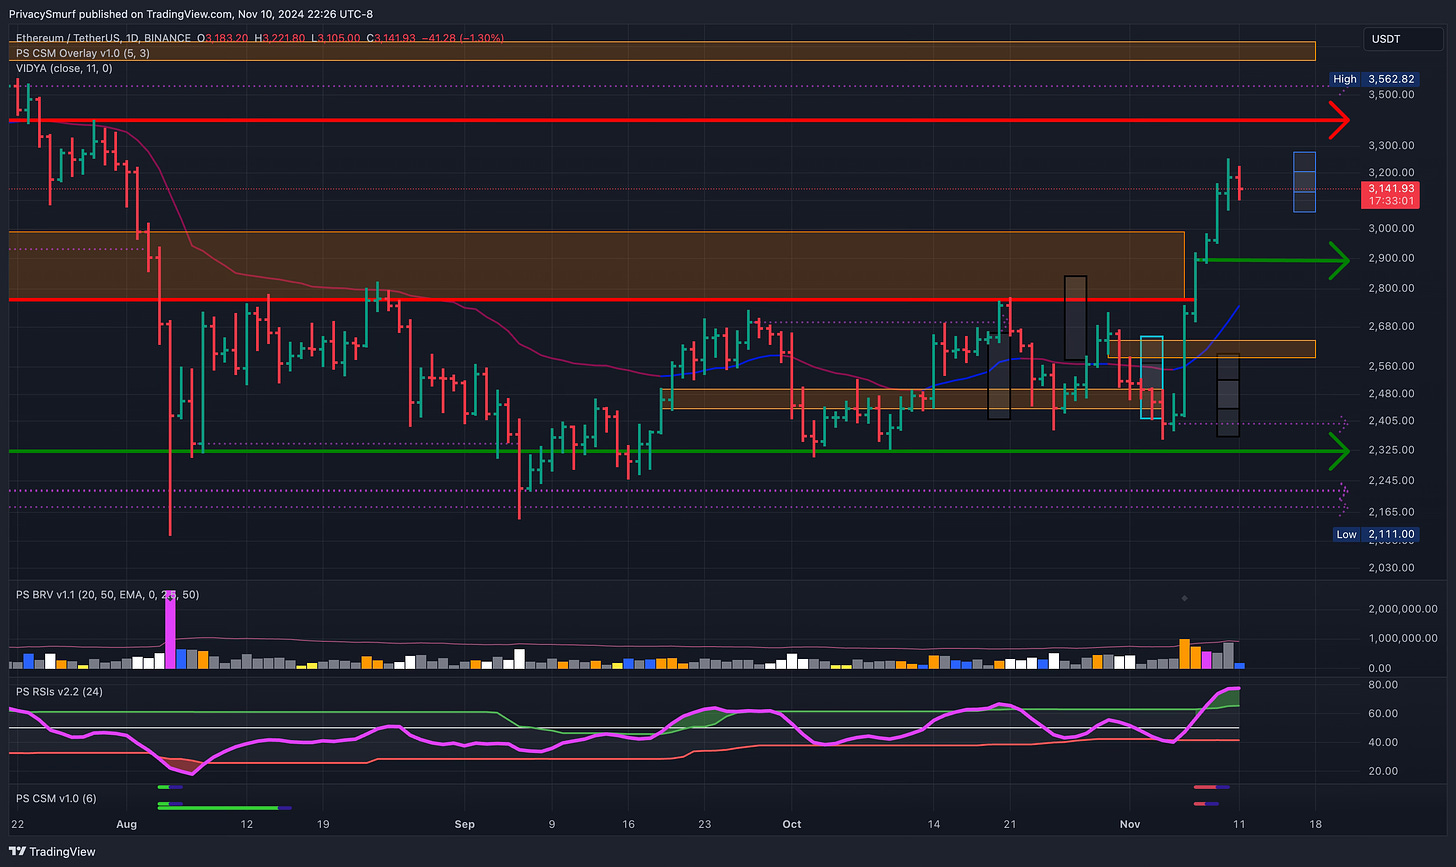
Statistics would put closing prices between $3060 and $3280 this week for ETH.
This is kind of the same situation as BTC, irrational times and all, but there are still some levels ETH has to work its way through (such an under-performer). Since it’s currently under resistance from $3400 to $3500, I think it’s plausible that ETH can land inside the expected ranges if the market takes a breather from its recent run.
IF the market doesn’t break down, I will prioritize finding the strong and/or delayed ALT breakout trades. They typically extend bullish price action longer than BTC does at the top.
(MY) LONG TERM CRYPTO
My long-term horizons are unchanged (in the context of the 2023-2024 bull market), but things are a bit murkier because I can’t say I expect higher anymore. We are already at higher. Given that we’ve hit TP2 from the daily trade signal, a pullback wouldn’t be out of the norm. When that comes (it’s no longer an if for me), I don’t think I’ll be buying that dip because none of the market cycle indications I rely on have changed, and I still anticipate this bull market to be ending Q4 2024 to Q1 2025, BTC likely earlier than ALTs. I’ll make a post dedicated to this in the next couple of days because it requires more info than just a few short wrap-up sentences.
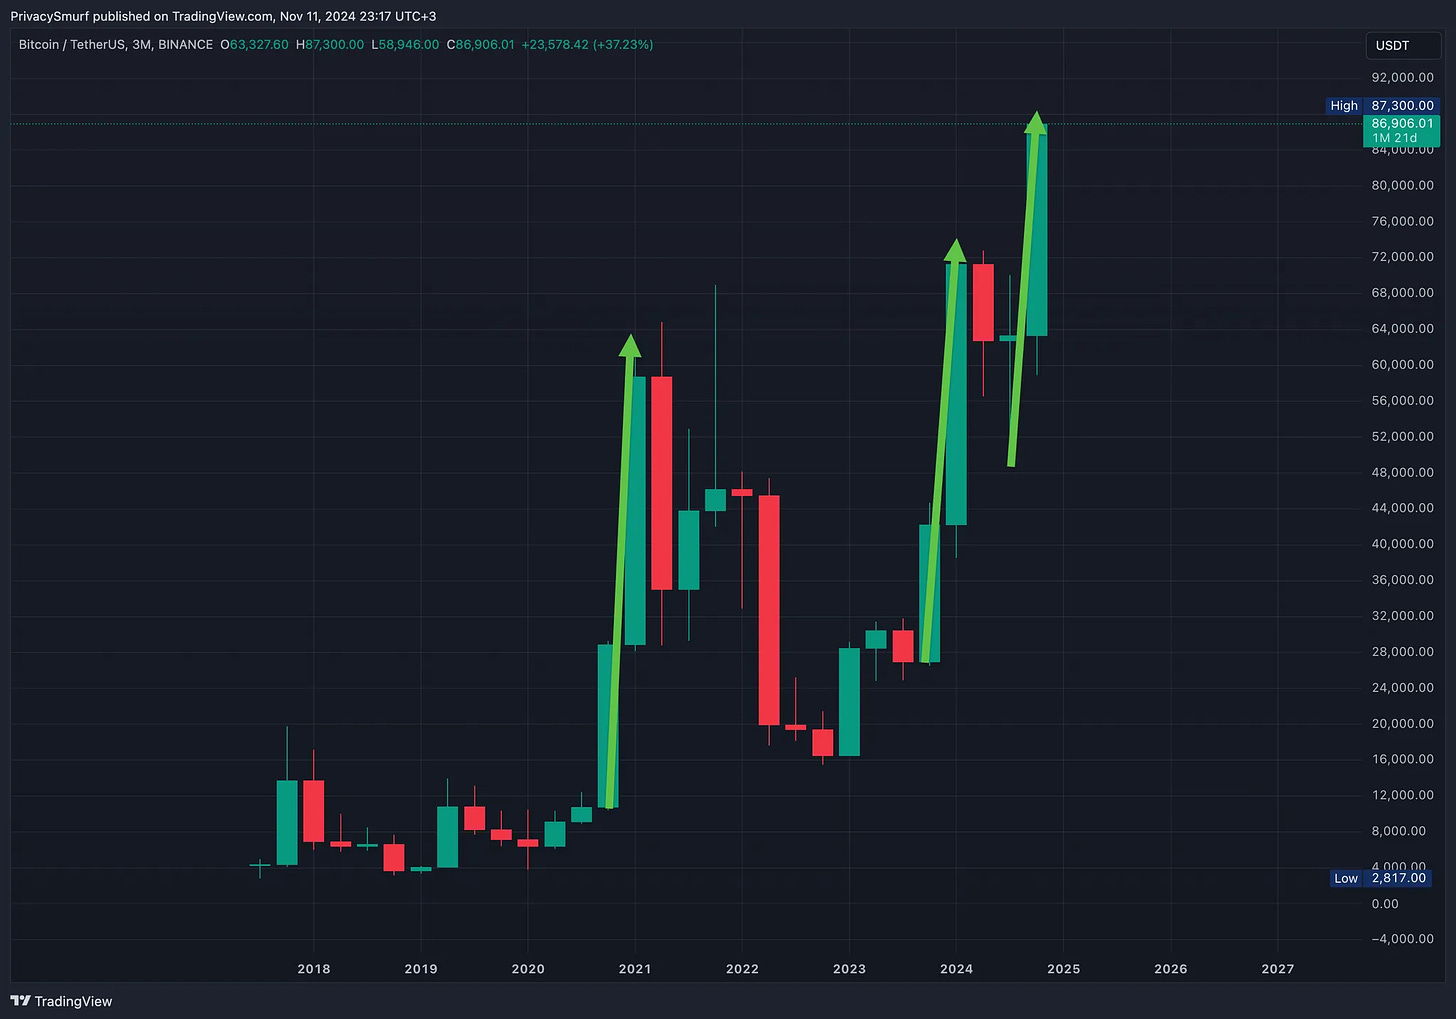
Something I think is essential to stress before that post is something I am seeing more often lately in the crypto analyst space. Many headlines and comments say, “We are just getting started” with the bull run. This sounds so out of touch to me. Yes, we had a super shit middle of the year for crypto, but I think people are ignoring the fact that we have essentially gone up since Dec 2022. The entire $ move from the last price low to high (Dec 2018-Nov 2021) was ~65.8K. We’ve already surpassed that and are around a $71K move from low to high at the time of writing. Price has over 5.6x’d for BTC. That’s not nothing. I think people are overlooking that BTC is a huge freaking asset now. Fundamentals and narratives aside, It’s got a higher market cap than Meta (Facebook), which has seen roughly the same % gain as BTC in approximately the same time (450-500%), and people aren’t clamoring about its gains being lackluster.
Ultimately, I don’t understand how people can look at this chart and think, “That’s not parabolic,” or “That’s not parabolic enough,” and “We are just getting started.” We’ve been going for some time already…
On a side note, don’t @ me with all the talk about some professional's lofty price valuations, institutional involvement, companies adding to balance sheets, and Trump's pro-crypto / friendlier regulatory environment. That is either shit people have been saying forever or is big BIG picture stuff. Macro events like that take tiiiiiiiiiiiime to play out. It’s not shit that flashes in overnight just because we have Republicans in charge come February. Chill out with all that.
That’s all for this week’s analysis.
Welcome to the beginning of the end!
You are a true fan of Technical Analysis. Here are some extras to dig into.
Did any of the above sections not make any sense? Try catching up with these explainer posts.
Click the links below if you need a refresher on the checkpoint elements.
Did you miss the Q4 analysis? Check that out here!
https://zenalytics.notion.site/2024-Q4-57593e02f4154db093272183fc9918d1?pvs=74
Read a post about what everyone is getting wrong about the Bitcoin Halving and BTC price action.
Below are the charts I use for my BTC, ETH, and ALT trading. I think I’ll start making short videos about each of them occasionally.
See you in next week’s market update!
@theprivacysmurf


I'm excited for the future cycle analysis being integrated in the watchlists.