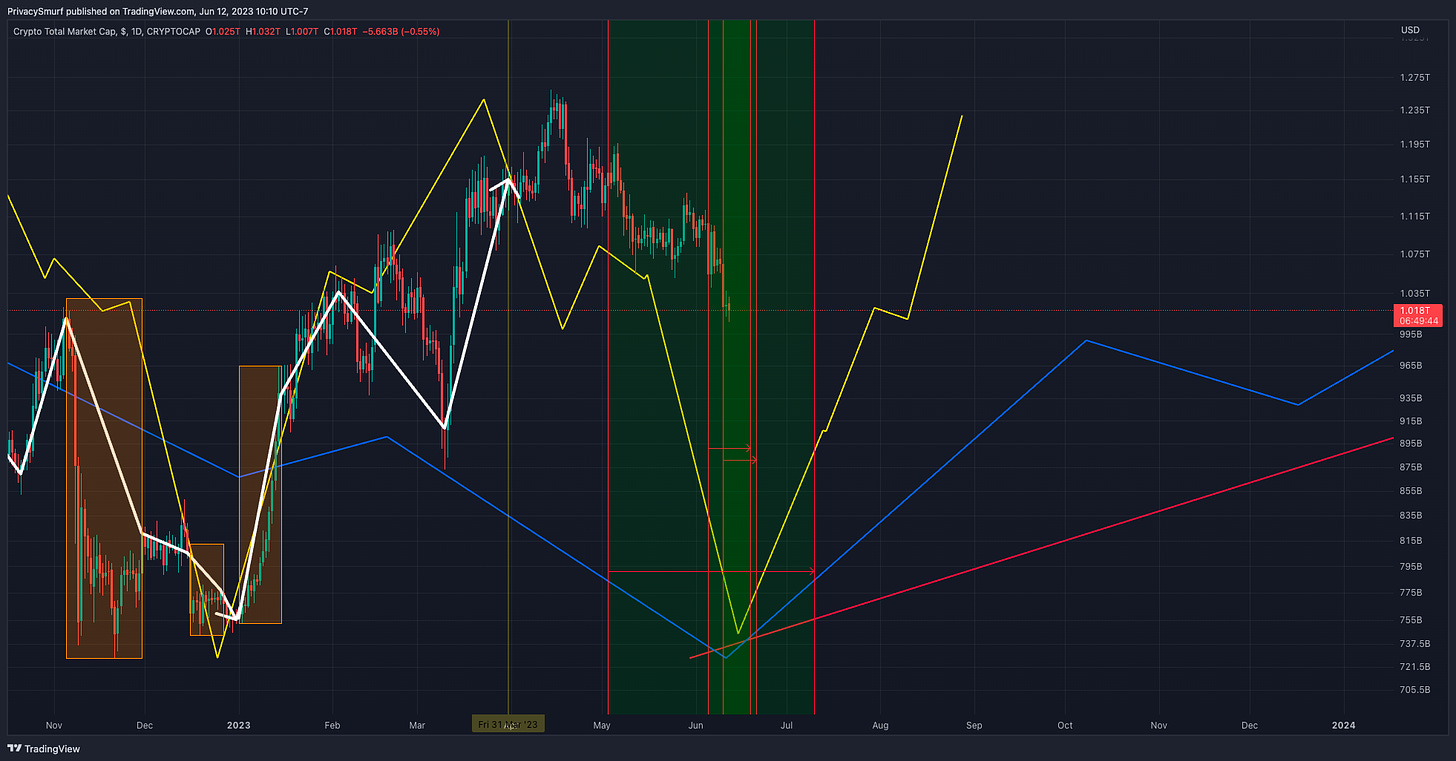
We are entering the bottoming window now. Hints of the reversal are less subtle but on very thin ice. I'll get into that below. Here are the links for the Q2 forecast and segments of the live stream review of the forecast. Give them a look.
Q2 Forecast
Livestream Replay
I'll have the video replay of the State of the Market live stream out in the next day or two. Long story short we are entering the timing window which is the confluence of bottoming in daily weekly and monthly cycles.
Looking for technical reversal signals on the daily chart and precision entries using reversal signals on 2hr - 8hr timeframes are what I'm doing right now. Since we are in bearish trends, entry signals are all risky propositions. Stop losses are kept tight at daily closes under the recent daily chart lowest lows.
I know it's pretty freaky thinking about buying when stuff looks so bad on a chart but with the right objective analysis, you should be pretty comfy-cozy getting in bed with all these sexy low-priced coins.
I'm making a few changes to these market updates. The market update will now be a brief post with the chart, chart link, and short commentary on the past week and speculative expectations for the upcoming week. Next, I'll be splitting off the commentary on how to deal with my exposure or lack thereof in a post the following day called Position Playbook.
BTC/USDT Daily Chart
https://www.tradingview.com/chart/jjSdFW4b/
From last post:
"... bullish reversal setups on my custom indicator... confirmations will probably come in sooner than later..."
Since last week, the bullish reversal setups on my custom indicator, the Correction Strength Meter (white arrow) led to a bullish trade trigger with targets near $28K and $29.6K at the close of trading on Friday. The CSM signals have no specific timing associated with how long it takes for targets to be hit. The RSI (yellow arrow) is the oscillator to watch now since the price action trend is still down, albeit the close on Saturday was higher low than Monday. Consolidation from 25K to 27K may be on the horizon until the RSI begins breaking above the midline and top adaptive band to signal the shift of momentum leading to the upside and potentially indicating the next daily chart bullish trend. A break of the bottom adaptive band, and we may see wicks down to the low support line at $24.5K.
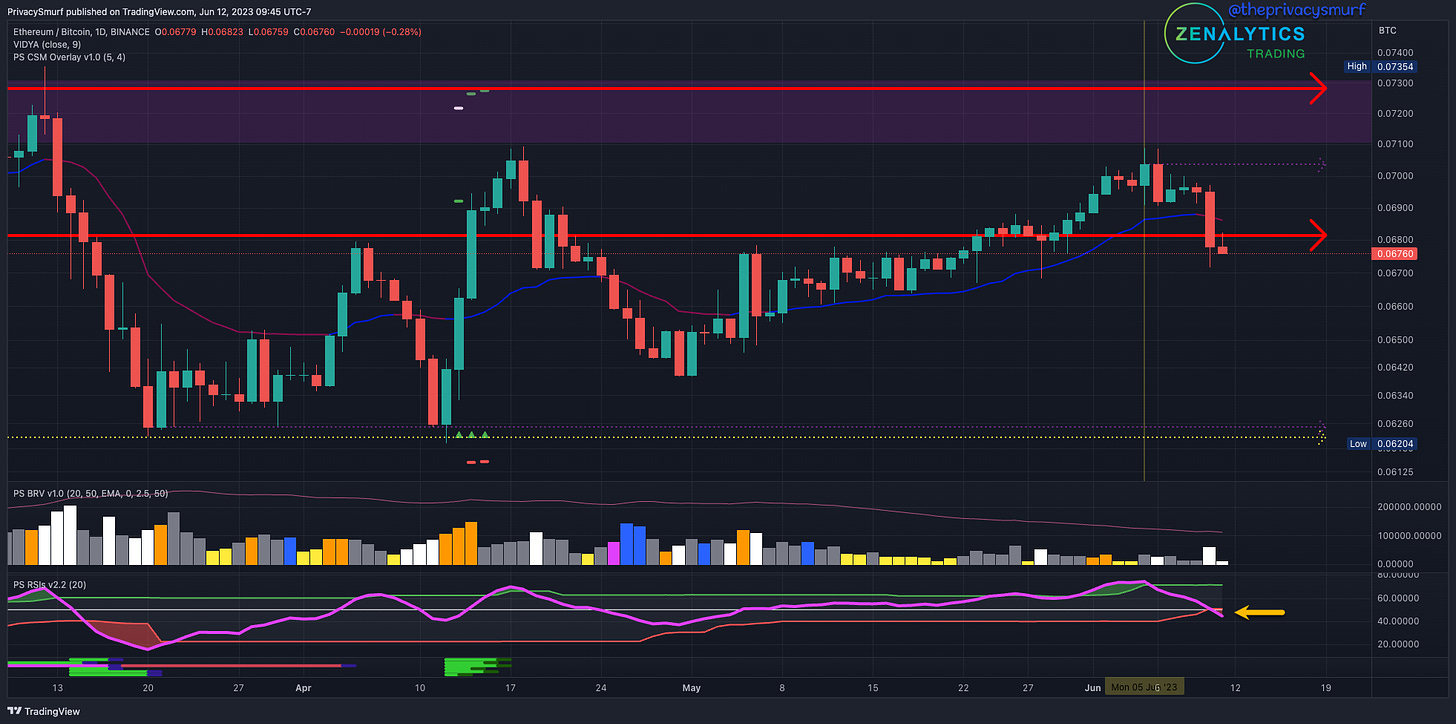
ETH/BTC Daily Chart
https://www.tradingview.com/chart/gTkSjkj6/
From last post:
"... RSI is turning back down... returning between the top and bottom band would suggest a near-term ceiling..."
Since last week, the RSI (yellow arrow) measured a close back under the top band on Tuesday, placing a local ceiling at 0.07036. Since then the RSI continued the descent crossing below the midline and bottom adaptive band which suggests further impulsivity to the downside. The support/resistance line at 0.0681 established in September 2022 has had little sway the last 2 out of 3 times it has been encountered by price and likely will need to be removed or adjusted. An argument could be made for a support region around 0.065 to 0.0665 as price action has rebounded from that area recently. Waiting for the RSI to return inside the bands will dictate when the expansive downside action will slow. Ultimately there is a local floor at around 0.0625 that I would expect closes to hold above.
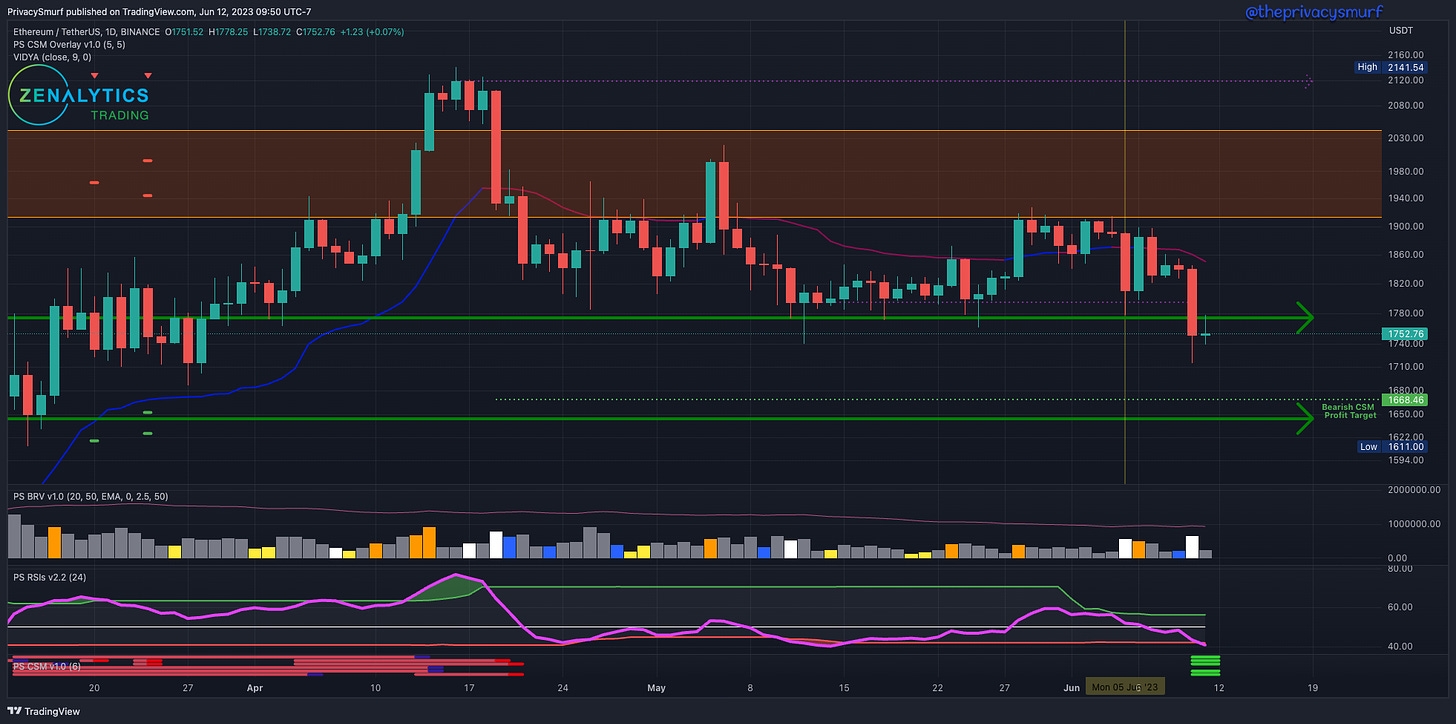
ETH/USDT Daily Chart
https://www.tradingview.com/chart/xbB6lkZu/
From last post:
"... downside breach of the bottom band would likely see tests below the 1780 support again... a bullish break would have more likelihood in my speculation..." (ooft, missed on that last part)
Since the last post, the RSI (yellow arrow) stalled out as it approached the top band and turned down breaking below the midline, suggesting a greater bearish influence on prices; prices will go down easier/quicker than they will go up. The RSI-dictated floor at $1794 and historical support at $1774 were broken down on Saturday, but this action threw the CSM indicator into bullish reversal setups. With the ETH/BTC chart suggesting possible downside continuation and the RSI on the ETH/USDT chart showing a possible downside break, this would suggest ETH will not hold up as well relative to BTC on any bearish slide over the coming days. Initial targets from the bearish CSM trade trigger on April 19 appear more likely now down at $1668. It will be critical to note any invalidations of bullish divergences on the CSM this week and bearish RSI directionality. That would suggest a bearish continuation and may lock in the $1668 target and possibly testing of the $1644 support line.
A fresh lineup of posts will be out this week. Hope you find them all useful. I'll have the live-stream videos up after editing and segmented into palatable chunks.
@theprivaysmurf


I have been trying to reach you for over a week about my subscription. You are sending emails saying mine has expired but we communicated last November where you extended me a reduced rate of $90 at that time if I would subscribe early, before you implemented your increased rates. I sent you a payment on Dec, 1, 2022 (date it cleared my bank) for the next annual subscription which was to start in July 2023.
Please correct this and reinstate my annual subsrcription.
Thank you,
Buck Beranek