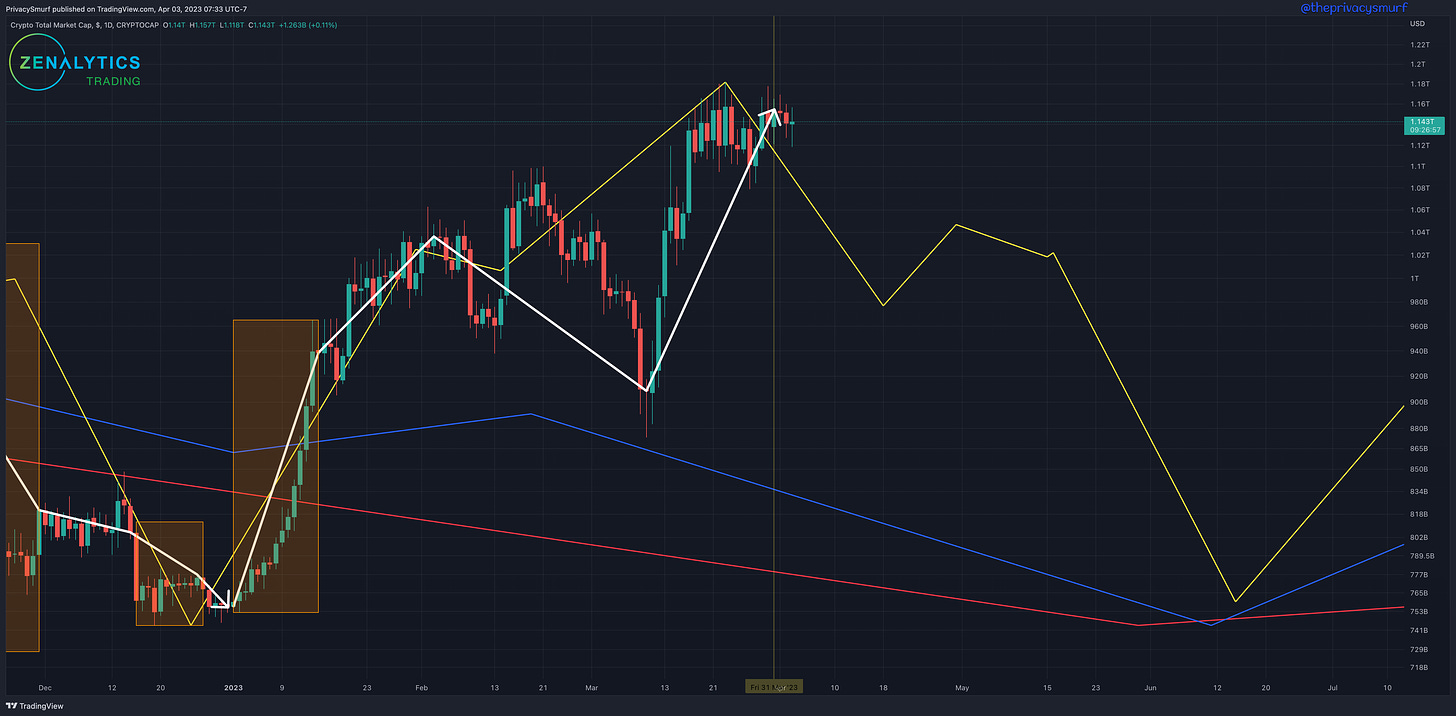
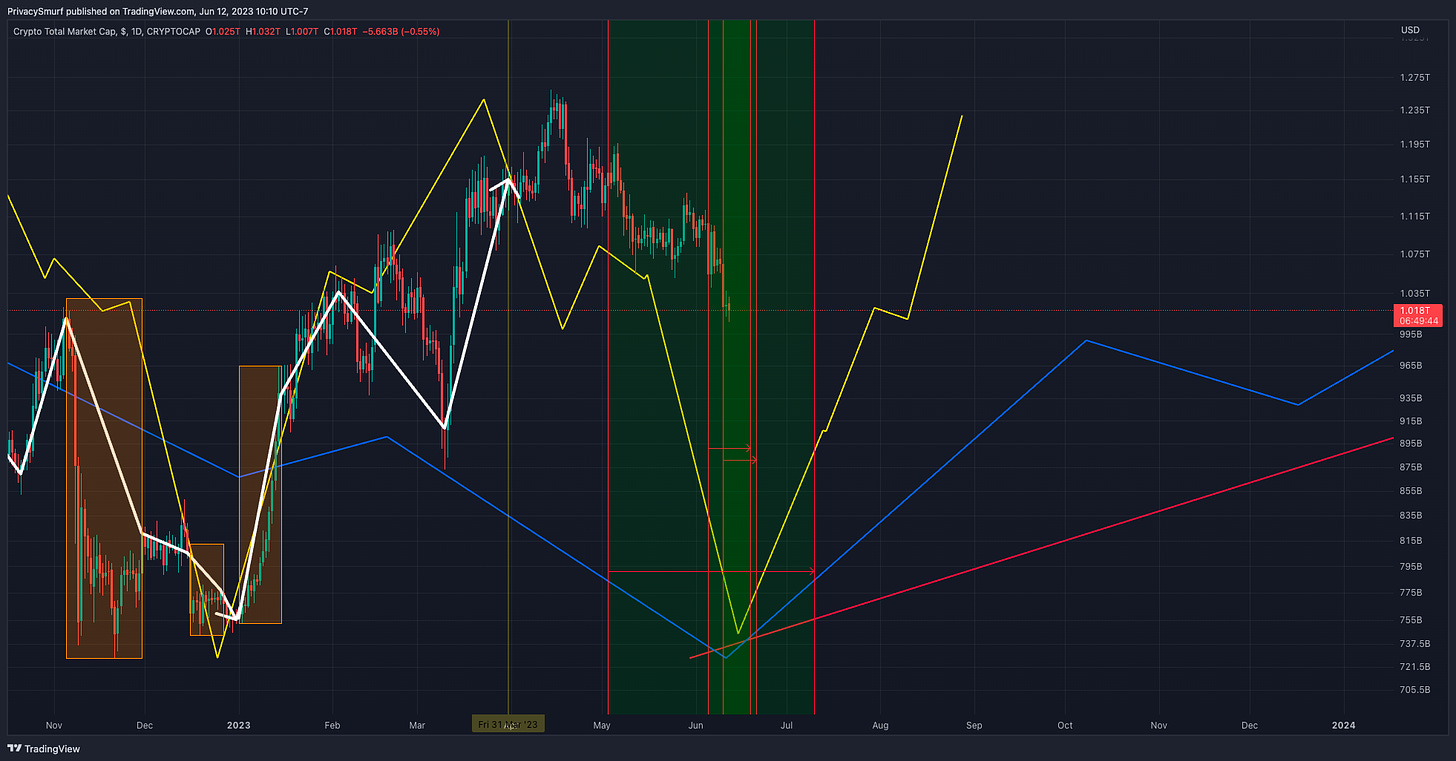
So there’s always the possibility of lower lows but so far the model presented for the Total Crypto Market Cap from April 3 in the Q2 forecast is bang on.
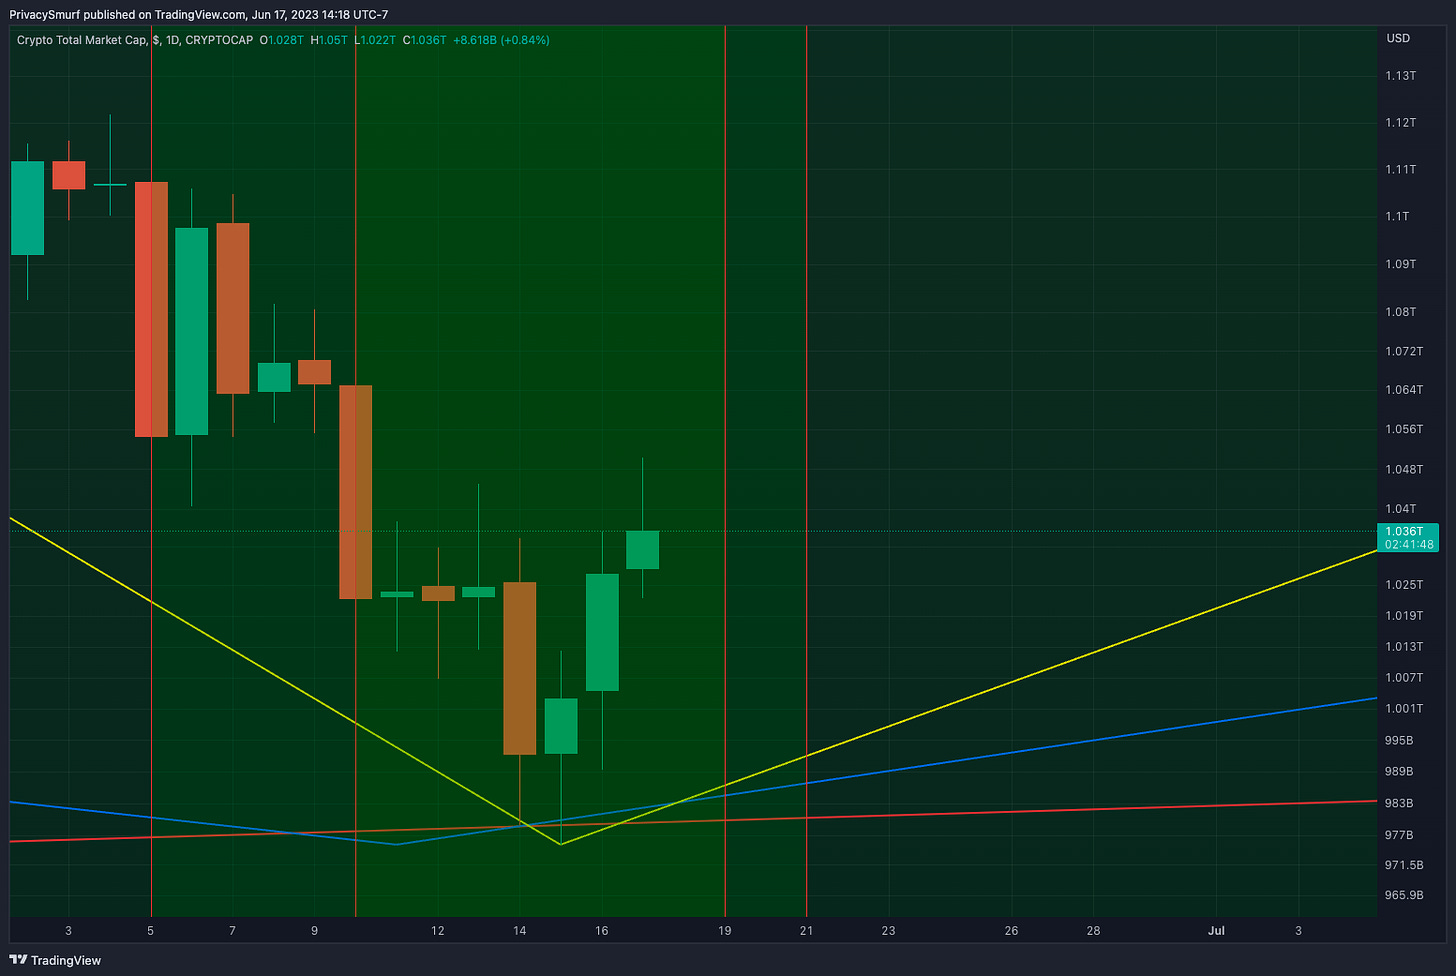
Last week I mentioned the timing for the bottoming window was approaching aligning the windows of the monthly, weekly, and daily cycles, creating a confluence from roughly June 10th - 19th, and looking for entry signals on lower intraday timeframes.
Zooming in focusing on just the daily modeling (yellow line) so far the lowest low is on the day EXACTLY which was forecast back in early April.
Again, I’m not saying that we can’t see a low again, but there’s ample technical and cyclical reasoning in support of evaluating entries for the next bullish phase.
BTC/USDT Daily Chart
**https://www.tradingview.com/chart/jjSdFW4b/**
From the last post:
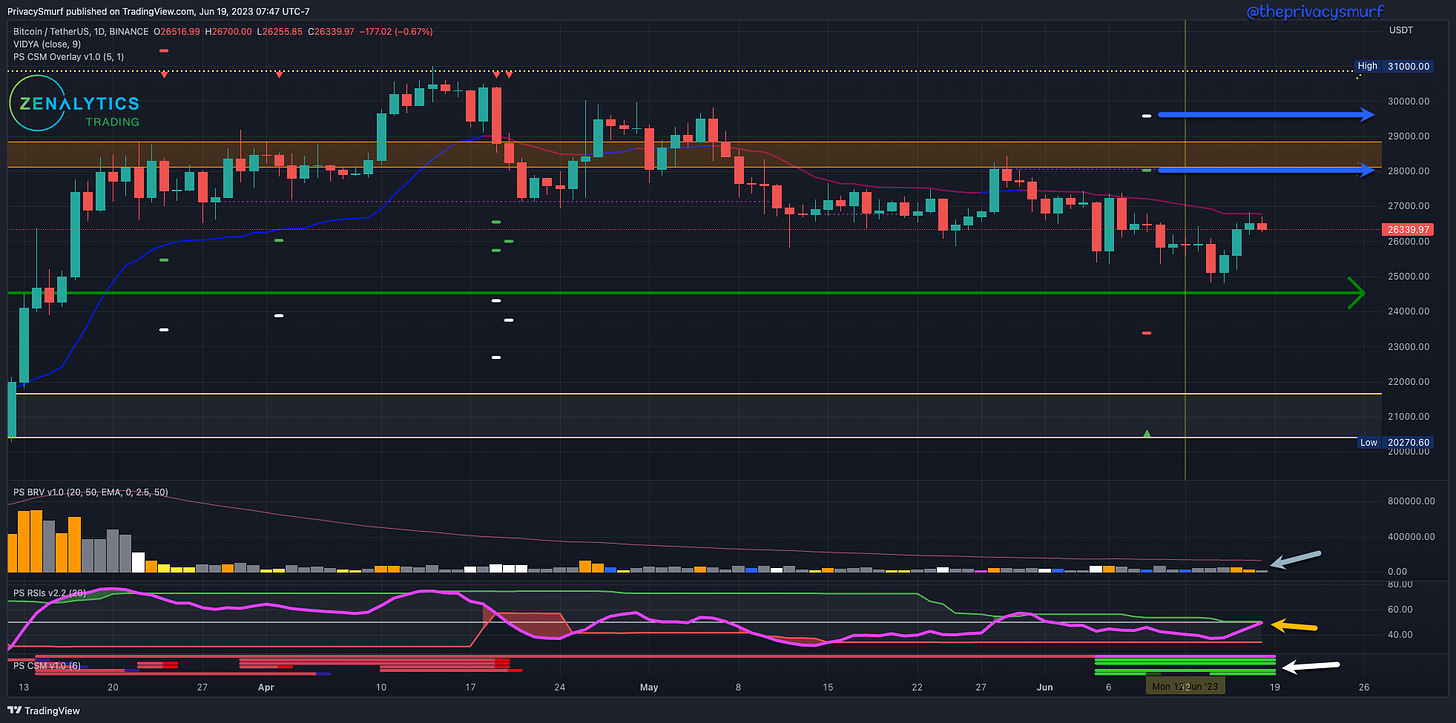
"... Consolidation from 25K to 27K may be on the horizon..."
Since the last post, as expected, consolidation between the $24.5K and $27K levels has begun. The RSI (yellow arrow) is trending toward a midline and adaptive top band break, indicating a potential impulsive bullish response in price that could hit the targets (blue arrows) signaled by the Correction Strength Meter on June 9. Volume (grey arrow) is still decreasing overall. An increase in volume combined with the RSI bullish break will be necessary to start a new bullish trend. It's worth noting that with the recent lows on June 14, new bullish reversal setups on the CSM (white arrow) have appeared, suggesting that an overall momentum shift is coming. A quick breach above and return under the adaptive top band for the RSI would likely lead to further consolidation at these same levels, but I still expect wicking above $27K in that event.
ETH/BTC Daily Chart
**https://www.tradingview.com/chart/gTkSjkj6/**
From the last post:
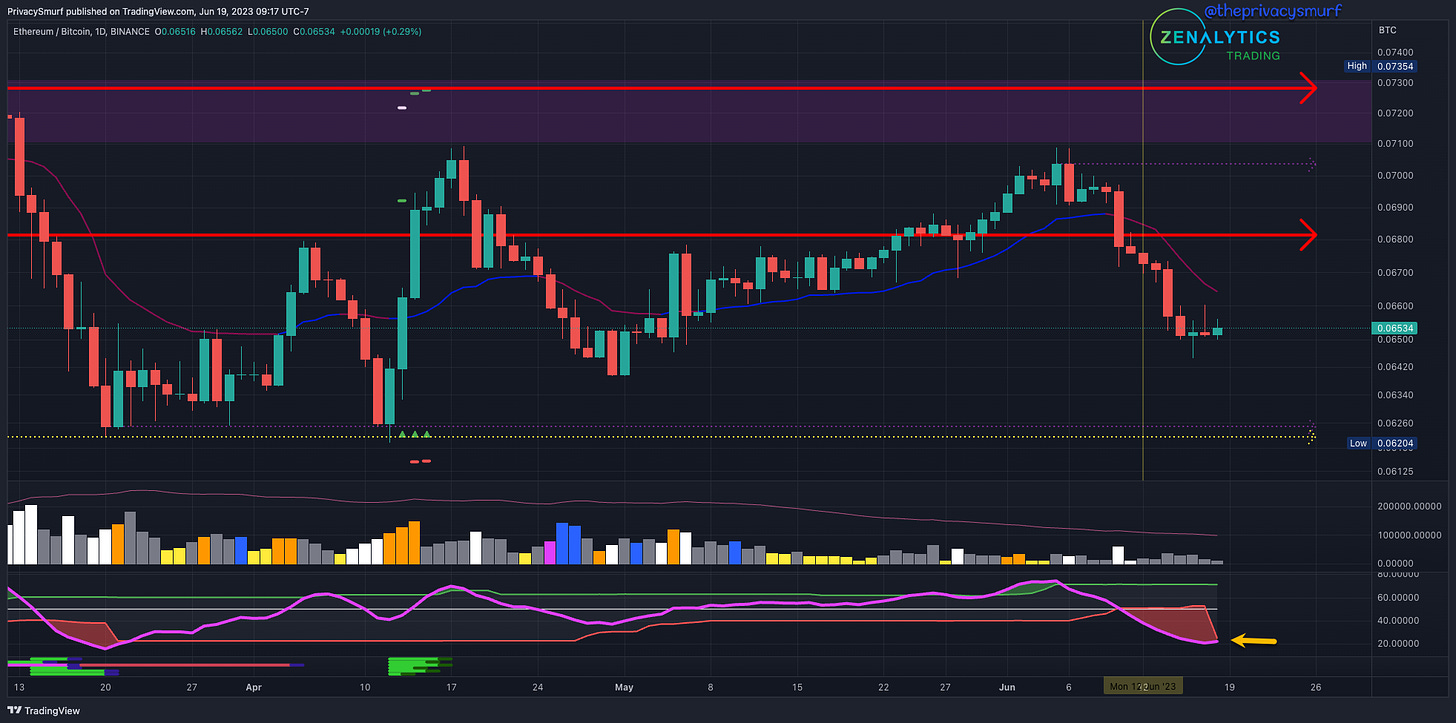
"... RSI… below the midline and bottom adaptive band which suggests further impulsivity to the downside... support region around 0.065 to 0.0665…"
Since the last post, the expected impulsive downside price action has continued, with the lowest close at 0.06513 as of writing. The RSI (yellow arrow) has not yet returned above the adaptive bottom band, indicating that there may be additional downside action. Once the RSI measures above the bottom band again, a range high at 0.068 and the lowest close prior to the upward cross of the bottom band can serve as the range low. Ultimately, there is a floor at around 0.0625, and I expect that closes will hold above this level in the event of further downside.
ETH/USDT Daily Chart
**https://www.tradingview.com/chart/xbB6lkZu/**
From the last post:
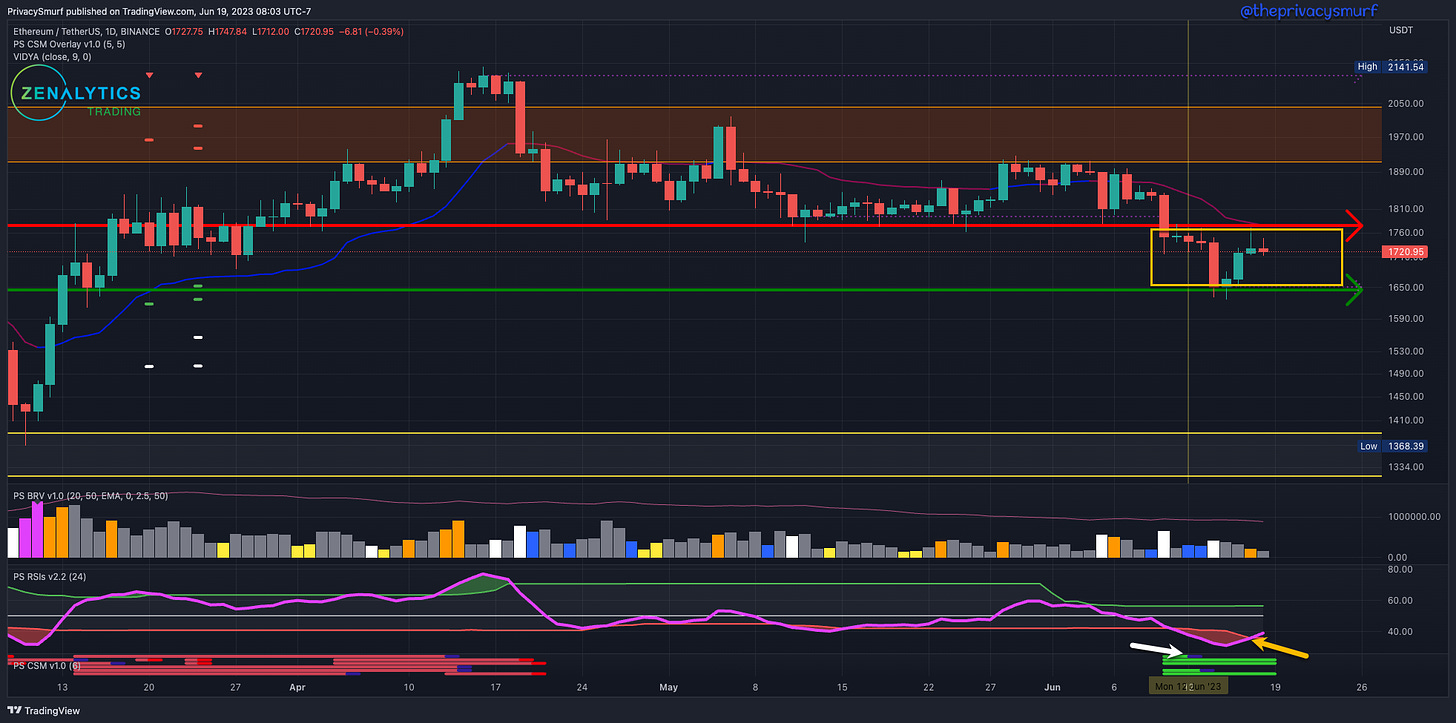
"...any invalidations of bullish divergences on the CSM… and bearish RSI directionality... suggest a bearish continuation and may lock in the $1668 target and possibly testing of the $1644 support line… "
Since the last post, invalidations have appeared on the CSM (white arrow). As a result, the bearish target from the April 19 trade signal was reached and the $1644 support line was tested. The RSI (yellow arrow) has since returned back above the bottom band, suggesting a local floor at the lowest close ($1650). If the RSI stays above the bottom band and below the midline, I expect closing prices to mostly consolidate within the range between the two marked price lines, $1644 - $1744. If the RSI breaks above or below the bands, I expect that to match with the break of the resistance or support.
See you tomorrow with the updates on trade positioning.
@theprivacysmurf


