Can't say I didn't warn you...
"... there’s ample technical and cyclical reasoning in support of evaluating entries for the next bullish phase."
ALSO, Let's see what may be in store for the coming week.
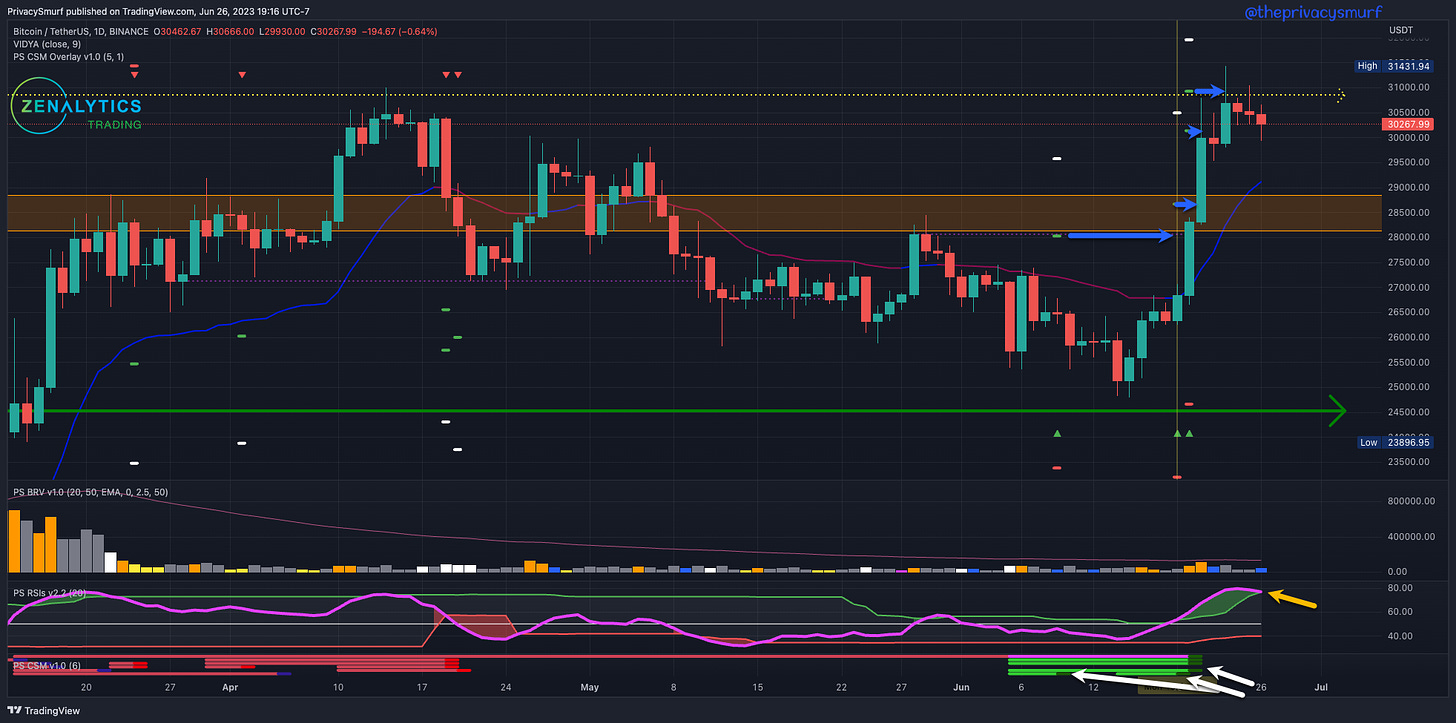
BTC/USDT Daily Chart
https://www.tradingview.com/chart/jjSdFW4b/
From the last post:
"... RSI... indicating a potential impulsive bullish response... could hit the targets... overall momentum shift is coming..."
Since the last post, as expected, the RSI (yellow arrow) broke out above the midline and the adaptive top band, which suggests the potential for bullish impulsivity in price action. Multiple bullish trades were signaled by the Correction Strength Meter (white arrows). The primary signal on June 9th hit both targets and all follow-on signals hit initial targets. The $30.8K level, which was the bottom of the major decline in 2021, is holding as a resistance for the time being. The RSI is trending towards returning under the top adaptive band. Closing below the band would suggest a local ceiling may be formed at the highest close at $30688. It will be important to watch the RSI if prices start trading back above this level and into new highs again. If the RSI continues the downward trajectory that will show a bearish divergence which would mean overall bullish momentum is waning and a deeper correction may be in order sooner than later. Invalidation, by means of new highs in price and an RSI over 80, would suggest the bullish trend will continue. We may be in a moment of consolidation, accumulating bullish liquidity to go higher again. Concern for me wouldn't start creeping in until daily closes under $29K.
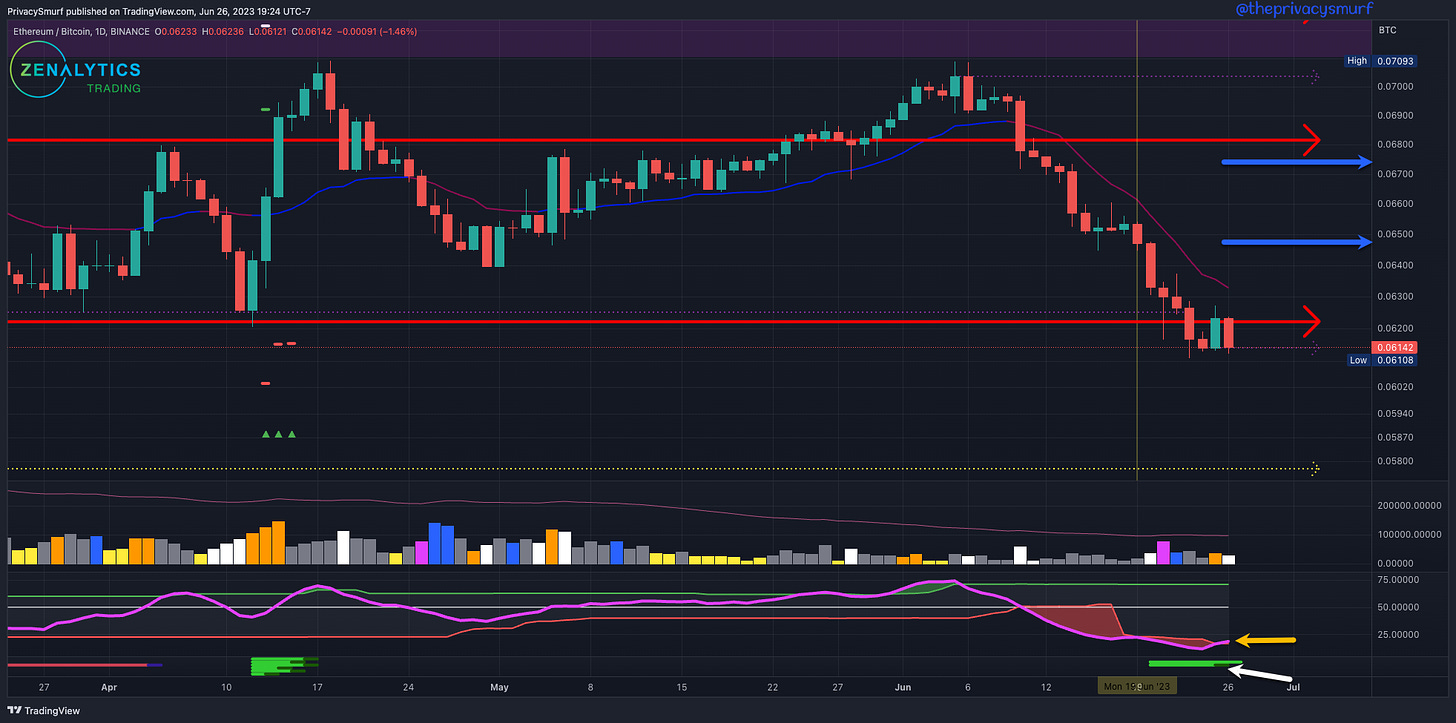
ETH/BTC Daily Chart
https://www.tradingview.com/chart/gTkSjkj6/
From the last post:
"... RSI... not yet returned above the adaptive bottom band... may be additional downside action…"
Since the last post, the expected impulsive downside price action has continued, with the lowest close at 0.06141 as of writing. The RSI (yellow arrow) has closed above the adaptive bottom band, indicating that there may be a local floor at the lowest close mentioned above. The Correction Strength Meter (white arrow) has signaled a bullish trade condition with targets (blue arrows) around 0.0648 and 0.0673. This may a decent time to rotate BTC into ETH and ALTs. If this chart bounces from here it would signal an outperformance of ETH (and likely other) ALTs over BTC. The RSI is critical to monitor. Invalidation of this plan would be setting new lows on the price chart and the RSI also making a new low outside the bands. This would either be BTC ripping again or everything across the market falling.
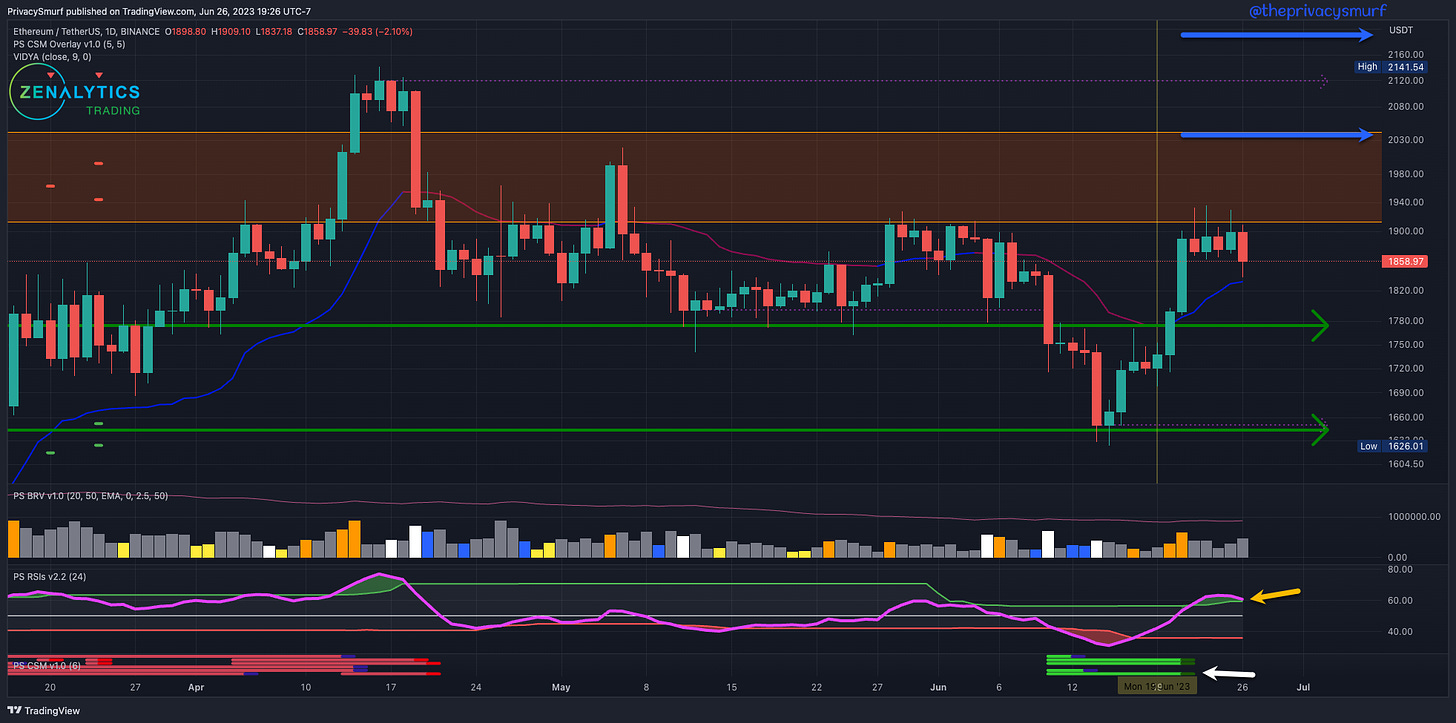
ETH/USDT Daily Chart
https://www.tradingview.com/chart/xbB6lkZu/
From the last post:
"...If the RSI stays above the bottom band and below the midline, I expect closing prices to mostly consolidate within the range between... $1644 - $1744. If the RSI breaks above... I expect that to match with the break of the resistance… "
Since the last post, the RSI (yellow arrow) continued upwards, showing increased bullish momentum. After closing over resistance the RSI broke above the midline affirming the bullish influences on price. While meeting initial resistances around $1900 the Correction Strength Meter (white arrow) fired off bullish trade signals with targets (blue arrows) around $2080 and $2190. There is no specified length of time for those targets to be hit. It may take some consolidation first. The RSI is trending towards returning below the adaptive top band. This would suggest the forming of a local ceiling at the highest close at $1898. It will be important to watch the RSI if prices start trading back above this level and into new highs again. If the RSI continues the downward trajectory that will show a bearish divergence which would mean overall bullish momentum is waning and a deeper correction may be in order sooner than later. Invalidation, by means of new highs in price and an RSI over 63, would suggest the bullish trend will continue. ETH's RSI measurements have plenty of upwards expansion to go before getting into "overbought" territory over 80 compared to BTC. This lends more weight to the thought that ETH and ALTs have more room to run in the next bullish spurt. If the RSI manages to stay above the adaptive top band or just dips below and pops back up I'd expect the initial targets to be hit with at least a wick. There is some level of resistance that may show up to keep daily closes under $2020. In the event, the RSI falls below the RSI and makes a local ceiling, concern for me wouldn't start creeping in until daily closes under $1774.
See you tomorrow with the updates on trade positioning. Hope everyone capitalized on some of the last week's green. If you were following the Position Playbook the previous week there should be plenty of secured profits already.
@theprivacysmurf


