


Halving Cycles Aren't Even Half Right
Why I think Bitcoin price action doesn't revolve around the Halving cycle

**Bringing this post over from my notion website so it can live here in substack. I originally wrote this April 13th 2024. (I think)…**
Here we are, at another Bitcoin halving. The crypto community is buzzing with speculations and analyses about potential price movements and market dynamics. Recent unprecedented occurrences SHOULD challenge traditional views on Bitcoin's price action around Halving events. In all that new activity, though, some (actively or passively) skip the opportunity to evaluate the widely accepted norms. People are so wrapped in these “universal truths” that they are blinded and fail to see the forest for the trees.
Breaking ATHs Before Halving: A Novel Event

Historically, Bitcoin's all-time highs (ATHs) have occurred after halving events, a pattern many attributed to the reduced supply and consistent or increasing demand. Above we can observe this pattern. Each ATH created after a halving was not broken until after the next halving.
However, this pattern has seen a significant deviation, with an ATH being broken before a halving for the first time. IMO this should ignite discussions about the validity of the common belief that “Halvings intrinsically lead to price peaks due to supply cuts” but instead I see talk about institutional investment, maturing markets, lengthening cycles etc. This deviation begs the question: are our foundational assumptions about Bitcoin's price action around the four-year halving cycle too rigid?
A key element on the chart that gets little mention is the duration of time between an ATH and ATH breaks progressively gets shorter making that ATH break closer to the halving. If price action patterns are revolving around this relatively fixed systematic supply reduction schedule, what is this effect?
The Misalignment of Halving Cycles and Actual Price Movements
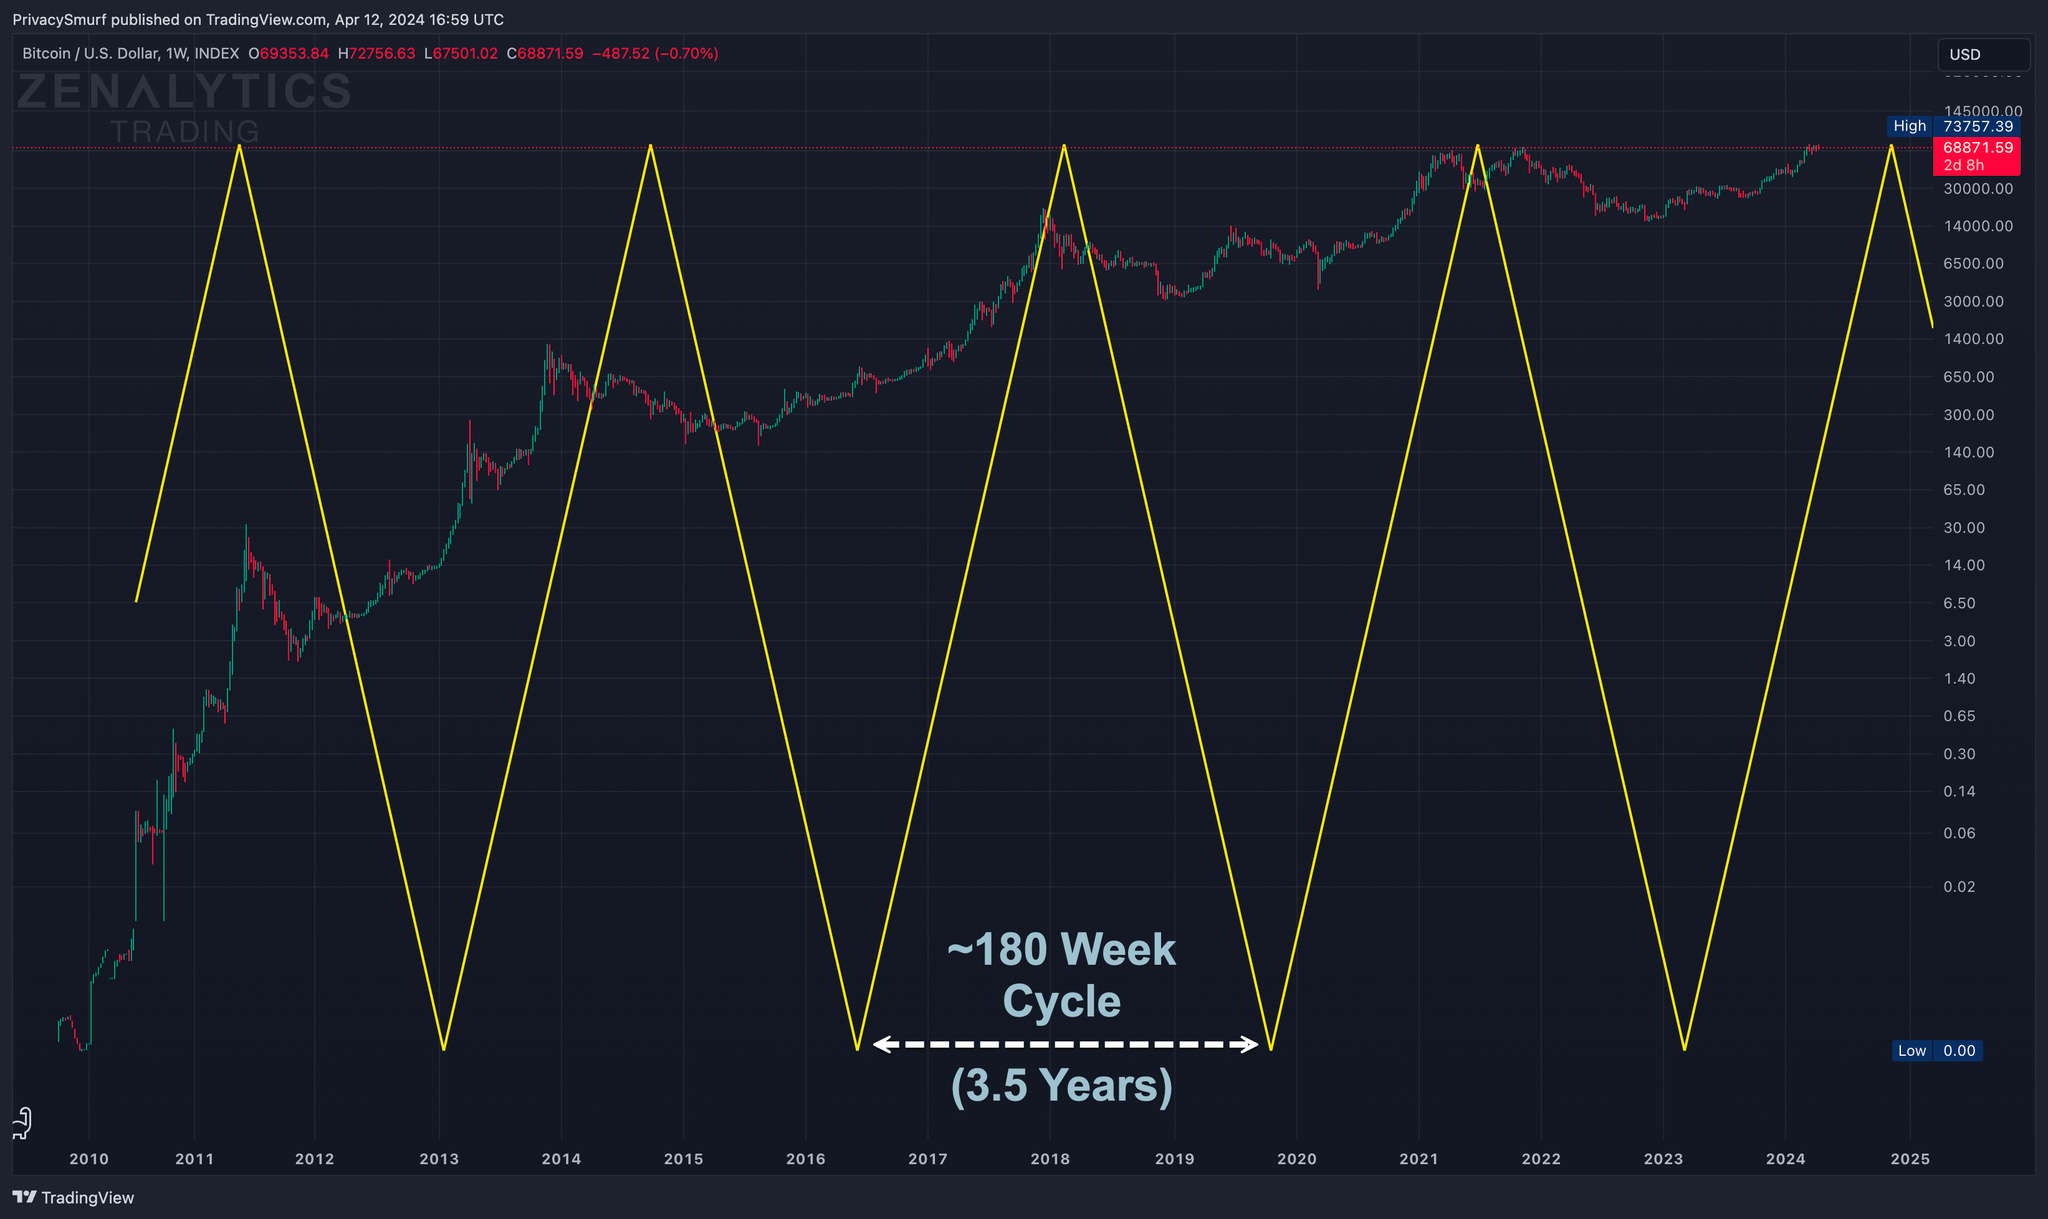
Cycle analyses using advanced techniques like Fourier and spectral analysis show that Bitcoin's price actions follow a distinct cycle independent of the halving events. The most correlated cycle to Bitcoin’s weekly price data lasts approximately 180 weeks (or 3.5 years) from bottom to top and back, contrasting with the proposed 4-year cycle based on Halvings.
This analysis also reveals an inconvenient truth: a cycle assumed to be four years (208 weeks), when closely scrutinized, isn't evident at all in the data. This suggests that the assumptions about halving impacts on price may be fundamentally flawed.
Predicting Future Cycles: Halving and Price Cycle Peaks

The misalignment between the detected price cycle presented earlier and the Halving schedule becomes increasingly evident as time moves forward in the image above. By plotting cycle peaks and Halving dates, it's clear that the time interval between each Halving and the subsequent cycle peak has been shortening suggesting that the market dynamics of Bitcoin are evolving more rapidly than its coded Halving events.
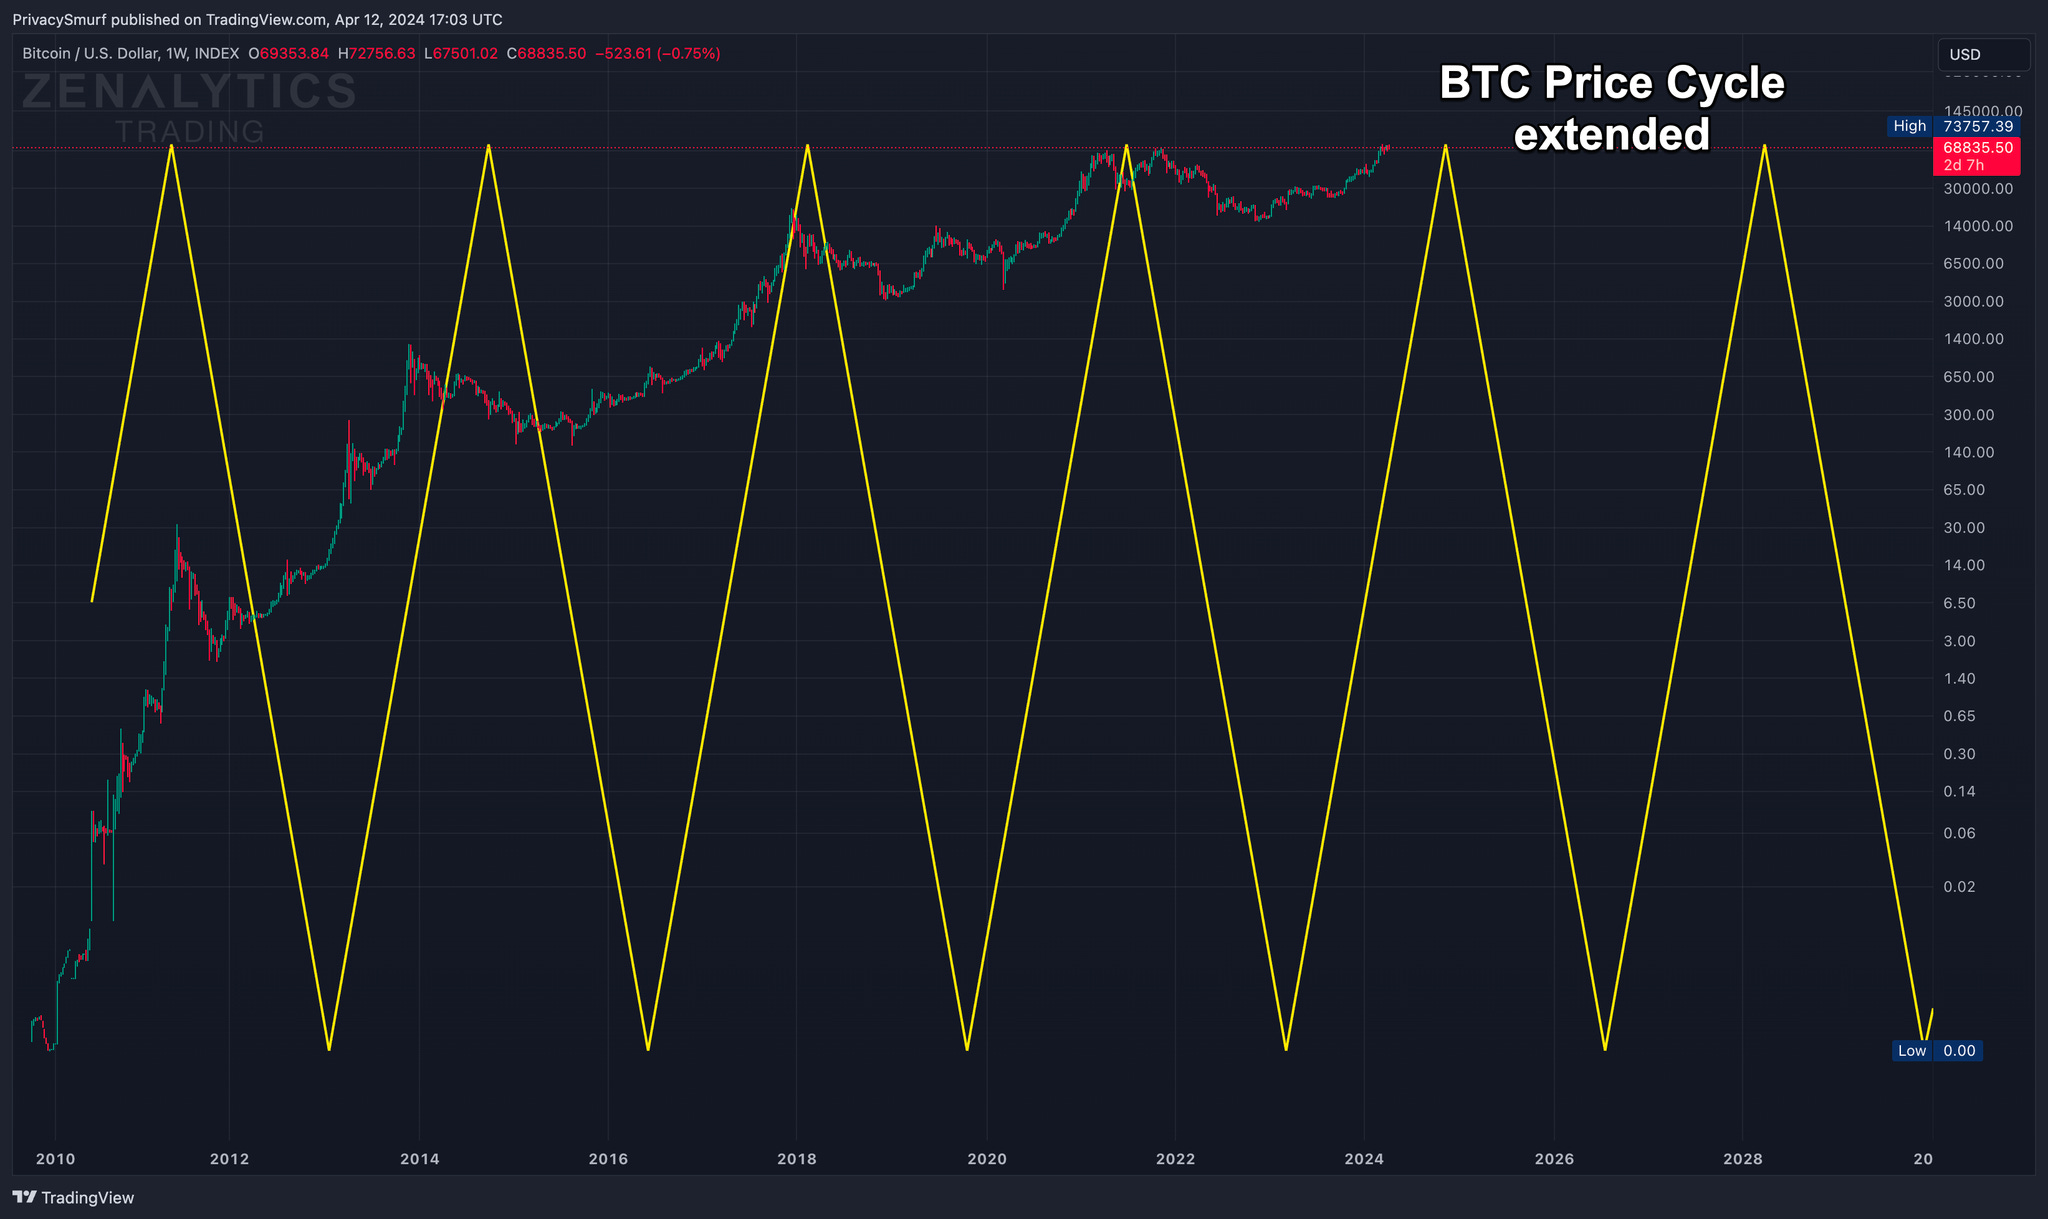
Seen above, the next 3.5-year price cycle peak is anticipated to occur later this year with a subsequent peak projected for early 2028.

Returning to the earlier format illustrating price cycle peaks and Halving dates into the future, the timing of future peaks and Halvings could coincide more closely. If current trends persist it is a forecast that could signify a paradigm shift in how many understand and interact with Bitcoin's market cycles.
Implications for BTC Traders and Investors
For investors and traders, understanding these nuances is crucial. Relying solely on Halving events as indicators of price increases or falls may lead to missed opportunities or misjudged risks.
It did so in fall of 2021 when the price cycle (and subsequently price) peaked yet many expected further price appreciation on a schedule dictated by prior Halving based trends.
Here’s a snippet from my 2021 Q3 forecast from July 2021 showing expectations for the 2021 fall topping.
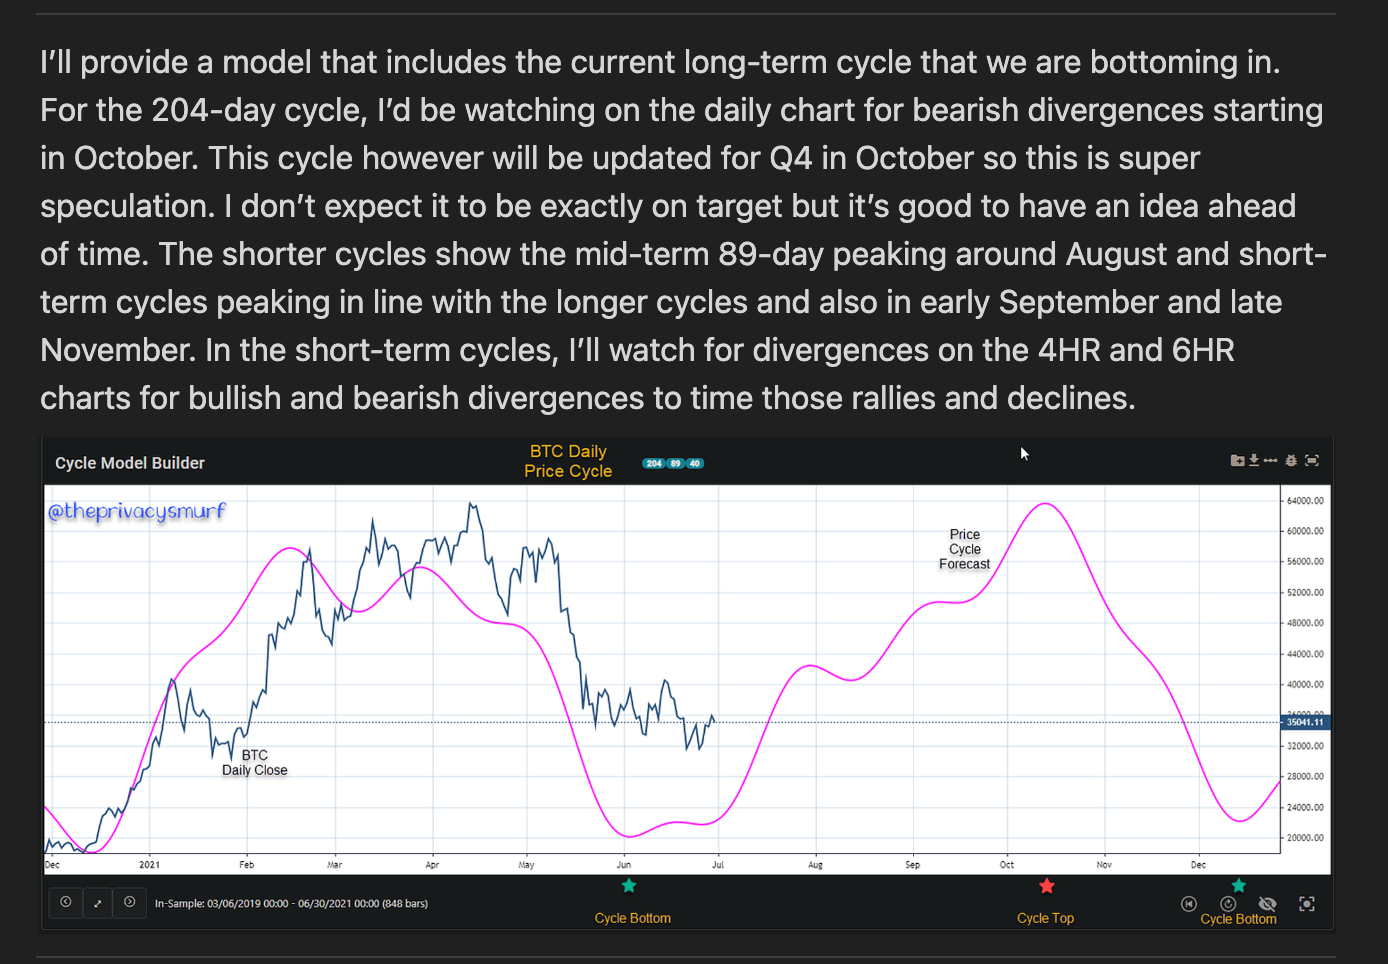
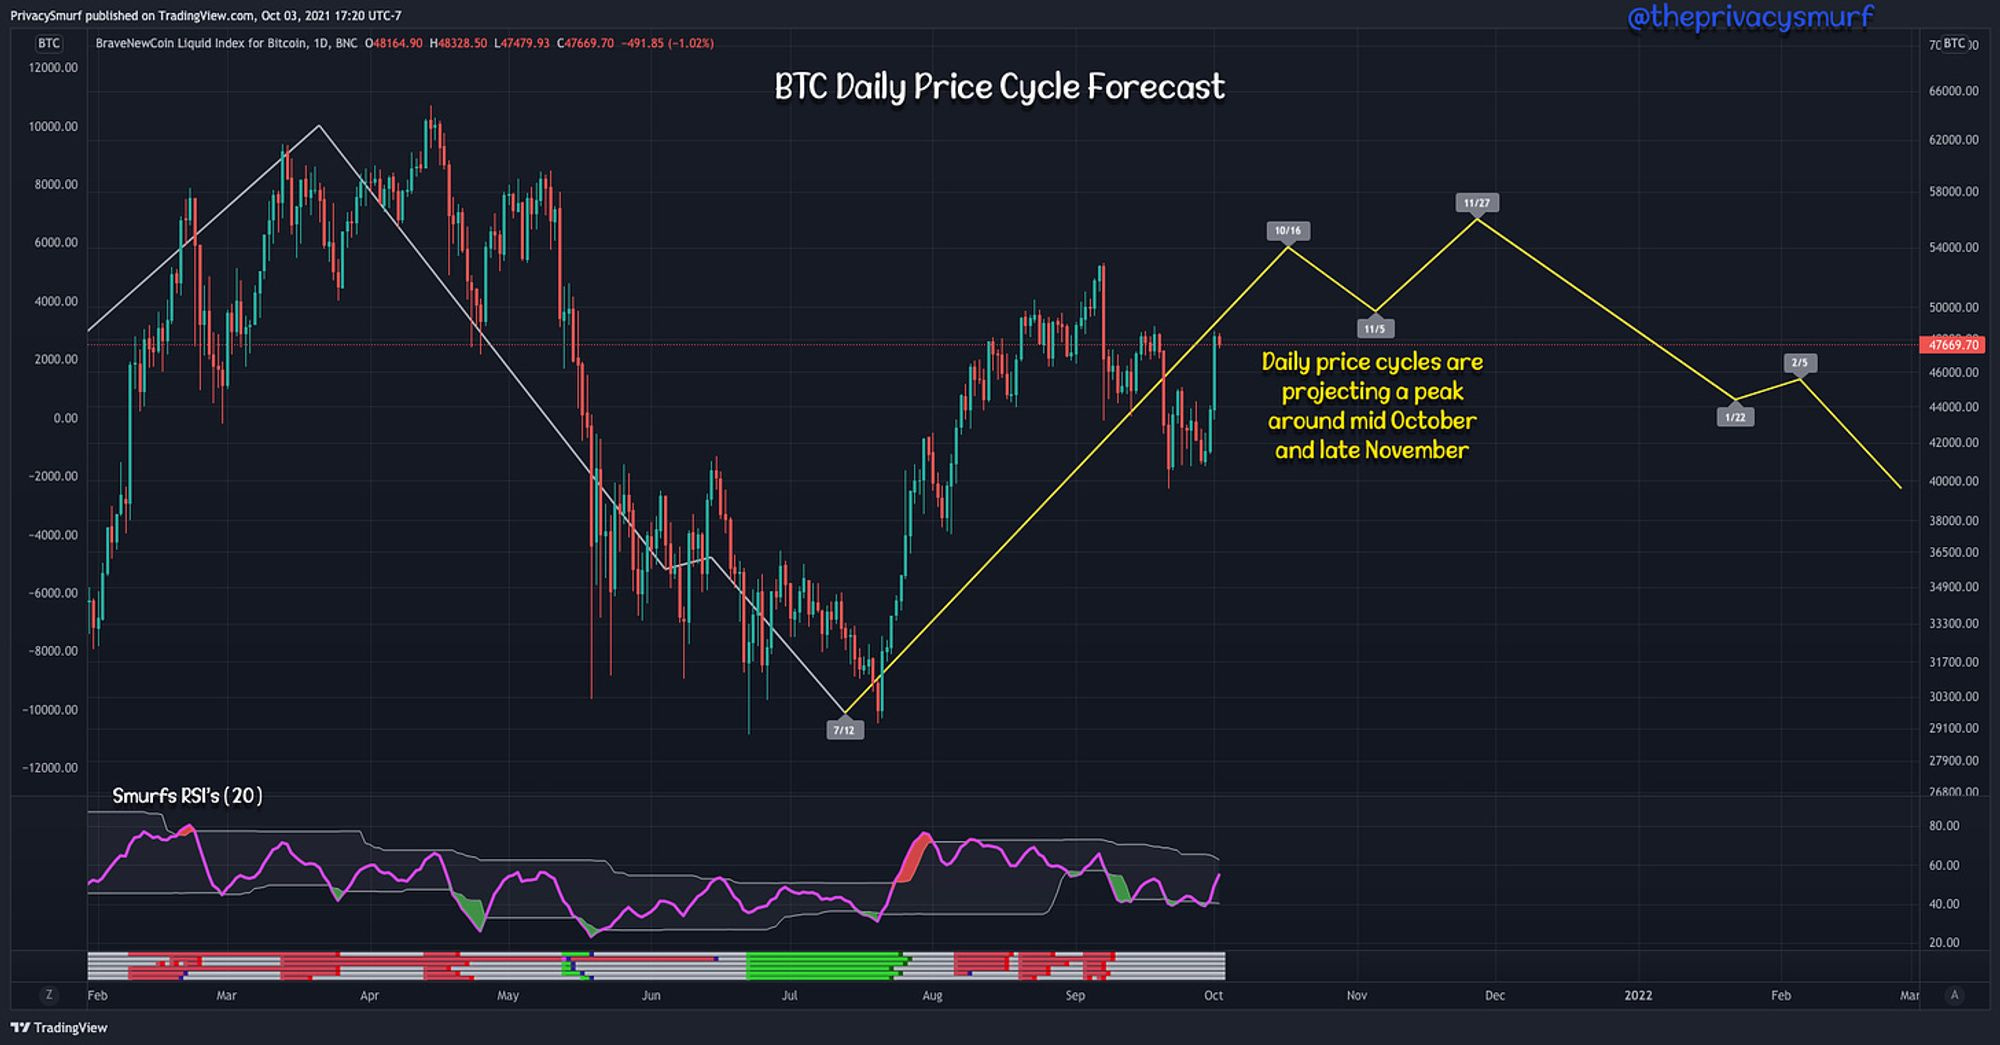
Here’s my projection of the top from the 2021 Q4 forecast in early October falling in line with and validating the earlier 2021 Q3 projections.
No forecast is useful without execution. In my newsletter I posted the selling off of a majority stake in my largest position, SOL, right near the top based on this same overall price cycle. SOL ultimately fell ~96% staring the next week.
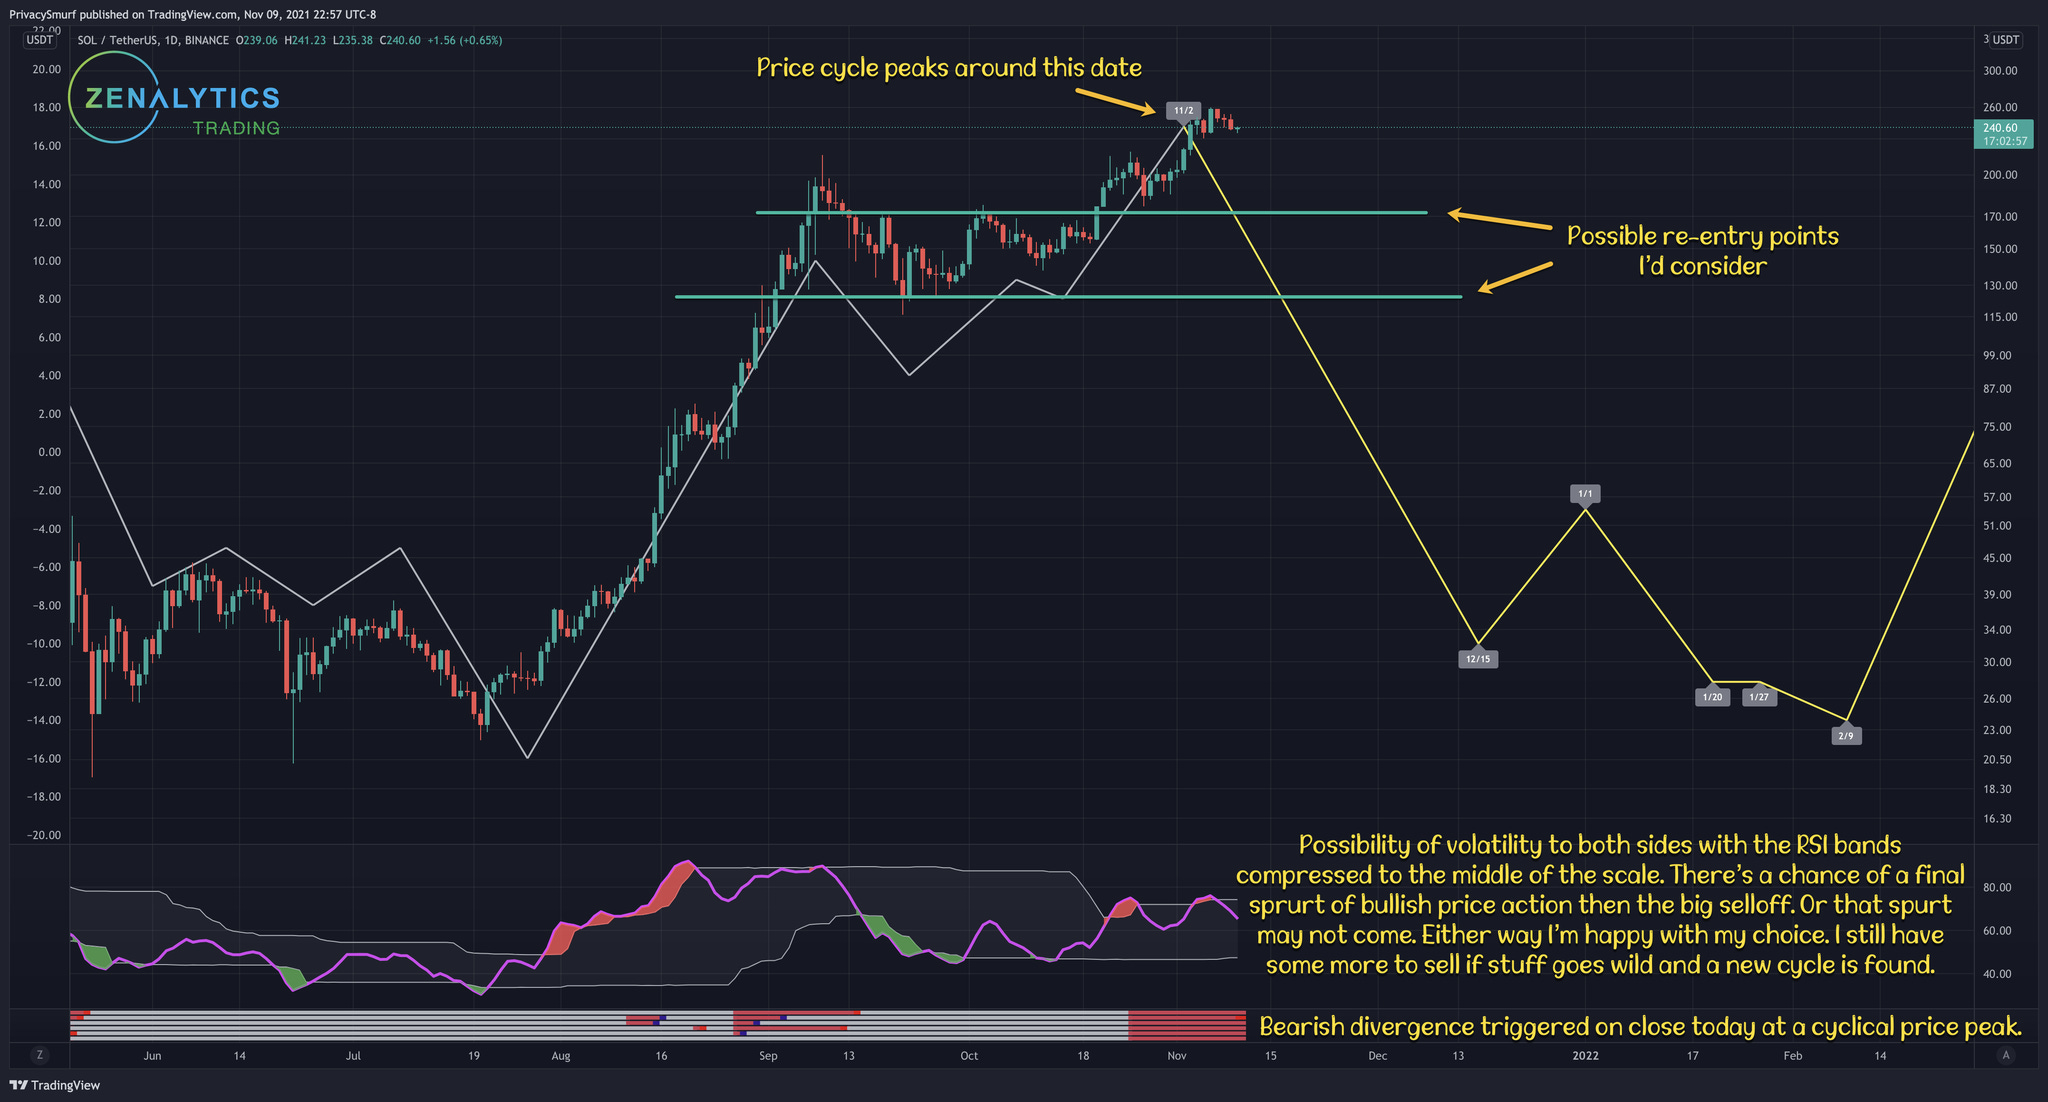
My partner started accumulating SOL again at the bottom with great success and overall SOL has recovered 3/4 of that value from the ATH. I wish I would have done the same but I have been making other plays lately.
The Future of Bitcoin’s Price Dynamics
What does this all mean?
Future BTC price action indicated by white squiggly line below is ENTIRELY made up and not representing my expectations around price levels. It’s merely an illustration of the theoretical future events if the effects I’ve described above in this post remain true.
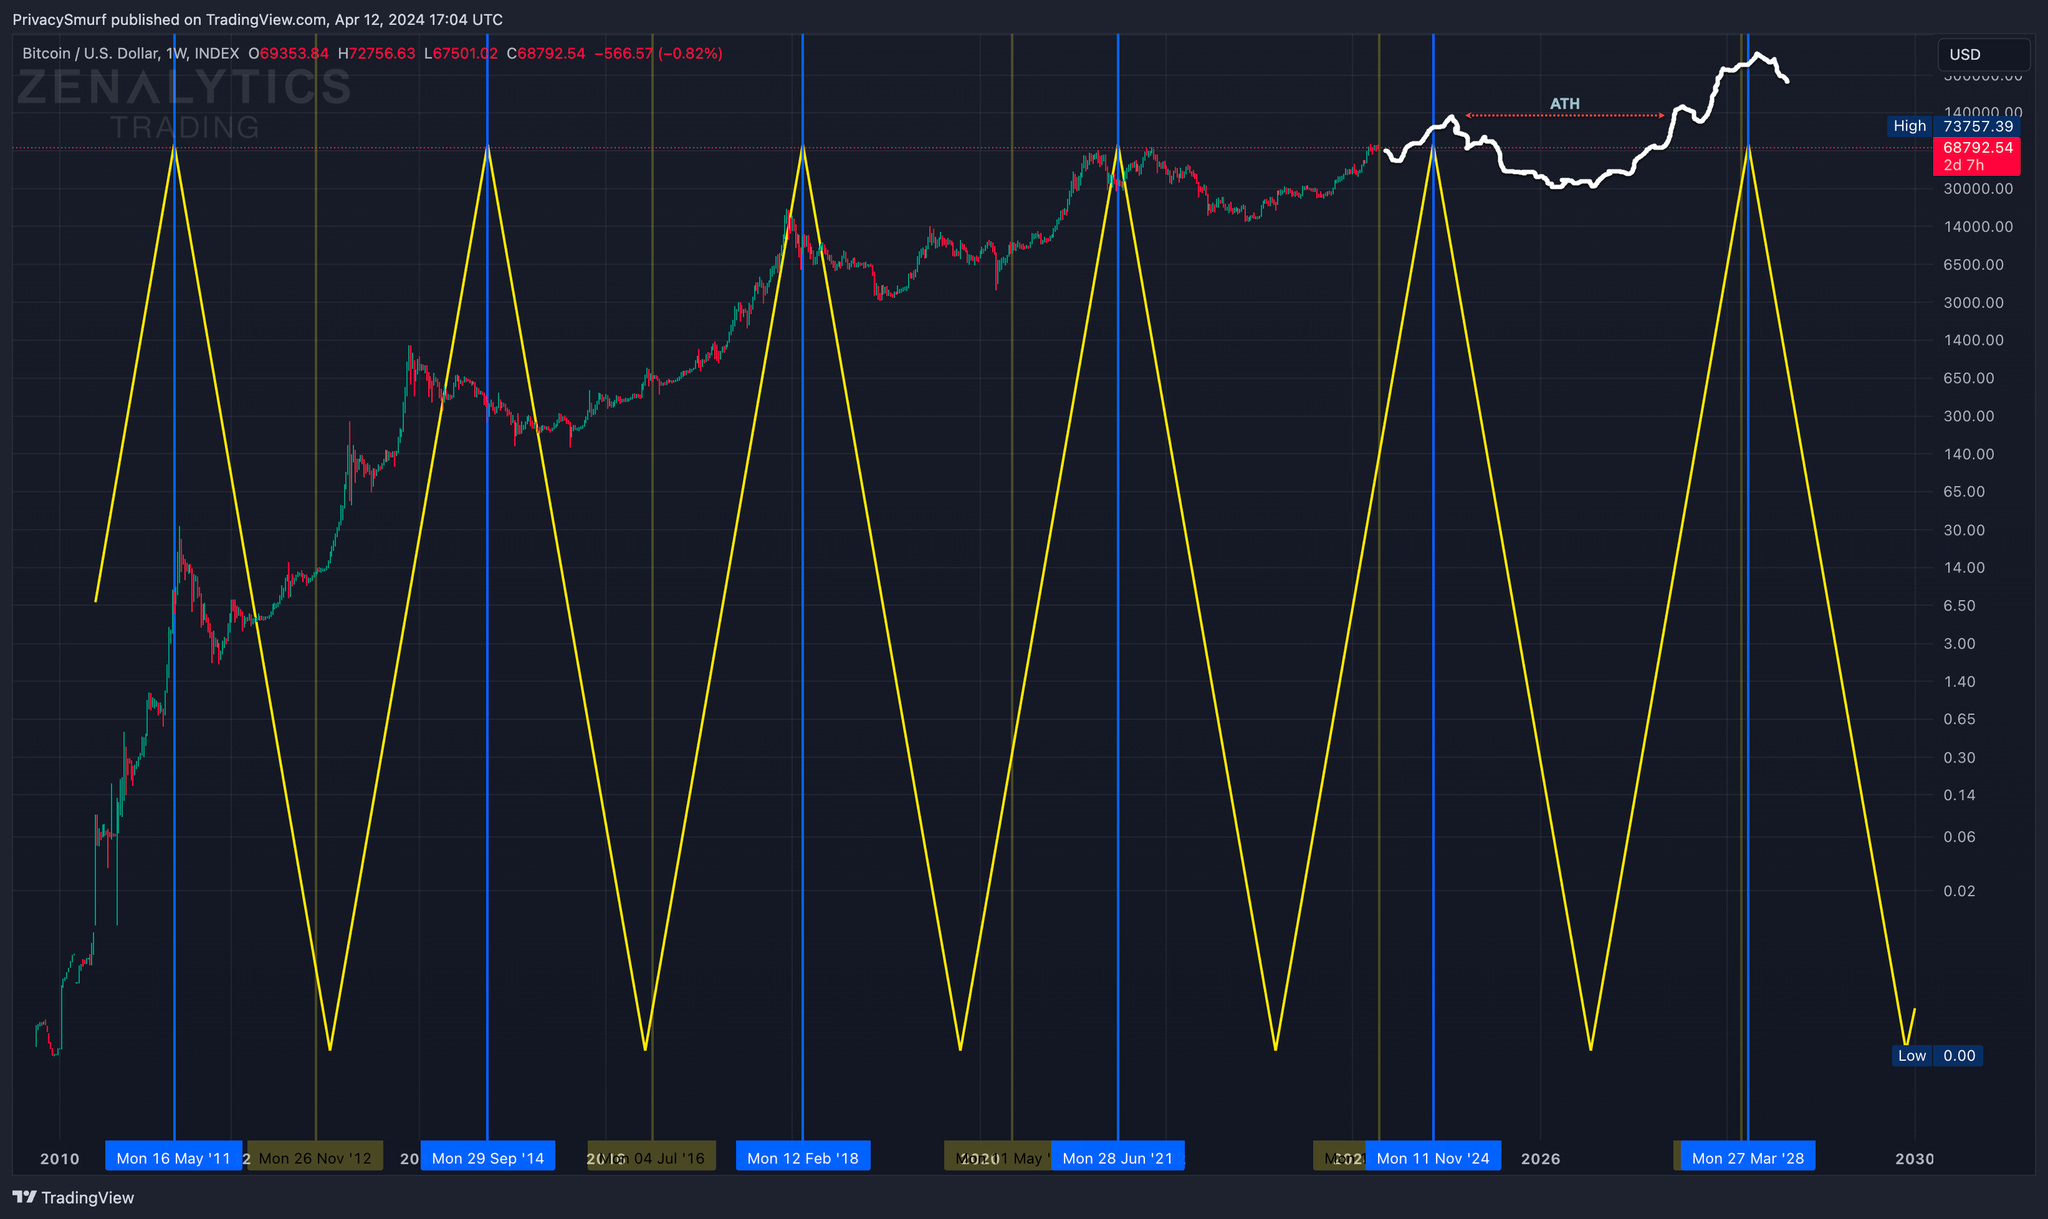
If the observed patterns hold, we could witness the formation of an ATH in 2024 around late Q3 to early Q4 of this year, followed by a bearish period and bottom concluding the current 3.5-year cycle in mid-2026. Next, potentially, the ATH set in the 2024 may be broken well before the next halving. This new cycle might then reach its peak around late Q1 2028, possibly just after that year’s Halving further complicating the notion that the Halving dictates price action patterns.
In conclusion, while the Bitcoin community has traditionally viewed Halvings as primary catalysts for bull markets, it’s crucial to cast a wider net to incorporate broader analytical perspectives that challenge and refine our understanding of market dynamics.
Side note: There are some notable analysts comparing the BTC price cycle to the global liquidity cycle which also resonates around a 3.5-year cycle. This correlation IMO carries more weight than Halvings in terms of BTC price behavior, but I’ve yet to do in-depth analysis in that regard.
Thanks for taking the time to read over my soap box rant. Haha
-PrivacySmurf-