

The Brier Score Explained in One Minute
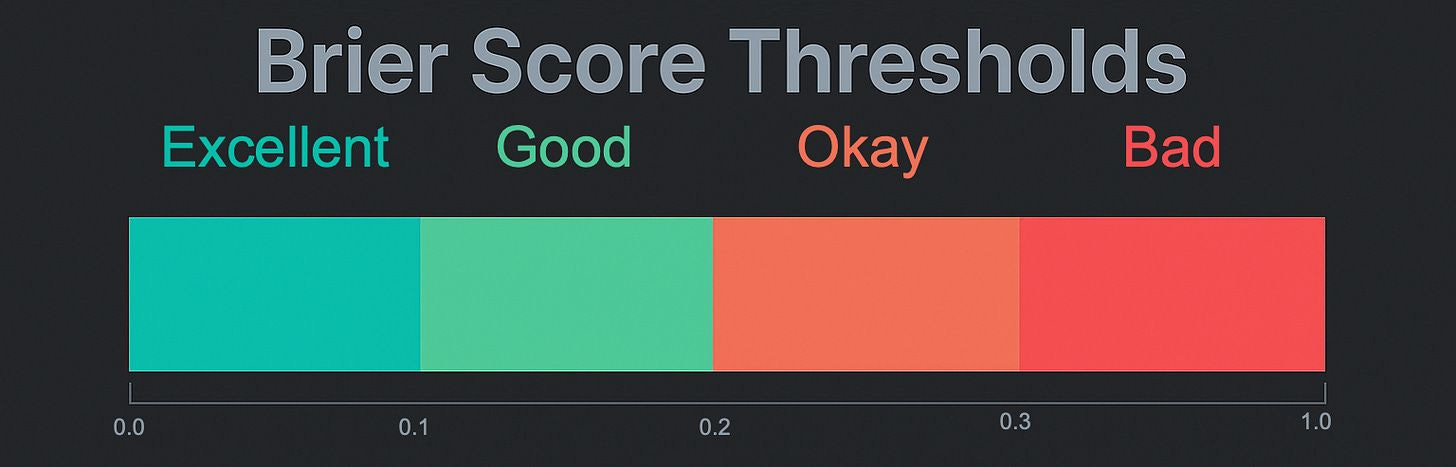
The Brier Score measures how often a stated probability matches reality. It ranges from 0 to 1:
0.00 Bullseye every single time
0.01–0.10 Sharpshooter with rare misses
0.11–0.20 Hitting rings consistently
0.21–0.30 Respectably, on the board
0.30+ Drunk monkey throwing darts blindfolded
Key takeaway
A lower score means my stated confidence matched real outcomes.
Example: If I plot 10 timing windows at a 70% confidence level and, in the future, seven out of ten turns are validated, the forecast (and my method) is perfectly calibrated (0.00 score). If I plot 10 more timing windows at a 90% confidence level, but achieve only half the time, a higher score reveals overconfidence in my abilities (~0.41), and you should approach my analysis with a grain of salt until I start showing improvement.
What the Model Actually Forecasts
The model projects cyclical turning points, not vague trend calls. For each cycle, it asks:
“When is the next projected low or high?”
“At that timestamp, will the closing price be higher or lower than the prior extreme?”
Probabilities are assigned to each outcome rather than yes/no answers.
Why This Matters to You
Transparent scoring builds trust. Every prediction is tracked, the hit rate is published, and the scorecard is updated. Over time, you can see where I am consistently right, where I drift into overconfidence, and how much conviction you should assign to the next forecast.
Quick Review of the Validation Rule
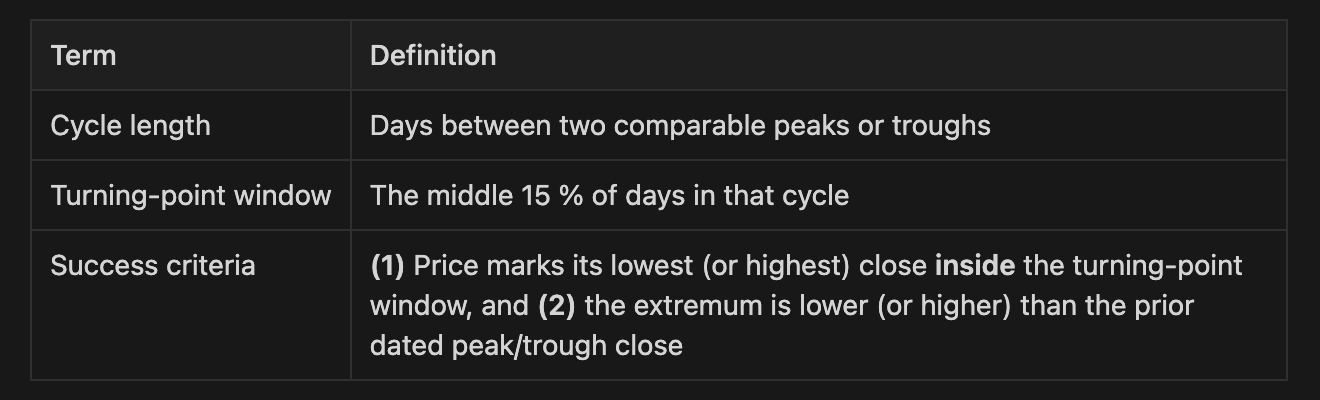
Concrete example
If 100 days separate peak A from peak B, the low-timeframe window equals 15 centered days (days 43–57). The lowest daily close in that span, which finishes below the closing level of peak A, validates the forecasted low.