

I can't believe it's not FUD!
I can't believe it's not FUD!
It sounds just like real the real thing!!


With Bitcoin trying to make some moves to the upside I’m sure a lot of people are breathing a bit easier. There are reasons to like this move to the upside. There are also reasons to not. I’m going to take a moment to highlight some of those bearish reasons. It’s probably not necessary for me to point out all the bullish ones, hopium and bullish biased TA abounds. What doesn’t exist in abundance is objective bearish TA. I’ll throw in some speculative stuff just for good measure too I’ll start out with some of the speculative stuff to get that out of the way.

***PURE SPECULATION WARNING***
Whale Games
No support is safe when compared against the amount of money large players have if they want to lower the price. All it takes is the right amount of sell pressure at the right times and right prices and leverage and stop losses do the rest.

People often point to buy walls and sell walls as a reason for or against a price move in some direction. That doesn’t really mean much though because orders can be removed from the books at any point in time. Until the order is filled it is only hypothetical support/resistance and a risk to just assume as truth.
Also read the follow-on post: Whale Antics results
***PURE SPECULATION WARNING***
Bitcoin and BTC Futures as a Hedge
If you search you can find plenty of things talking about institutions wanting to get a lower price. While that may or may not be true in varying degrees it doesn’t really matter. For any company adding BTC to the balance sheets, it’s not really about a speculative dream entry price and the time horizons are probably pretty far out. They likely aren’t going to be selling the spot BTC at the next cycle peak like all the speculators so it doesn’t matter what price they are in at. Just like with any commodity the Futures Market is where the real value is for them. This is where the large owners of some commodities (in this case spot BTC holders) make money. Spot buying is typically paired with futures positions and can go on and on until the asset hits the eventual floor.
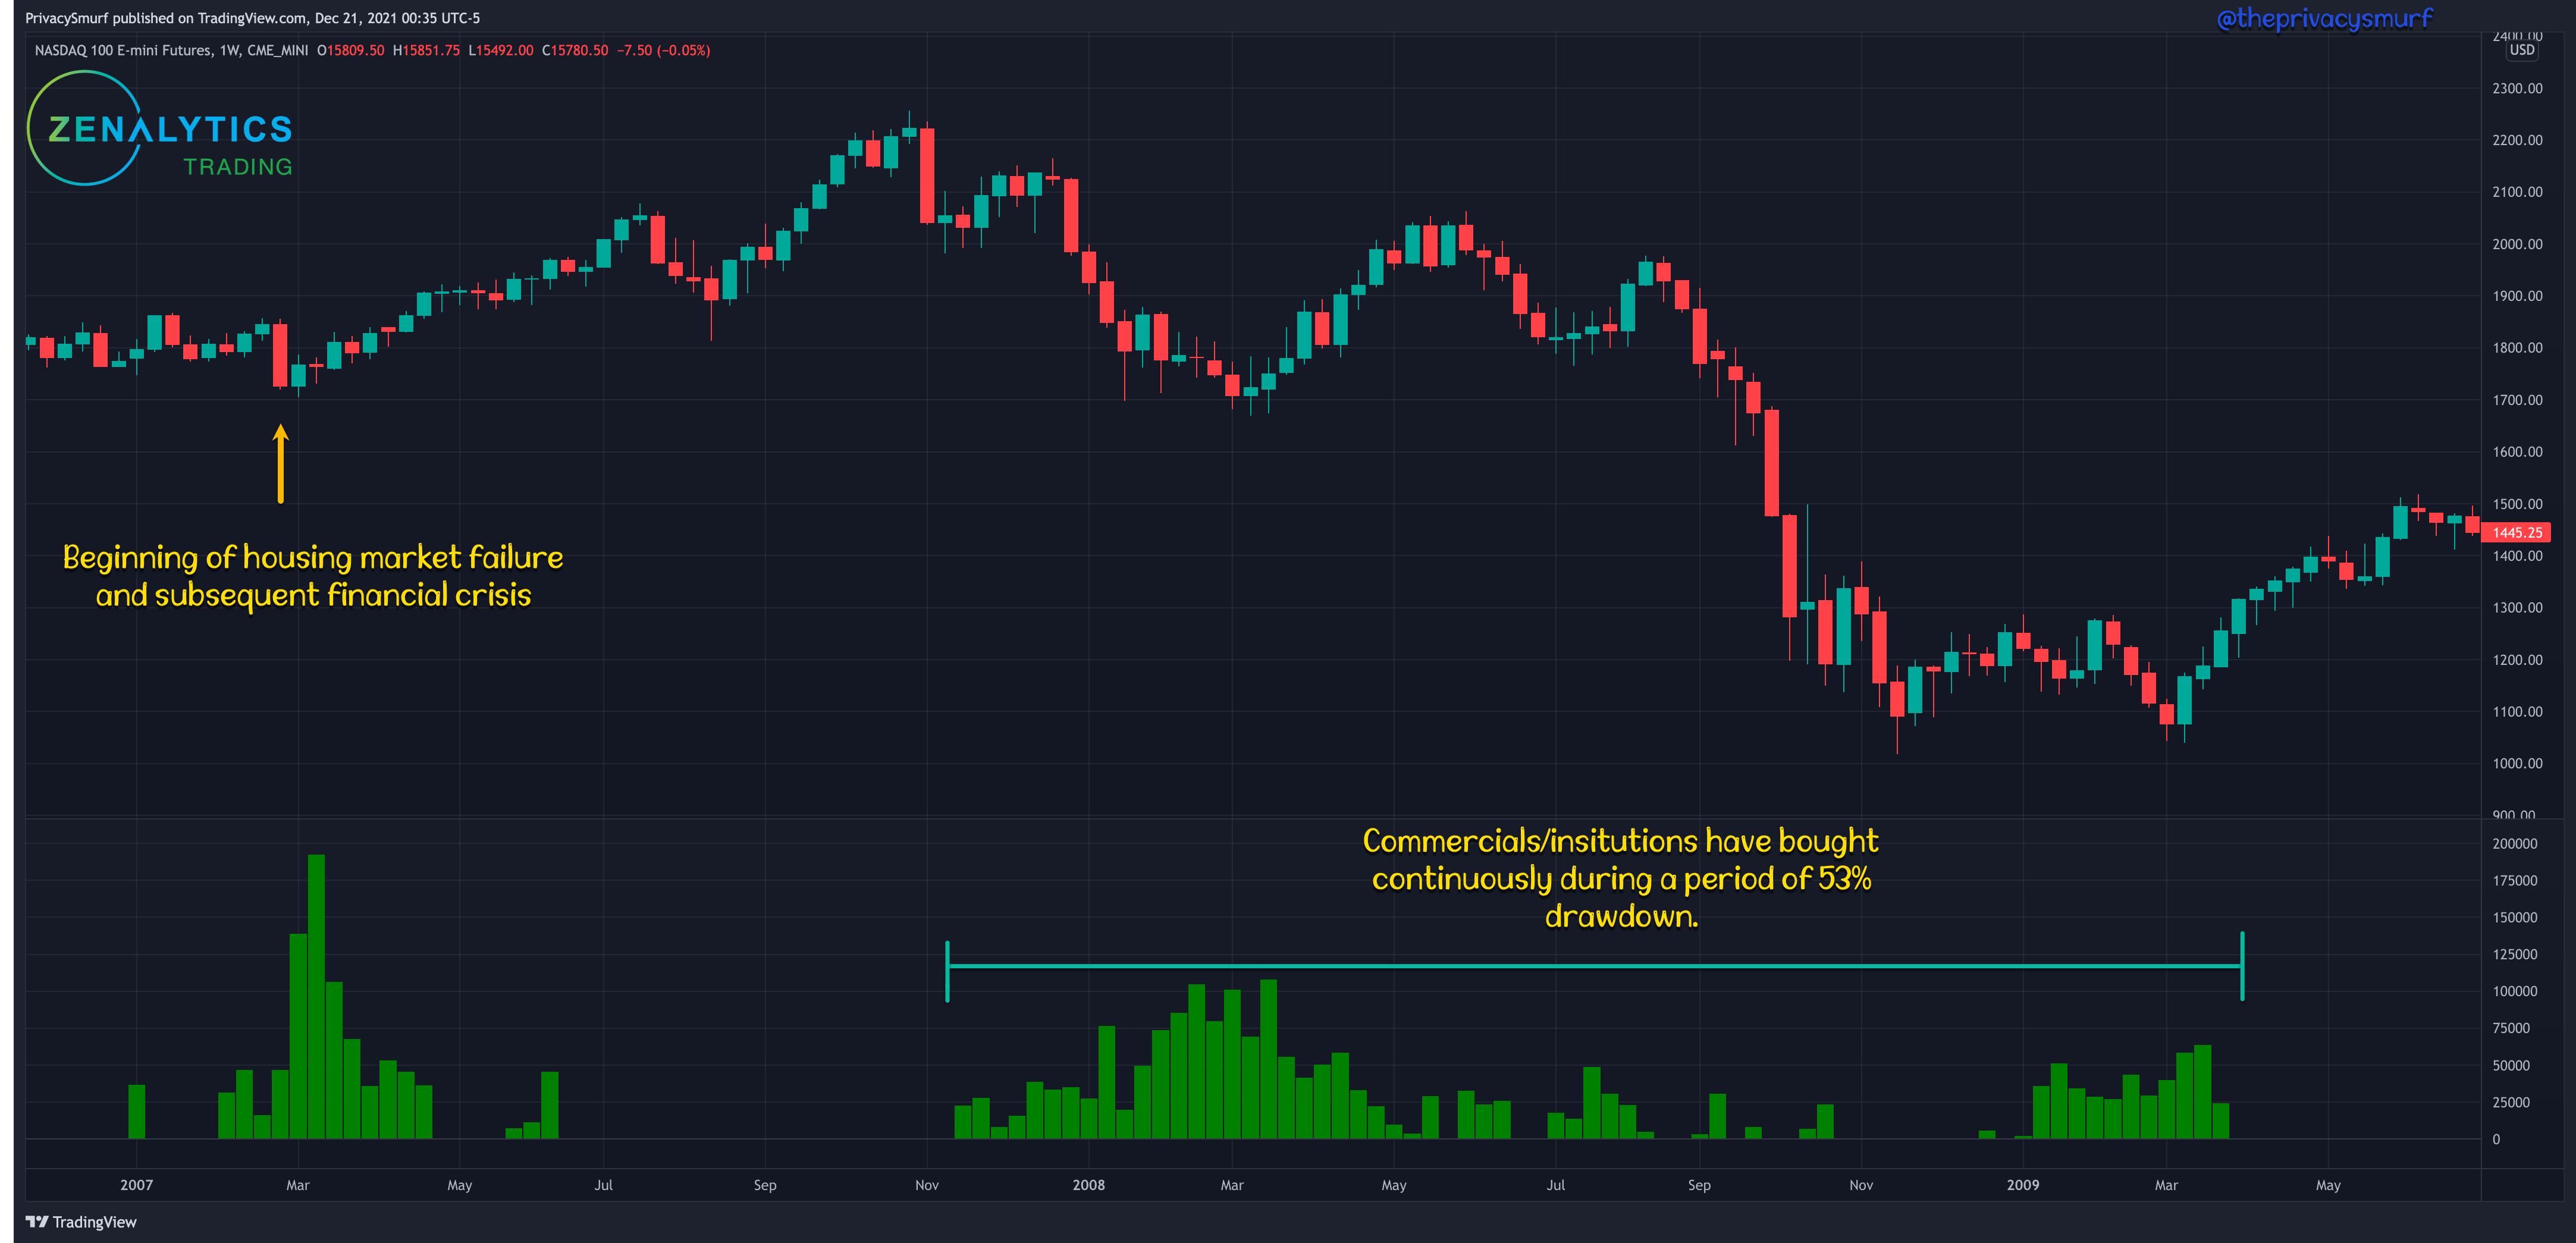
Here’s an example of that type of buy volume. During a global financial crisis, institutions bought and bought and bought and bought and bought positions in NASDAQ futures. They know that long run the price will probably go up to a place where they can start selling it. In isolation buying activity of large players is not a good signal for a bottom because they can continue to buy without looking at technicals. They have no shortage of capital to deploy.
Pair this futures buying with the well-timed two Whale Games I describe above and you have a recipe for very profitable spot and futures positions both to the long and the short side without really risking much spot BTC.
Now on to the objective technicals.

Historical Precedence or Lack Thereof
I’ve stated before we are in uncharted territory on various social media platforms. I’ll break that all down here.
Here’s the full history of BTC on the weekly chart. At the bottom is my indicator that shows potential bullish and bearish reversals identified by divergence on 6 different oscillators.
We’ll be looking at the period of red bars in 2017 and the current period at the end of 2021. For a bit of context the theory around my indicator, the Smurf Correction Strength Meter, is looking for a confluence of signals. The more indicators, measuring price’s momentum in different ways, agreeing that price is going to reverse the more likely the reversal. On the timeframes daily and above multiple types of assets (stocks, futures, crypto) backtest with successful projections and targets reached the majority of the time. Ideally, when all six are showing a potential correction the first indication of a trigger will plot the targets of the reversal.

Zoomed in on 2017 BTC saw a period of 6 weeks in bearish divergence when the price was increasing but oscillators were not. On the 7th week, the first oscillator resumed an increase in its measurements setting a new high. This is an indication of price continuation. In the following weeks, all but one oscillator was invalidated and the price continued up for nearly a full year before the 2017 peak and follow-on bear market.

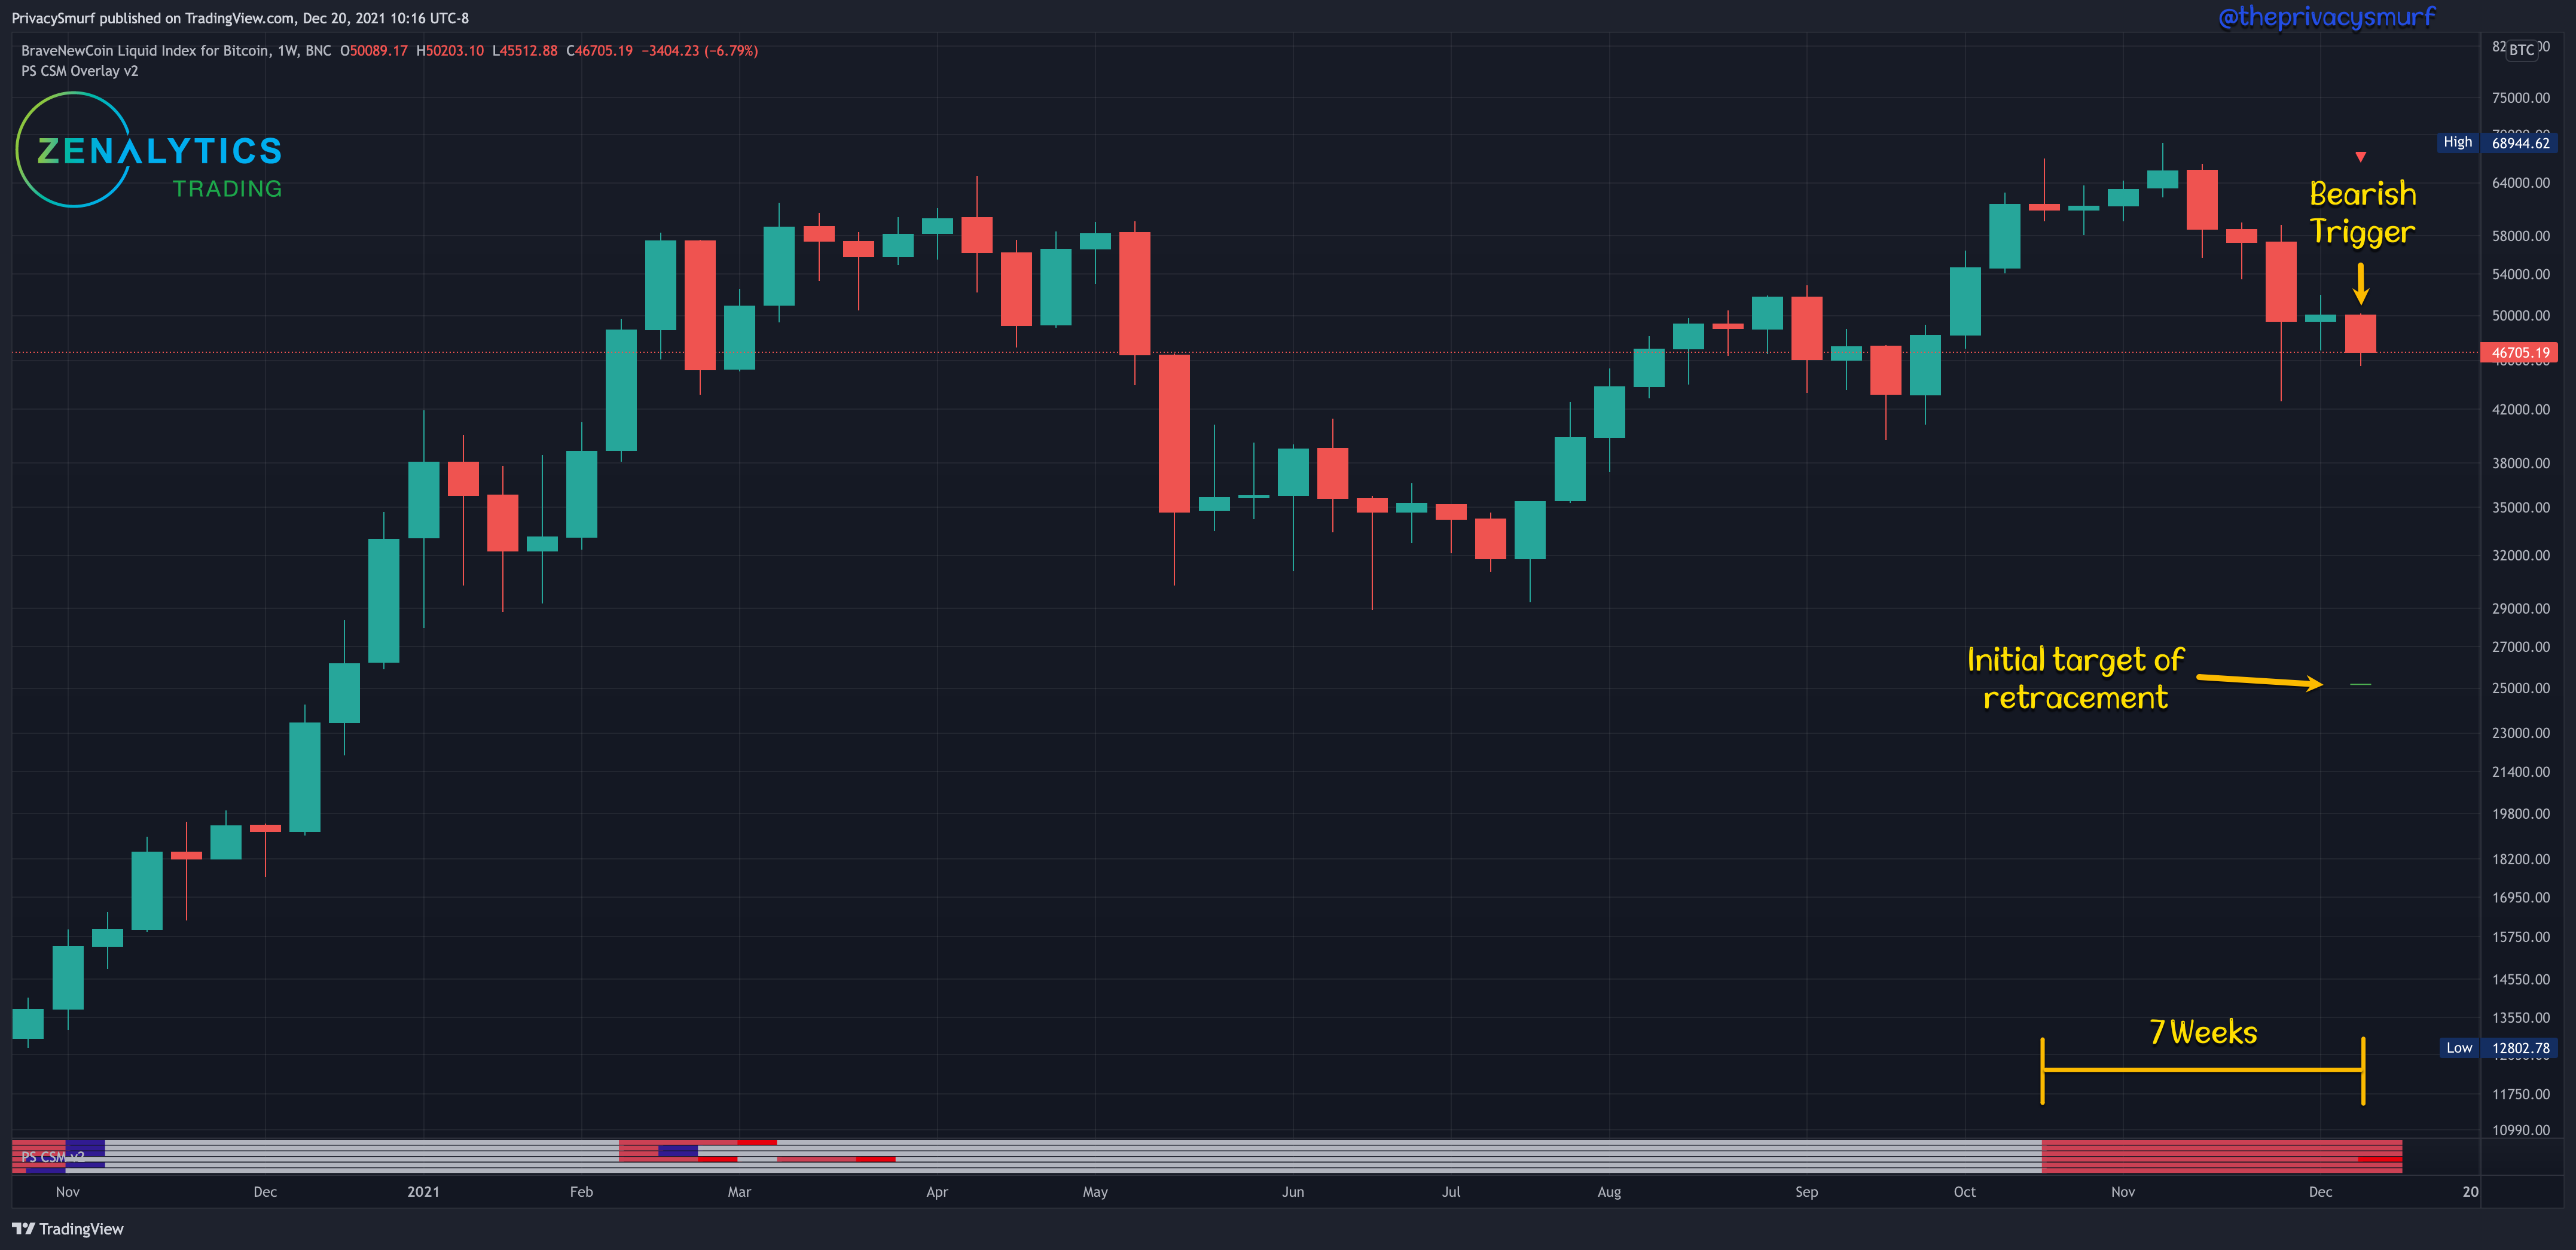
Now let’s look at where we are now in 2021. BTC spent 7 weeks in a bearish divergent period, the new longest period. In the 8th week, there are signals of a trigger of this divergence and a target given for the retracement. In the history of BTC there’s never been a signal with all oscillators in agreement with a trigger on the weekly chart. The particular oscillator individually has a 2 for 3 win rating on BTC which isn’t really a good base for statistical projections into the future but it’s not nothing, especially since it is in agreement with all the other oscillators.

Zooming out some we have the monthly chart. There’s only been a history of bearish divergence setups once when we challenged the previous ATH in Nov 2020. It was invalidated with new ATHs the next month. Here we sit with 2 months of bearish divergence setups and the month is set to close with a trigger signal and targets very close to the weekly chart targets.


If you don’t know I’m a fan of cycle analysis, are you even reading anything I do? :-p Here’s a reposted picture from the Q4 forecast in early October.
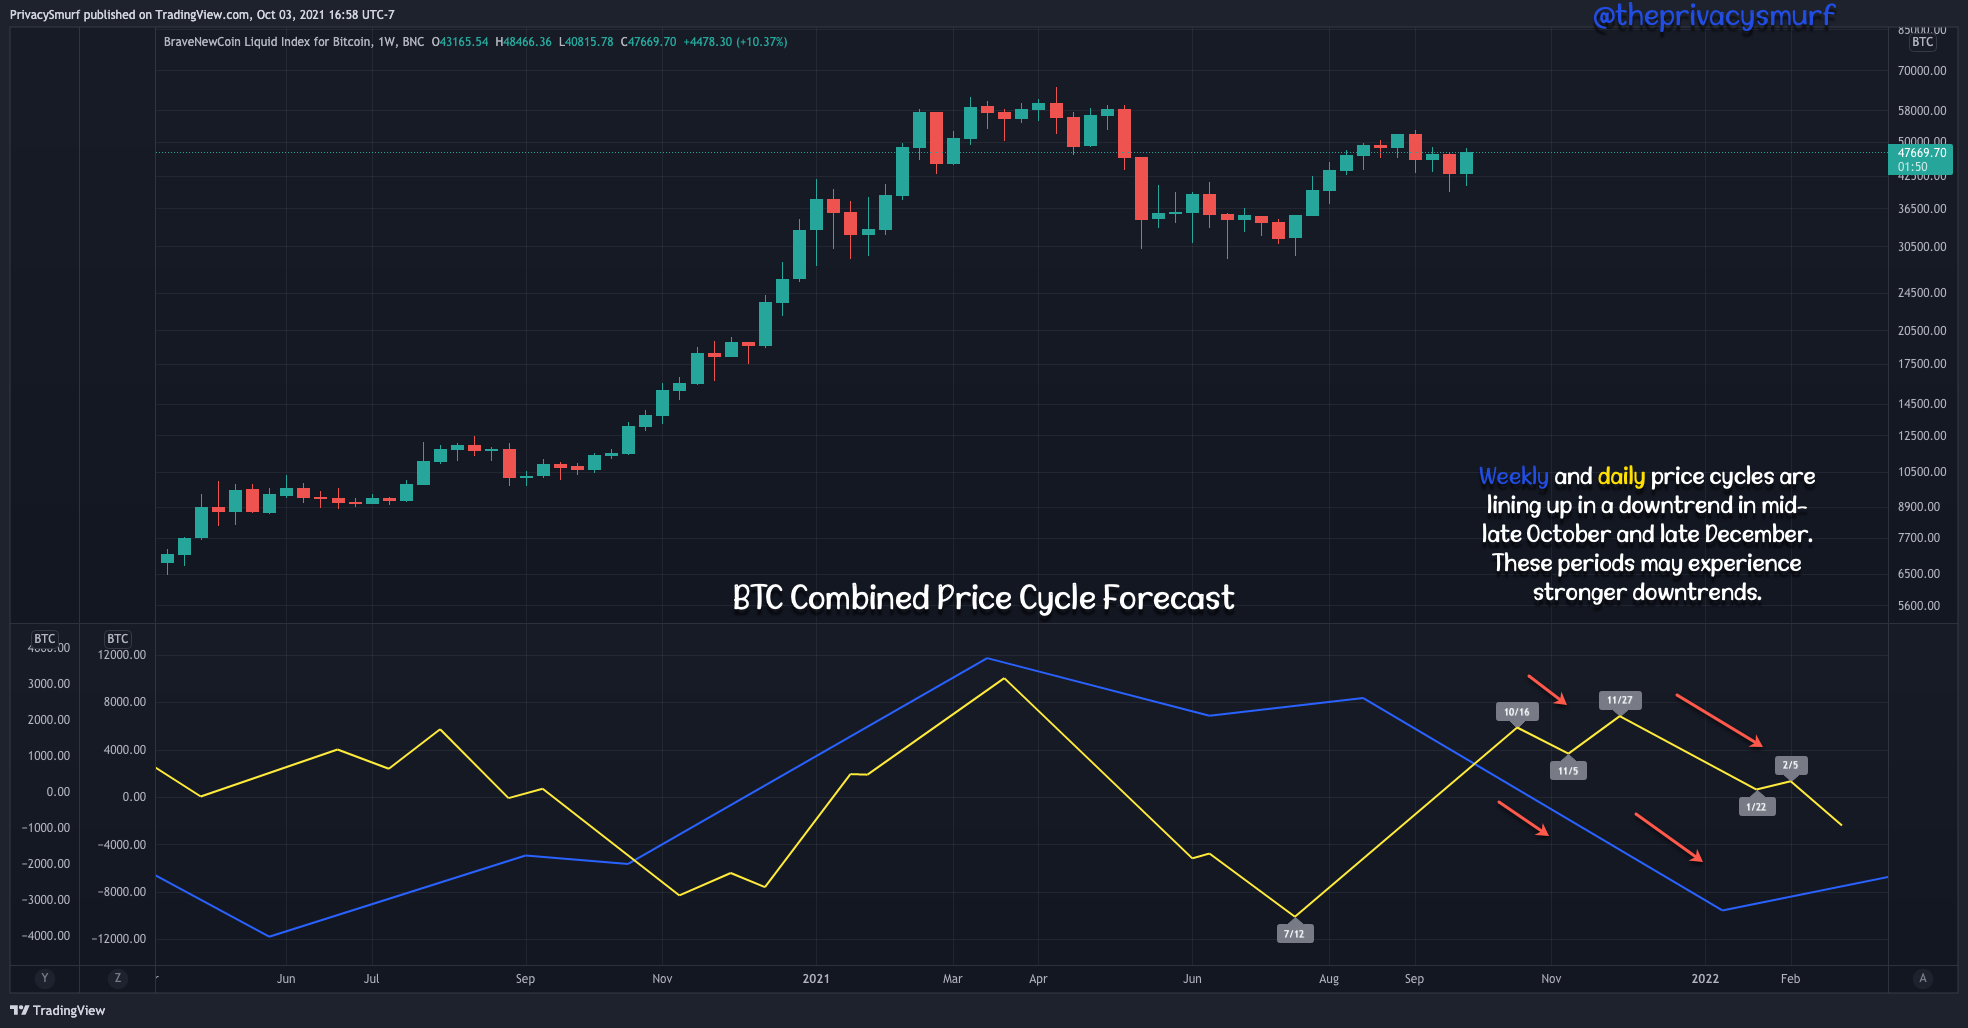
As noted in that post the mid-October peaks and Late November peaks on the daily cycles and price charts aligned with a higher timeframe cyclical downtrend which in a sense helps propel price down. Note the cycles both extend down together into early January. Also, note the bearish divergence signal with all oscillators in agreement on Nov 12 and both targets ($58.5k & 52.8k) both hit successfully.

OK. So that’s enough of my tools. Let’s look at something that others use that I don’t. This one I find pretty interesting.
ColinTalksCrypto Bitcoin Bull Run Index
It combines (and/or independently) analyses a bunch of technical indicators that are regarded as highly reliable indications of where BTC is in its bull/bear “cycle”.
I find most indexes undertilized when they just look at tops and bottoms. The midpoints are very valuable and can be indications of potential price behavior as well.
Looking at the index currently residing at 52 you’d make the assessment we aren’t anywhere near a peak (closer to 100). But plotting out the index there is a clear pattern showing that it’s still defined as a smaller cyclical peak with the downtrend indicating potential extension into February before moving towards another peak sometime in Summer 2022.


I have some more analysis with some Glassnode data looking at wallets and unique active addresses but I still have a bit of work to do on it and I’ll present that separately. I’ll also make a post about cycles again because it’s starting to get to me how much I hear the word popped up and used pretty incorrectly, but here’s a quick refresher.
So many words are used to describe vague sentiments or murky ideas/understandings which is bothersome to me when they already have clear definitions, but whatever. rant and post over.
Now to clear some stuff up.
In this post I’m NOT saying BTC is going down with certainty.
I’m not saying sell out of your positions.
This is objective data (*mostly*, except for the first 2 topics) and back testable strategies that are not perfect.
This is a presentation of technicals to counter popular narratives and bullish hopium.
There is a not insignificant statistical probability of a higher timeframe bearish retracement.
There are also very bullish fundamentals and increasingly bullish smaller timeframe technicals which may invalidate this thesis.
It’s up to every person to evaluate the risks with a clear mind and make a decision on their positions, ideally when there is some sort of confirmation of directionality.
In my opinion, there is not even the hint of confirmation either way until BTC has broken and held outside the $46-$52k price range.
That also doesn’t mean sell out when BTC closes below $46k or take a loan on the house to buy BTC at $52k cuz it’s about to moon.
Side note, if BTC does go down it can just as easily be a 45-degree angle up and to the right for the next year and change afterward.
**Biggest Takeaway**
Be a holder and don’t worry about any of this shit and buy at predetermined price levels when/if you have the cash. If you are a trader always look for ways to validate and invalidate any bullish or bearish thesis and assess the risk and take the most probable trade whichever direction it indicates. Sometimes you’ll be wrong. Sometimes you’ll be right. If you are doing the work and controlling your risk properly you’ll likely end up right much more often than not and be consistently profitable. Then the work becomes beating out the smarter long-term holders during the periods of wholesale drawdown. If you can’t do that during a long period of market bearishness, be real with yourself, stop trading. Work smart with your money, because no one really cares about your portfolio as much you do.
:-p
@theprivacysmurf
P.S. if you do end up being a holder I won’t be disappointed if you don’t read my stuff anymore. I think it’s still valuable though and will help with timing and price levels of interest, but that’s up to you. Either way thanks for being here.
Well written presentation of the data. Thank you! One small correction (I hope it is, at least), you state that the cycle forcasts the next peak to fall out in the Summer of 2023. That should be 2022, right?
Love it, get it and appreciate it.