

Market Update

I apologize for the long intermission. I've had some personal matters to attend to. While I'm sure it felt like the loneliness in my absence seeped 'in your bones,' I promise I kept an eye on things in the market. Despite the last update coming Mar 20th, the market has largely remained unchanged, and an update was unneeded. BTC is less than 1% from the price it was then. ETH has had more movement variation but mostly remained in the same $175 range.
Soon we are entering into a bearish window of alignment in cycles. The potential downside in that context is starting to show up in technical factors, which we'll get into in a minute. Here are the links for the forecast and segments of the live stream review of the forecast. Give them a look so you can get a refresher on those timing windows.
Q2 Forecast
Livestream Replay
BTC/USDT Daily Chart
https://www.tradingview.com/chart/jjSdFW4b/
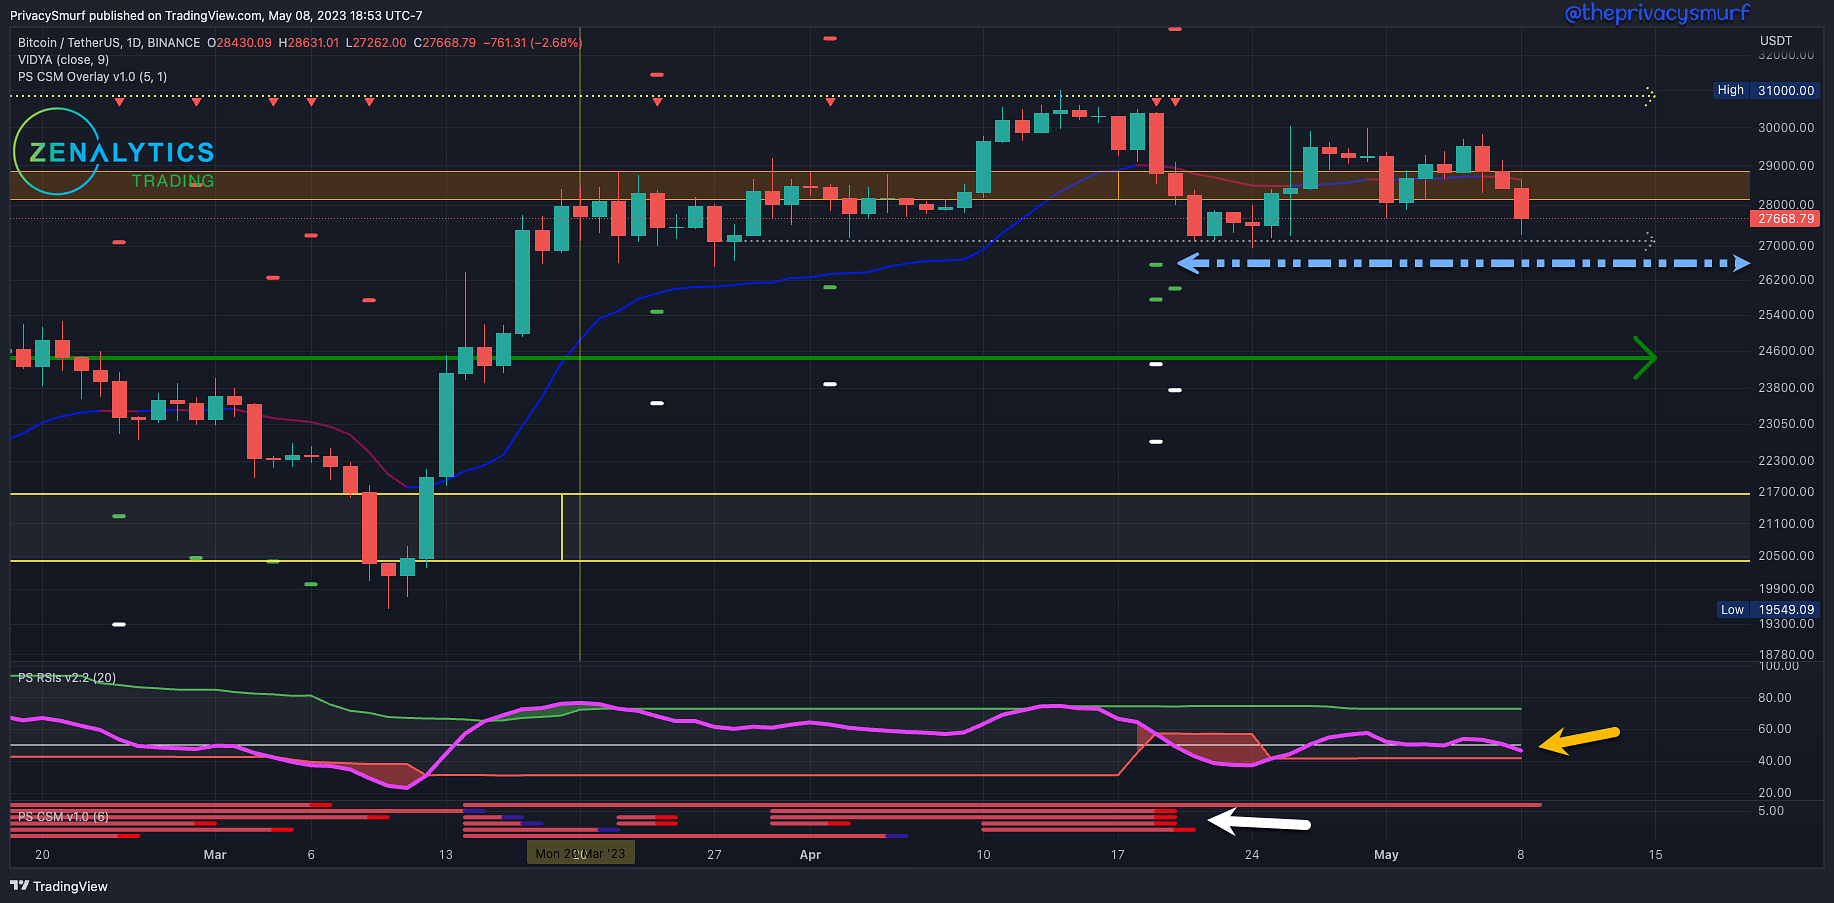
From last week:
I didn't post anything last week for a synopsis but suggestions of the consolidation instead of trending since the beginning of the quarter discussed in the Q2 Forecast Livestream have been on point.
Since the last posting, Bitcoin lacked momentum, with the dotted yellow and gray arrows showing the fluctuating between the proposed ranges of $27k to $31k. Mid-April, my indicator, the Correction Strength Meter (white arrow), triggered a bearish reversal trade with initial targets down towards $26.5k. As of close Monday, the Cyclic RSI (yellow arrow) has crossed below the midline, suggesting a bearish influence on prices. The RSI at the time of writing (Tuesday morning) is crossing below the band. If the day closes with the bottom band being broken by the RSI, that would suggest the possibility of impulsive bearish price action putting the CSM targets in the crosshairs. A daily close below the gray dotted line ($27.1k) would be a new lower-low close and more confluence suggesting a weakening in BTC.
I'll change this next section to reflect my operational thought processes utilizing my trading tools.
Given the week's current technicals:
If I'm not in daily chart BTC Longs:
(Conservative) I'm not opening new longs at this level if the bottom band is broken until the daily chart RSI is back inside the bands. I'd expect the bearish CSM targets to be hit. I'd consider a buy bid at the green support line at $24.6k.
(Risky) I'd consider opening new longs at this level using the 2HR timeframe for a precision entry to the daily chart support bounce. If the 2HR chart shows a bullish reversal trade on the CSM (on most oscillators) with the ideal setup on the Cyclic RSI. However, I'd likely wait for entry when the price action on the 2HR timeframe shows a transition to a bullish structure, meaning a low pivot, a high pivot, a higher low pivot, followed by a higher high pivot.
If I'm in daily chart BTC Longs:
(Conservative) I'm waiting for the confirmation of a lower low close under the support at $27.1K to exit the long, as that would indicate the bullish market structure is gone and may bring lower lows.
(Risky) This exit has since passed and would have occurred at the CSM bearish trigger at resistance on April 19. I'd take the same conservative exit.
If I'm not in daily chart BTC Shorts:
(Conservative) I'm not opening new shorts until the structure has confirmed bearish. Ideally, a daily close occurs below $27.1K. At that point, I'm waiting for a rally on the 2HR timeframe. This rally moving up towards the recently broken level bringing a bearish setup and trade trigger on the CSM, would be the precision entry for the daily chart structure shift. I'd keep a stop loss relatively close using the most recent high pivot point at $29.5k to abandon the short.
(Risky) Suppose the daily chart RSI closes below the bottom adaptive band. In that case, I'd consider front-running a structure shift for a risky short entry with 2HR closes under the support at 27.1k and if all bullish divergences on the CSM become invalidated.
If I'm in daily chart BTC Shorts:
(Conservative) This wouldn't have any considerations as, IMO, conservative exposure isn't warranted yet.
(Risky) If I took the short trade from the CSM on April 19th, I'm still sitting in the position waiting for the first target at around $26.5k, and once hit, I can move my stop loss to breakeven at around $28.8k. (This would have been a risky trade option as the primary daily chart trend and structure were bullish at the time of the trigger.)
ETH/BTC Daily Chart
https://www.tradingview.com/chart/gTkSjkj6/
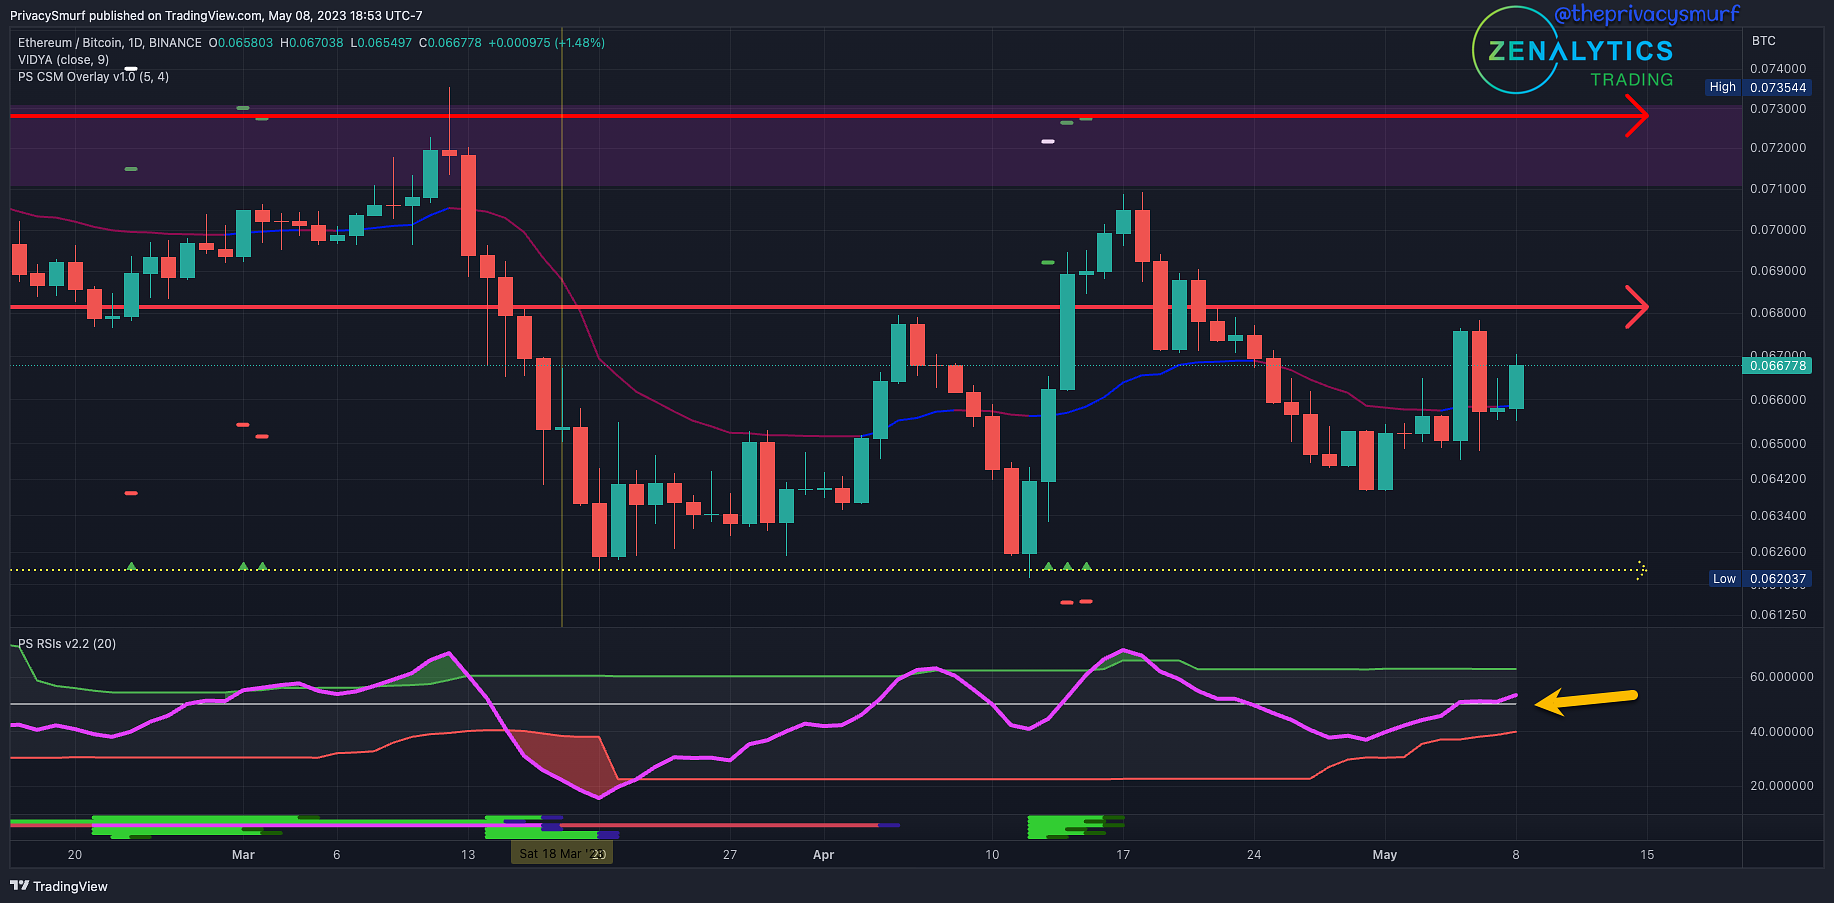
From last week:
I didn't post anything last week for a synopsis but review the Q2 Livestream clip here for some good info.
Since the last posting, the ETH/BTC ratio has been volatile but increasingly bullish in that volatility as the structure has set higher high and higher low pivot points. The bullish reversal trade signaled by the Correction Strength Meter on April 13th has achieved initial targets at just over 0.069. However, the 0.068 level is still proving to be a resistance difficult to remain above. The RSI currently resides above the midline, suggesting a bullish influence on price action. The adaptive bottom band is also adjusting higher and higher. It is important to note that as it would reflect the floor of normal price fluctuations is rising, and potentially breaking down below 0.0642 (if the RSI breaks below the bottom band simultaneously) may lead to impulsive downside action.
Given the week's current technicals:
If I'm not in daily chart ETH/BTC (or altcoin) Longs:
To execute these entries, I'm either rotating BTC to ETH OR buying ETH to sell back to BTC later OR buying an alt with a similar chart structure to sell back to BTC later.
(Conservative) I'm not opening new longs at this level as prices are under resistance. Ideally, a daily close comes in above 0.068. At that point, a retracement on the 2HR timeframe leading to a bullish reversal trade trigger on the CSM would be a precision entry for the daily chart breakout of the 0.068 level. I'd use the 2HR CSM stoploss to negate the trade idea, as this is a conservative approach, and I'm not willing to take on a full stop down to the most recent daily chart pivot point around 0.0642.
(Risky) I'd consider opening new longs for the breakout using the 2HR timeframe if bearish divergences are invalidated while prices maintain closes above 0.068. I'd be evaluating the failure of the support structure on the 2HR timeframe (at the moment, around 0.0654) to consider abandoning the trade idea. This level may be higher depending on how higher lows develop over the week and my risk appetite.
If I'm in daily chart ETH/BTC (or altcoin) Longs:
(Conservative) The CSM bullish trade signal on April 13 would have led to a conservative after prices closed above the 0.068 resistance while setting a new higher high close. This position, however, is sitting underwater at the moment. The approach would be to remain in the position until daily closes come in under the support at 0.062, suggesting that lower values are on the table. At that point I'd rotate back to BTC.
(Risky) This exit has since passed. While the position would still be positive, I'd need to consider whether I want to hold the open positions or take my profits to start from a clean slate. There'd be no new risky long exposures for me as the resistance at 0.068 held, and I'd be waiting for the market to create a new opportunity. The initial trade signal on the CSM being the risky entry would have achieved initial targets, taking some profits while closing the remains at breakeven at 0.0662 on April 25th. This would be considered a risky entry as the trend and structure were bearish, and the entry came at a location directly in the middle of support and resistance.
If I'm not in daily chart ETH/BTC (or altcoin) Shorts:
(Conservative) I'm not considering a rotation back to BTC or alt shorts until the structure at 0.062 has some daily closes under the support. The advantageous time for these moves has already passed.
(Risky) Suppose the daily chart RSI closes below the bottom adaptive band. In that case, I'd consider front-running a short-term dump and risky altcoin short entries with 2HR bearish CSM trade triggers or loss of support structure on the 2HR timeframe while the daily RSI is measuring below the bottom band.
If I'm in daily chart ETH/BTC (or altcoin) Shorts:
(Conservative) I'd be looking to cut out of any shorts taken while ETH/BTC was above 0.068 once daily closes start appearing there again. With the RSI above the midline, there's the suggestion of bullish influence, and ideal exits would have been from 0.062 to 0.064.
(Risky) Suppose I took the short trade on April 18th from the 2HR to create a daily chart precision entry using the CSM while prices flirted above 0.068 resistance (entry around 0.0696). In that case, I'd abandon that trade idea with a daily close above that April 18 pivot point around 0.071. Targets would still be in the same 0.062 to 0.064 zone as the conservative entry and haven't been achieved yet.
ETH/USDT Daily Chart
https://www.tradingview.com/chart/xbB6lkZu/
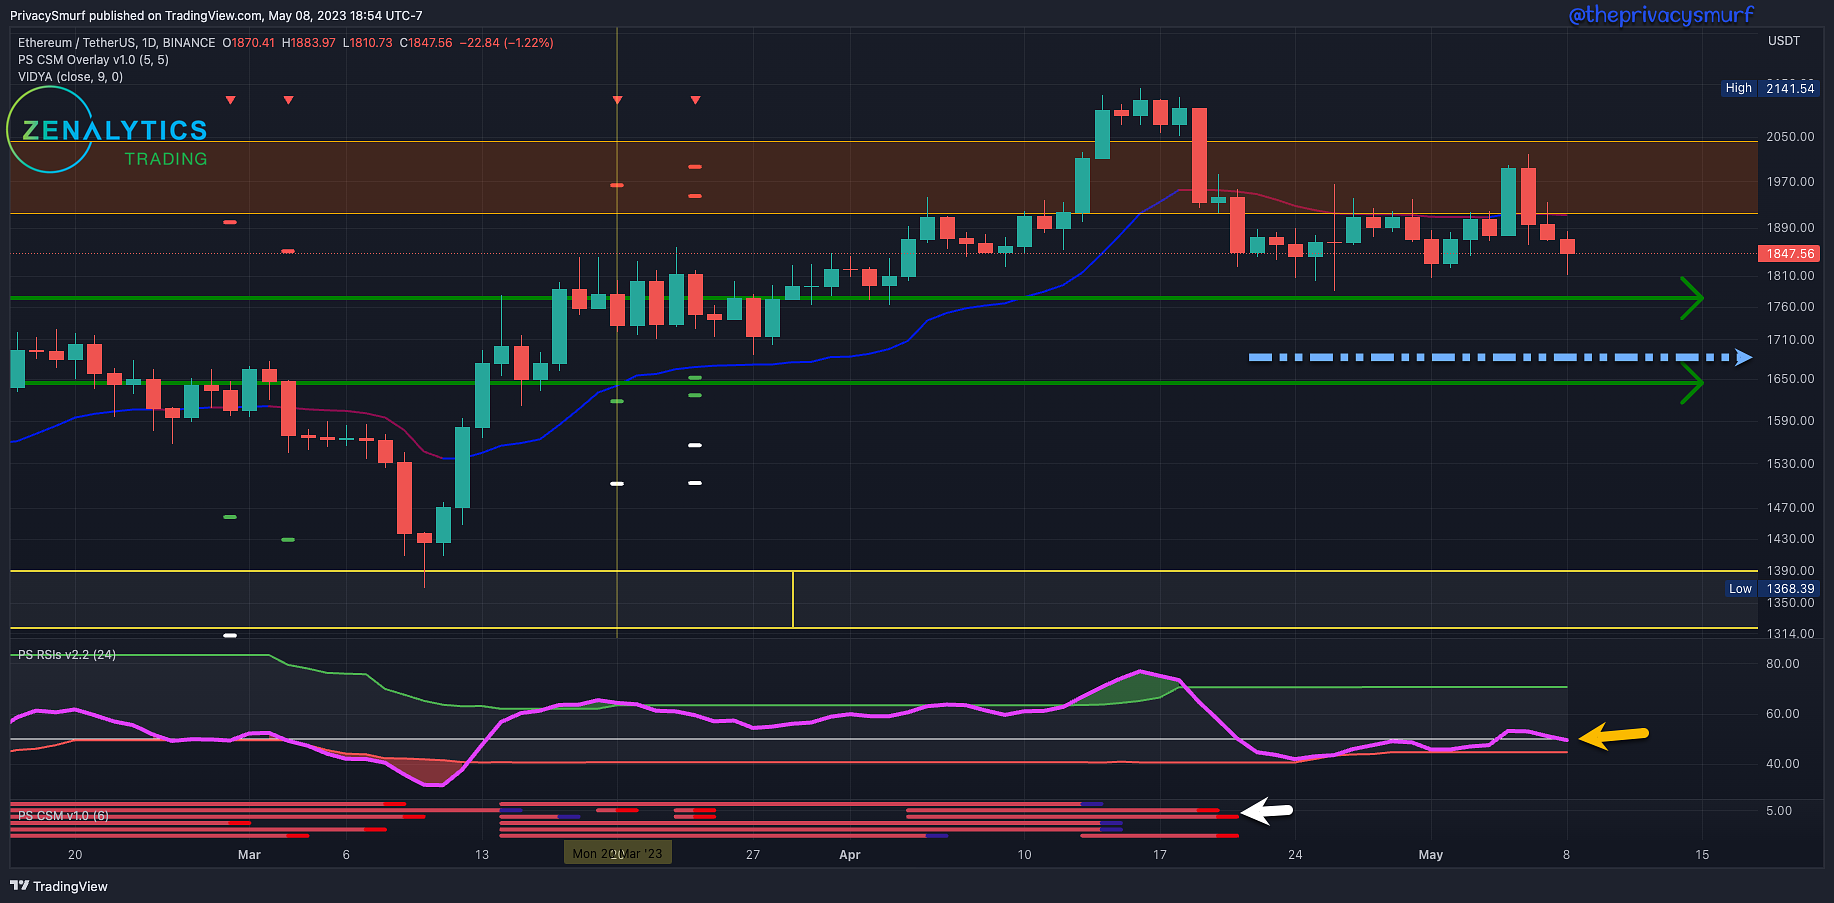
From last week:
I didn't post anything last week for a synopsis.
Since the last posting, ETH has shown bullish momentum and flashes of strength, invalidating some bearish divergences on the CSM (white arrow) shown by the dark blue dashes at the end of the red lines. That bullishness was rejected, though, and since the RSI (yellow arrow) closed back inside the bands on April 19th, there's been little to show in bullish trending behavior. The RSI currently is measuring below the midline, suggesting a bearish influence on prices, and is flirting with a cross below the bottom adaptive band. If that occurs, I'd expect impulsive bearish price action. The historical support structure may hold prices at around $1780 and $1650. The light blue dashed line shows the initial price targets for the single CSM bearish trade trigger. That may be reached if the bottom band is broken on the RSI, but I typically operate when more oscillators are in confluence.
Given the week's current technicals:
If I'm not in daily chart ETH Longs:
(Conservative) I'm not opening new longs at this level if the bottom band is broken until the daily chart RSI is back inside the bands. I'd expect the bearish CSM target to be hit. I'd consider a buy bid at the bottom green support line at $1650.
(Risky) I'd consider opening new longs at the $1780 level using the 2HR timeframe for a precision entry to the daily chart support bounce. If the 2HR chart shows a bullish reversal trade on the CSM (on most oscillators) with the ideal setup on the Cyclic RSI. However, I'd likely wait for entry when the price action on the 2HR timeframe shows a transition to a bullish structure, meaning a low pivot, a high pivot, a higher low pivot, followed by a higher high pivot.
If I'm in daily chart ETH Longs:
(Conservative) I'm waiting for the confirmation of a lower low close under the support at $1780 to exit the long, as that would indicate the bullish market structure is gone and may bring lower lows.
(Risky) This exit has since passed and would have occurred with the RSI curling back into the bands and the dump on April 19. Otherwise, I'd take the same conservative exit.
If I'm not in daily chart ETH Shorts:
(Conservative) I'm not opening new shorts until the structure has confirmed bearish. Ideally, a daily close occurs below $1780. At that point, I'm waiting for a rally on the 2HR timeframe. This rally moving up towards the recently broken level bringing a bearish setup and trade trigger on the CSM, would be the precision entry for the daily chart structure shift. I'd keep a stop loss relatively close, drawing a resistance line around 1920. This level has historically kept bullish price action at bay. A daily close above that recently has led to bullish spurts that I'd not want my short exposed to as it could also quickly lead to ETH into new 52-week highs.
(Risky) Suppose the daily chart RSI closes below the bottom adaptive band. In that case, I'd consider front-running a structure shift for a risky short entry with 2HR closes under the support at 1780 and if all bullish divergences on the CSM become invalidated.
If I'm in daily chart ETH Shorts:
(Conservative) This wouldn't have any considerations as, IMO, conservative exposure isn't warranted yet.
(Risky) If I took the short trade from RSI, indicating a potential bullish price ceiling on April 19th, I'm still sitting in the position, waiting for a test of the 1780 support to take some profits. This would have been a risky trade option as the primary daily chart trend and structure were bullish and required a smaller timeframe entry signal.
See you soon.
@theprivaysmurf