

Market Update #75: Steal My Sunshine
Market Update #75: Steal My Sunshine
I was lying on the grass on Sunday morning of last week

We are entering into a bearish window of alignment in cycles. The potential downside in that context is shown in multiple charts. Here are the links for the Q2 forecast and segments of the live stream review of the forecast. Give them a look so you can get a refresher on those timing windows.
Q2 Forecast
Livestream Replay
I've modified the portion giving my weekly expectations. Commentary following the "Given the week's current technicals:" reflects my operational thought processes utilizing my trading tools in the context of the daily chart. It is how I would assess taking action or not, depending on my current positioning.
We are finally getting some consistently warm sunny weather up in the PNW. The garden is digging it, and the lady and I finally got out for some paddleboarding. Hope it lasts longer cuz 'I know it's up for me
if you steal my sunshine.'
BTC/USDT Daily Chart
https://www.tradingview.com/chart/jjSdFW4b/
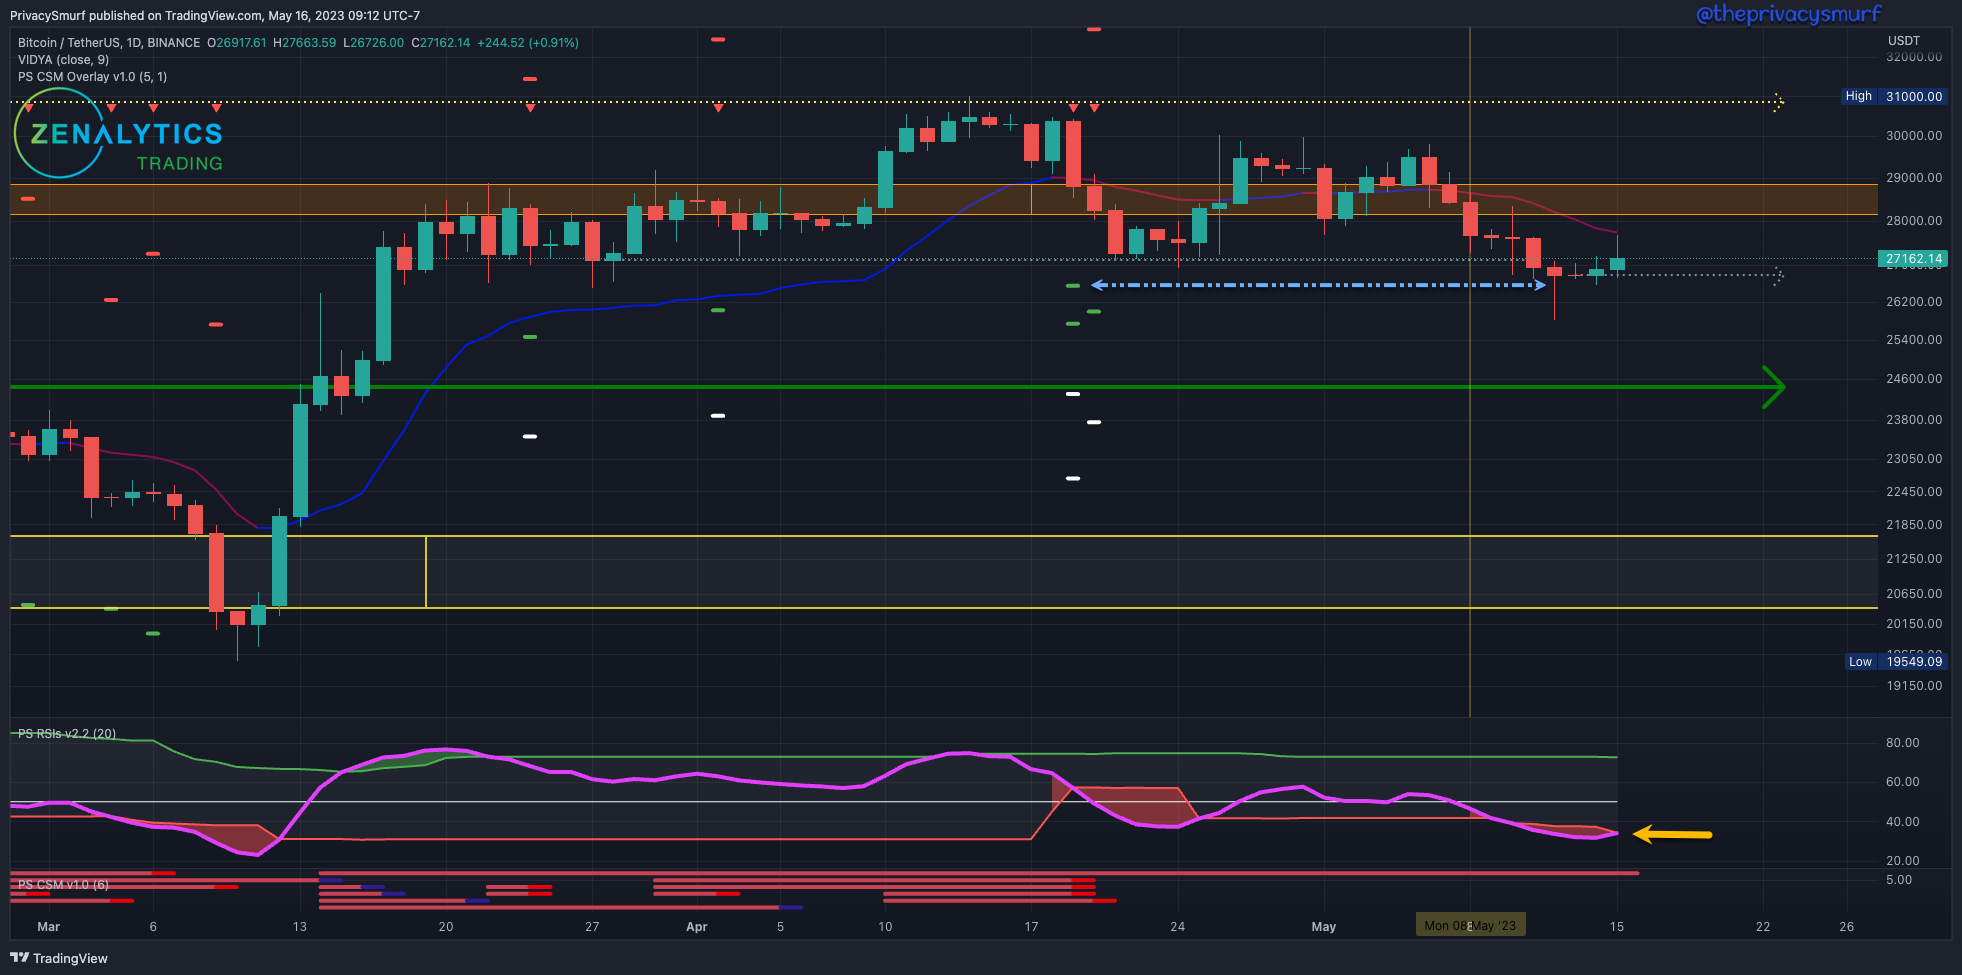
From last week:
"... If the day closes with the bottom band being broken by the RSI, that would suggest the possibility of impulsive bearish price action... I'm not opening new longs... expect the bearish CSM targets to be hit..."
Since the last week, the bearish momentum continued, with the RSI (yellow arrow) breaking and closing below the adaptive bottom band. As expected, the bearish prices continued, and the trade targets signaled by the CSM on April 19th were hit on Friday and closed below the loose structure at $27.1k, invalidating this level. At the time of writing (Tuesday morning), the RSI begins to curl back up between the adaptive bands. This may suggest that a potential floor is forming at around 26.7k (grey dotted line). Monitoring the RSI for the following days will determine whether that floor will remain. If the RSI breaches the adaptive bottom band again, this level will be invalidated, and downside price continuation would be expected.
Given the week's current technicals:
If I'm not in daily chart BTC Longs:
(Conservative) I'm not opening new longs at this level, as the bottom band of the RSI is broken. Until the daily chart RSI is back inside the bands, I am not entertaining the idea of a new position. Once there are daily closes with the RSI in the band, I'd be looking for structure to shift to a bullish profile with higher lows and higher highs. Outside of technical factors, I'd consider a buy bid at the green support line at $24.6k.
(Risky) I'd consider opening new longs at this level using the 2HR timeframe for a precision entry to the daily chart support bounce. If the 2HR chart shows a bullish reversal trade on the CSM (on most oscillators) with the ideal setup on the Cyclic RSI. There have been two batches of setups and triggers on the CSM on the 2HR timeframe since last week. Still, each group has had invalidations of the bullish divergences, which would suggest more downside on that timeframe, so the timing for a risky entry is still a waiting game. On a 2HR CSM bullish trade trigger with no invalidations, I'd likely wait for entry when the price action shows a transition to a bullish structure, meaning a low pivot, a high pivot, a higher low pivot, followed by a higher high pivot.
If I'm in daily chart BTC Longs:
(Conservative) With a lower low close finally coming in under the support at $27.1K on May 11, I'd exit longs, indicating the bullish market structure is gone and may bring lower lows.
(Risky) This exit has since passed and would have occurred at the CSM bearish trigger at resistance on April 19. I'd take the same conservative exit.
If I'm not in daily chart BTC Shorts:
(Conservative) I'm not opening new shorts until the structure has confirmed bearish. A daily close has occurred below $27.1K. Now, I'd be waiting for a rally on the 2HR timeframe. A rally moving up, extending towards $28K, bringing a bearish setup and trade trigger on the CSM, would be the precision entry for the daily chart structure shift. I'd keep a stop loss relatively close using the most recent high pivot point at $29.5k to abandon the short.
(Risky) With a daily close under $27.1K and invalidation of bullish divergences on the CSM on the 2HR timeframe, a risky short position would be on from the evening on May 11 at around $26.6K.
If I'm in daily chart BTC Shorts:
(Conservative) This wouldn't have any considerations as, IMO, conservative exposure isn't warranted yet.
(Risky) If I took the short trade from the CSM on May 11, I'd use the initial targets of the 2HR CSM triggers that day to invalidate this risky trade idea, meaning a daily close above $28.5K, and I'd cut out and wait for a new 2HR bearish entry signal. I'd set limit orders in a region around the lower support at $24.6K to $25.5K to take initial profits and $22.5K for secondary profits.
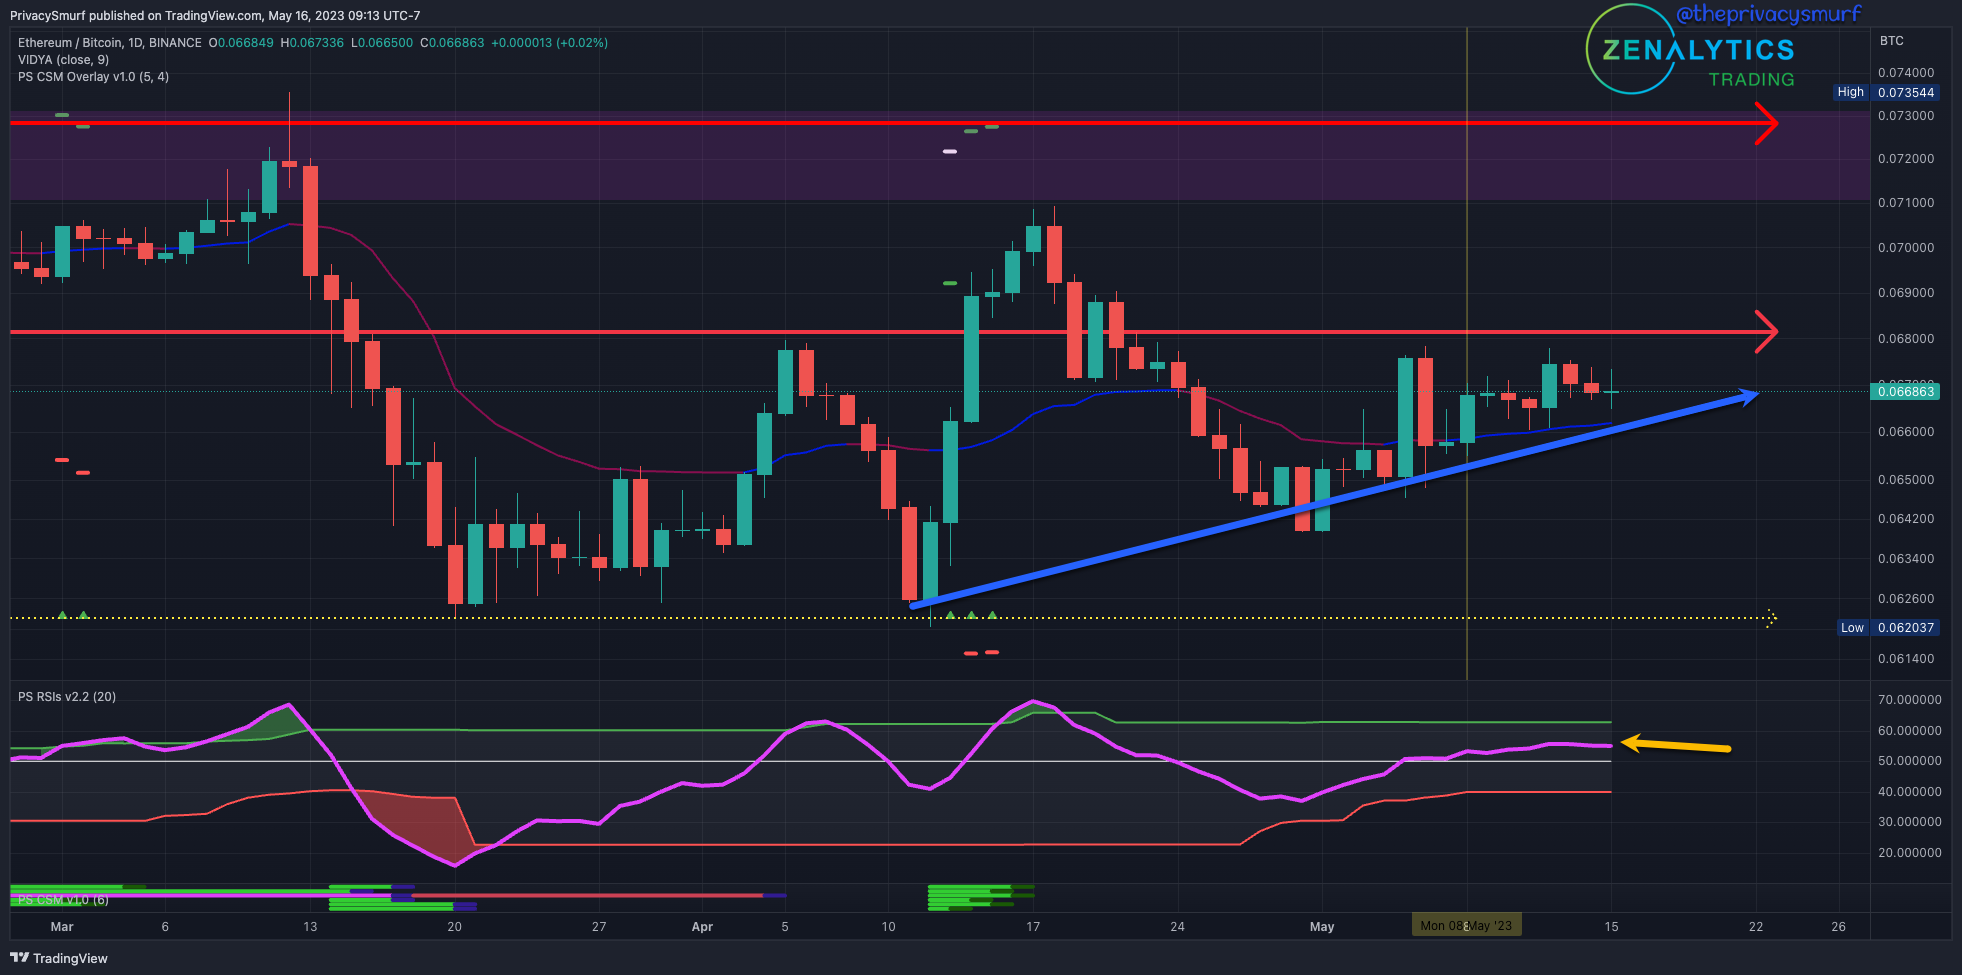
ETH/BTC Daily Chart
https://www.tradingview.com/chart/gTkSjkj6/
From last week:
"... RSI currently resides above the midline, suggesting a bullish influence on price action... review the Q2 Livestream clip here for some good info.
"
Since the last week, the ETH/BTC ratio has maintained bullish pressure but has started consolidating tighter and tighter under the 0.068 level illustrated by the rising blue arrow. The RSI (yellow arrow) remains above the midline, suggesting a bullish influence on price action. A breach above the adaptive top band would suggest bullish price continuation and likely a flash above the 0.068 resistance. A breakdown from the midline, and I'd expect the rising pattern of lows to be broken and the chart to descend again towards the middle of the range around 0.065.
Given the week's current technicals:
To execute these entries:
For longs, I'm rotating BTC to ETH OR
buying ETH to sell back to BTC OR
buying an alt with a similar ALT/BTC chart to sell back to BTC.
For shorts, I'm selling out to BTC or USDT.
If I'm not in daily chart ETH/BTC (or altcoin) Longs:
(Conservative) I'm not opening new longs at this level as prices are under resistance. Ideally, a daily close comes in above 0.068. At that point, a retracement on the 2HR timeframe leading to a bullish reversal trade trigger on the CSM would be a precision entry for the daily chart breakout of the 0.068 level. I'd use the 2HR CSM stop-loss to negate the trade idea, as this is a conservative approach, and I'm not willing to take on a full stop down to the most recent daily chart pivot point around 0.0642.
(Risky) I'd consider opening new longs for the breakout using the 2HR timeframe if bearish divergences are invalidated while prices maintain closes above 0.068. I'd be evaluating the failure of the support structure on the 2HR timeframe (at the moment, around 0.0654) to consider abandoning the trade idea. This level may be higher depending on how higher lows develop over the week and my risk appetite.
If I'm in daily chart ETH/BTC (or altcoin) Longs:
(Conservative) The CSM bullish trade signal on April 13 would have led to a conservative entry after prices closed above the 0.068 resistance while setting a new higher high close. This position, however, is sitting underwater at the moment. The approach would be to remain in the position until daily closes come in under the support at 0.062, suggesting that lower values are on the table. At that point, I'd rotate back to BTC.
(Risky) This exit has since passed. While the position would still be positive, I'd need to consider whether I want to hold the open positions or take my profits to start from a clean slate. There'd be no new risky long exposures for me as the resistance at 0.068 holds above prices, and I'd be waiting for the market to create a new opportunity. The initial trade signal on the CSM being the risky entry would have achieved initial targets, taking some profits while closing the remains at breakeven at 0.0662 on April 25th. This would be considered a risky entry as the trend and structure were bearish, and the entry came at a location directly in the middle of support and resistance.
If I'm not in daily chart ETH/BTC (or altcoin) Shorts:
(Conservative) I'm not considering a rotation back to BTC or alt shorts until the structure at 0.062 has some daily closes under the support. The advantageous time for these moves has already passed.
(Risky) Suppose the daily chart RSI closes below the bottom adaptive band. In that case, I'd consider front-running a short-term dump and risky altcoin short entries with 2HR bearish CSM trade triggers or loss of support structure on the 2HR timeframe while the daily RSI is measuring below the bottom band. An alternative risky option would be the price chart at the 0.068 resistance and a 2HR chart bearish CSM trade trigger with the RSI positioned to cross below the midline and bottom adaptive band OR the 2HR chart breaking down from the wedge formation with 2HR chart bullish CSM trade setups being invalidated.
If I'm in daily chart ETH/BTC (or altcoin) Shorts:
(Conservative) I'd be looking to cut out of any shorts taken while ETH/BTC was above 0.068 once daily closes start appearing there again. With the RSI above the midline, there's the suggestion of bullish influence, and ideal exits would have been from 0.062 to 0.064.
(Risky) Suppose I took the short trade on April 18th from the 2HR to create a daily chart precision entry using the CSM while prices flirted above 0.068 resistance (entry around 0.0696). In that case, I'd abandon that trade idea with a daily close above that April 18 pivot point around 0.071. Targets would still be in the same 0.062 to 0.064 zone as the conservative entry and haven't been achieved yet.
On a side note, the Q2 forecast timing remains the primary model, but updated models show the potential for an earlier ETH/BTC and ETH cyclical rally.
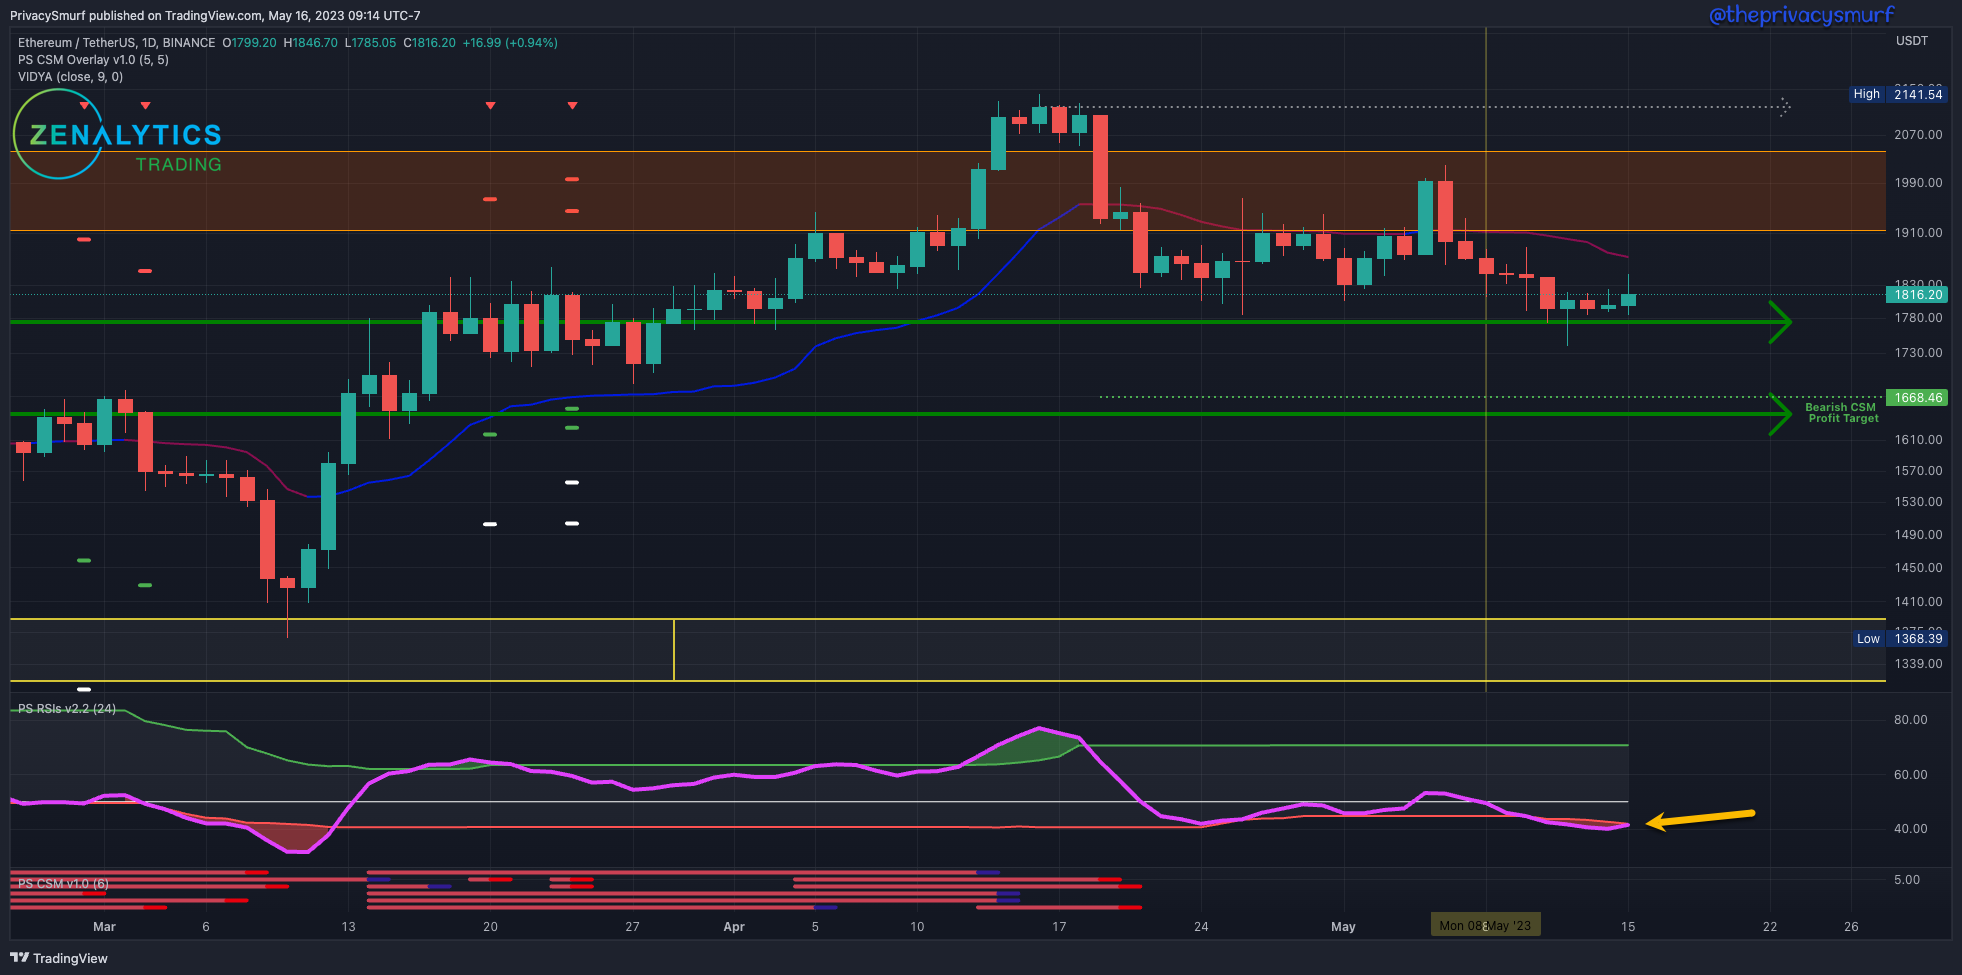
ETH/USDT Daily Chart
https://www.tradingview.com/chart/xbB6lkZu/
From last week:
"... RSI currently is measuring below the midline, suggesting a bearish influence on prices... expect impulsive bearish price action... historical support structure may hold prices at around $1780..."
Since the last week, the bearish momentum continued, with the RSI (yellow arrow) breaking and closing below the adaptive bottom band. As expected, the bearish prices continued, and as expected, despite the bearishness, the support structure at 1780 held closing prices above. At the time of writing (Tuesday morning), the RSI begins to curl back up between the adaptive bands. This may suggest a potential floor forming at around $1794. Monitoring the RSI for the following days will determine whether that floor will remain. Suppose the RSI breaches the adaptive bottom band again. In that case, this level will be invalidated, and downside price continuation would be expected to likely break below the 1780 support and some daily closes below.
Given the week's current technicals:
If I'm not in daily chart ETH Longs:
(Conservative) I'm not opening new longs at this level, as the bottom band of the RSI is broken. Until the daily chart RSI is back inside the bands, I am not entertaining the idea of a new position. Once there are daily closes with the RSI in the band, I'd be looking for structure to shift to a bullish profile with higher lows and higher highs. Outside of technical factors, I'd consider a buy bid at the green support line at $1650.
(Risky) I'd consider opening new longs at this level using the 2HR timeframe for a precision entry to the daily chart support bounce. If the 2HR chart shows a bullish reversal trade on the CSM (on most oscillators) with the ideal setup on the Cyclic RSI. There have been two batches of setups and triggers on the CSM on the 2HR timeframe since last week. Still, each group has had invalidations of the bullish divergences, which would suggest more downside on that timeframe, so the timing for a risky entry is still a waiting game. On a 2HR CSM bullish trade trigger with no invalidations, I'd likely wait for entry when the price action shows a transition to a bullish structure, meaning a low pivot, a high pivot, a higher low pivot, followed by a higher high pivot.
If I'm in daily chart ETH Longs:
(Conservative) I'm waiting for the confirmation of a lower low close under the support at $1780 to exit the long, as that would indicate the bullish market structure is gone and may bring lower lows.
(Risky) This exit has since passed and would have occurred with the RSI curling back into the bands and the dump on April 19. Otherwise, I'd take the same conservative exit.
If I'm not in daily chart ETH Shorts:
(Conservative) I'm not opening new shorts until the structure has confirmed bearish. Ideally, a daily close occurs below $1780. At that point, I'm waiting for a rally on the 2HR timeframe. This rally moving up towards the recently broken level bringing a bearish setup and trade trigger on the CSM, would be the precision entry for the daily chart structure shift. I'd keep a stop loss relatively close, drawing a resistance line around 1920. This level has historically kept bullish price action at bay. A daily close above that recently has led to bullish spurts that I'd not want my short exposed to as it could also quickly lead to ETH into new 52-week highs.
(Risky) Suppose the daily chart RSI closes below the bottom adaptive band. In that case, I'd consider front-running a structure shift for a risky short entry with 2HR closes under the support at 1780 and if ALL bullish divergences on the CSM become invalidated.
If I'm in daily chart ETH Shorts:
(Conservative) This wouldn't have any considerations as, IMO, conservative exposure isn't warranted yet.
(Risky) If I took the short trade from RSI, indicating a potential bullish price ceiling on April 19th, initial profits would have been taken at the hitting of $1780 support, and the stop loss would be moved to breakeven at $1933. Secondary profit targets would be the CSM designated profit target at $1668.
Have a great week!
@theprivaysmurf