Micro Monday #1

Micro Monday will be an intraday timeframe look at BTC, ETH, and maybe a select ALT or two. It’s not going to be designed to direct your trades on these specific assets through the week but more to demonstrate how to create a micro picture with support and resistance and various oscillators. I’ll also talk about how my biases are formed and various simple and stock methods to employ in your intraday trading.
This newsletter subset will be posted on Mondays and is only available for paid subscribers. If all that sounds advantageous to you consider the paid subscription.
I know not everyone trades BTC but you should pay attention to what BTC is doing most of the time. BTC is the honey badger of the cryptosphere, and if you didn't know…

Honey Badger doesn’t give a f*ck.
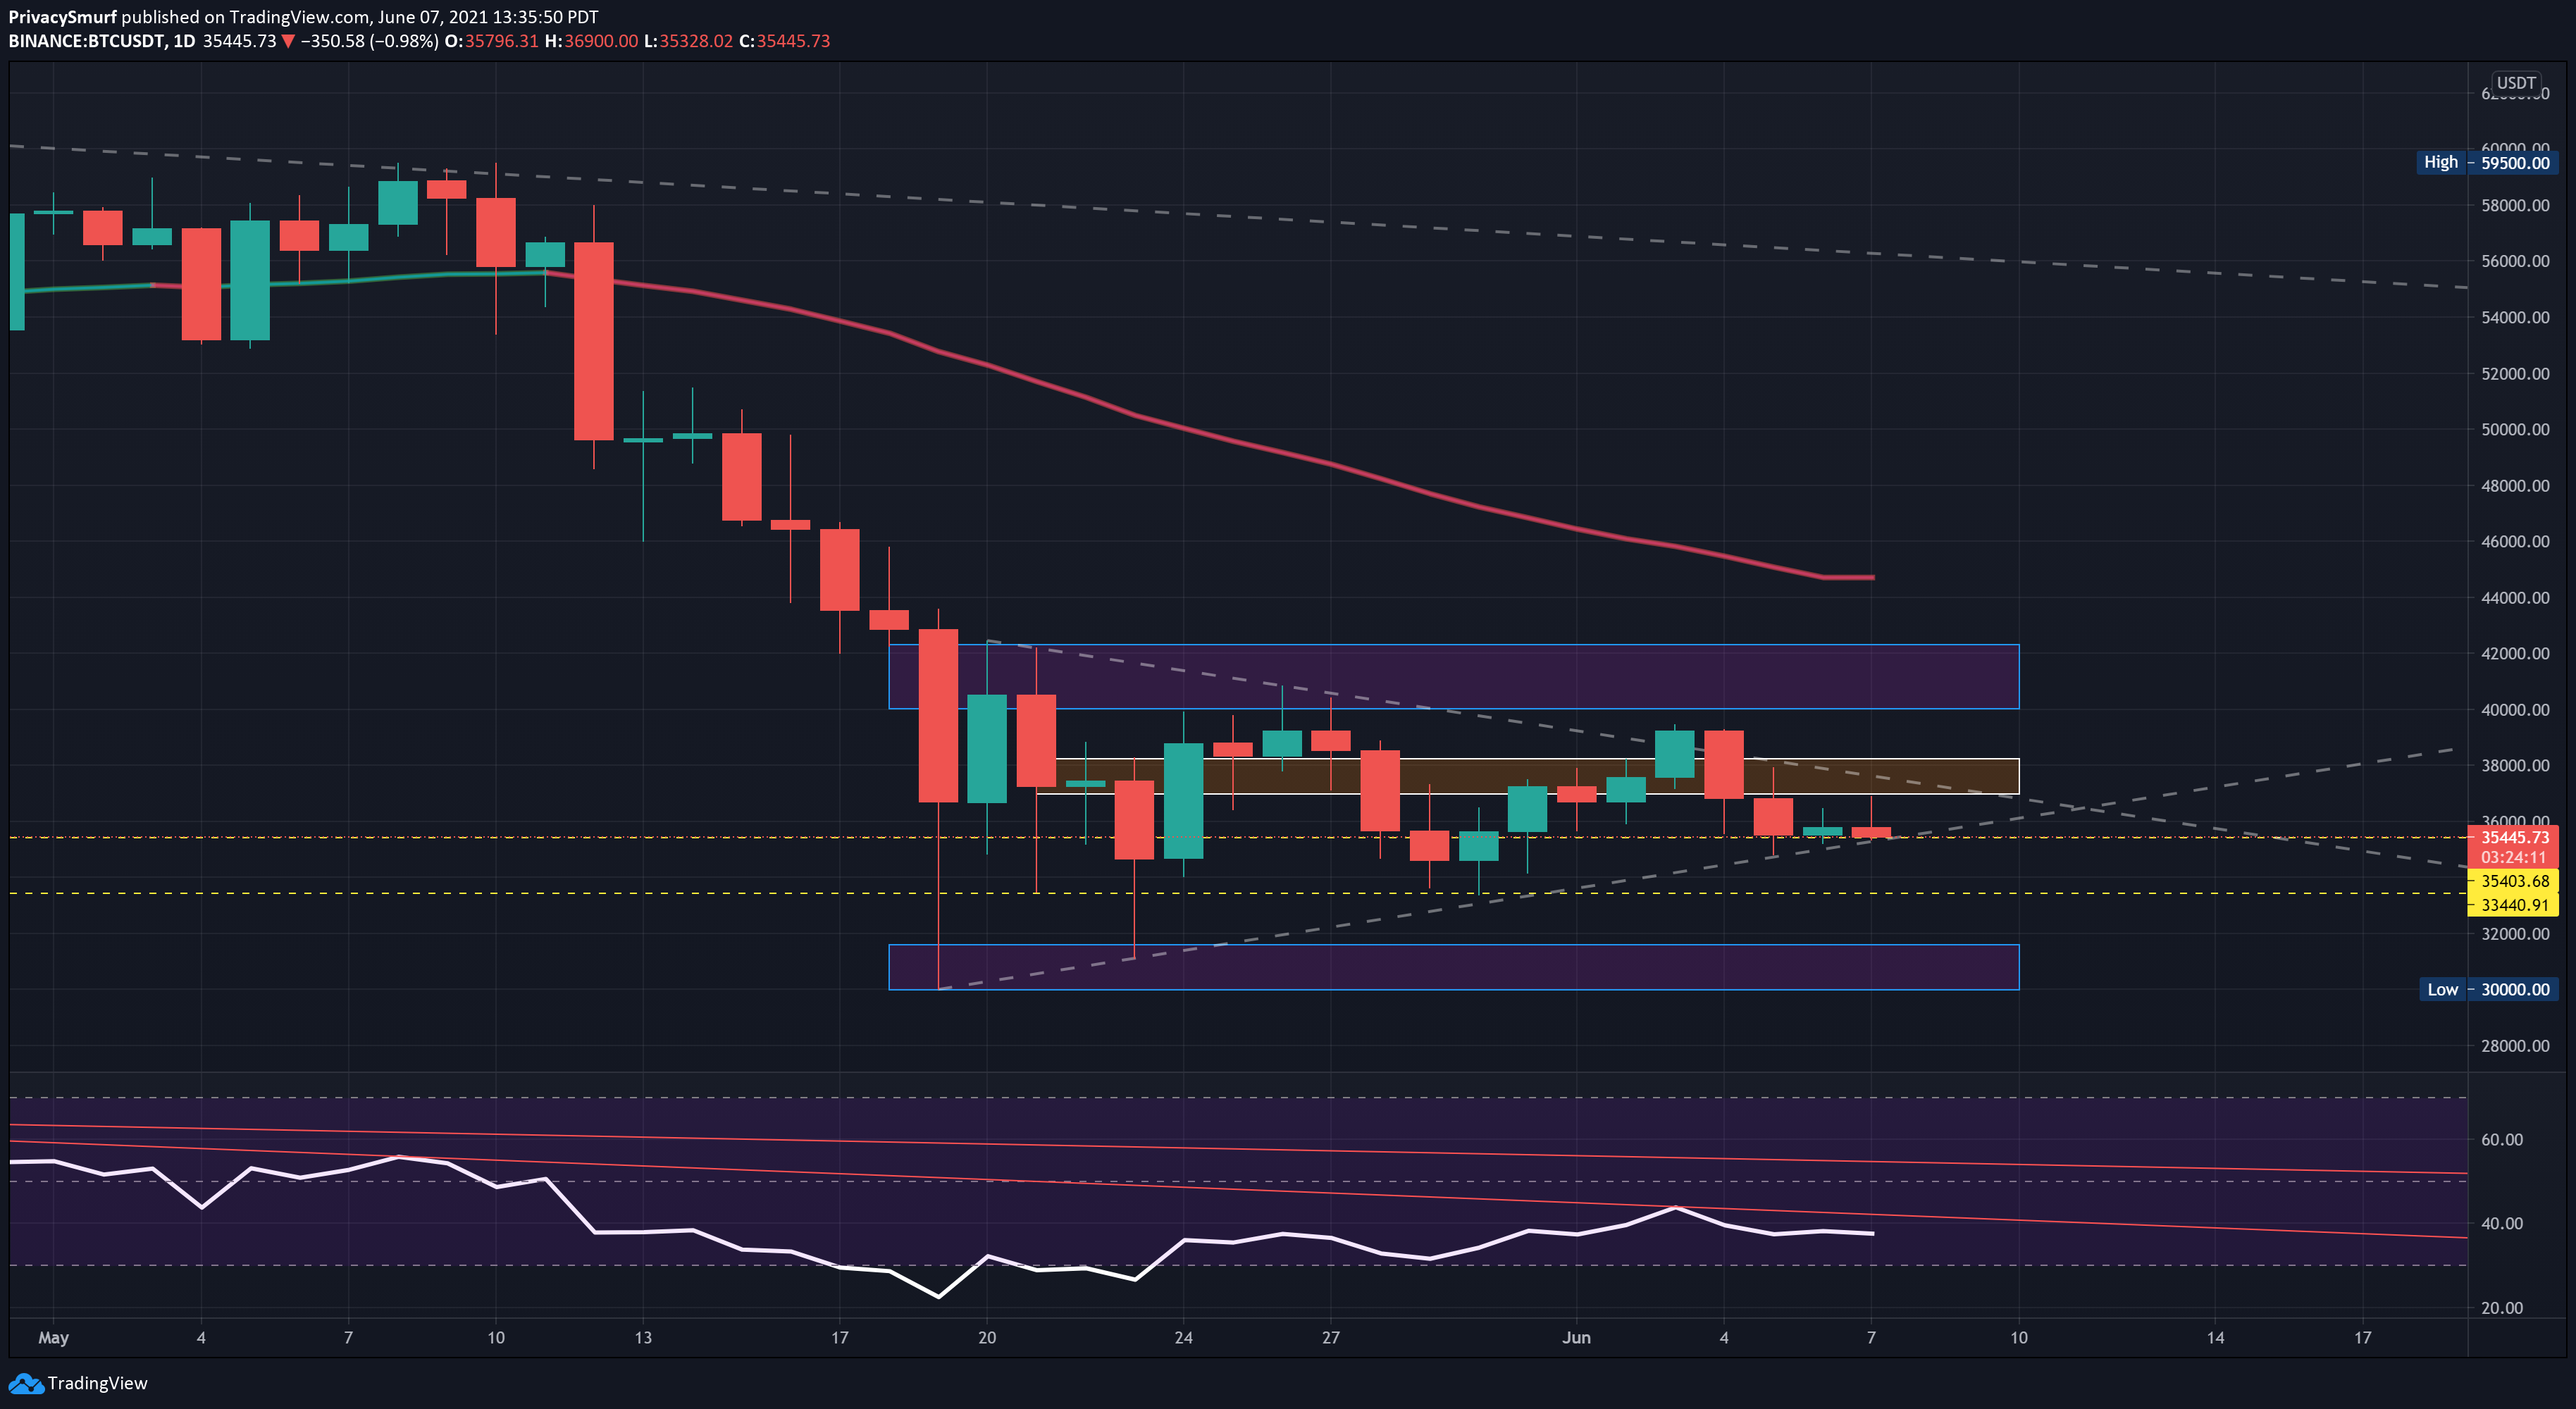
BTC on the daily chart is set up in a consolidation pattern caught between the ascending and descending trendlines with a bearish reading on the RSI. That’s not a wonderful setup for trades open longer than 24hrs. The down trending RSI under the midline gives me a slightly bearish bias. The two rectangular boxes are the extremes of range and represent areas of value for intermediate-term positions. I’d expect plenty of buyers at the bottom and plenty of sellers at the top. the smaller middle rectangle is a pocket of high volume. Trades are getting hung up there. For this timeframe, I’d be waiting for a break of the triangle and a retest for confirmation of directionality. Just a waiting game.
The 4hr chart shows price trading under the 50 period EMA, a bearish signal. The RSI is having issues breaking above the midline, a bearish signal. I’d be very hesitant to take a long trade here. Upwards potential would be limited to the resistance at the EMA.

Dropping down to the 1HR there’s another bearish up. Failure 3 times to hold above the 50 period EMA and RSI under the midline. Again there’d be a lot of hesitation to enter long trades here. Profit would be limited to the resistance at the EMA.

Takeaway: I’d not be trading any longs. I’m anticipating bearish price action with potential supports around 34.8k, 34.2k, and more firm support at 33.4k. A dip to the lower support would probably put the RSI into oversold territory and lead to a brief rally. Watching for bullish candle patterns on the 5m, 10m, or 15m chart could lead to some good scalp trades if they appear at support/resistance.
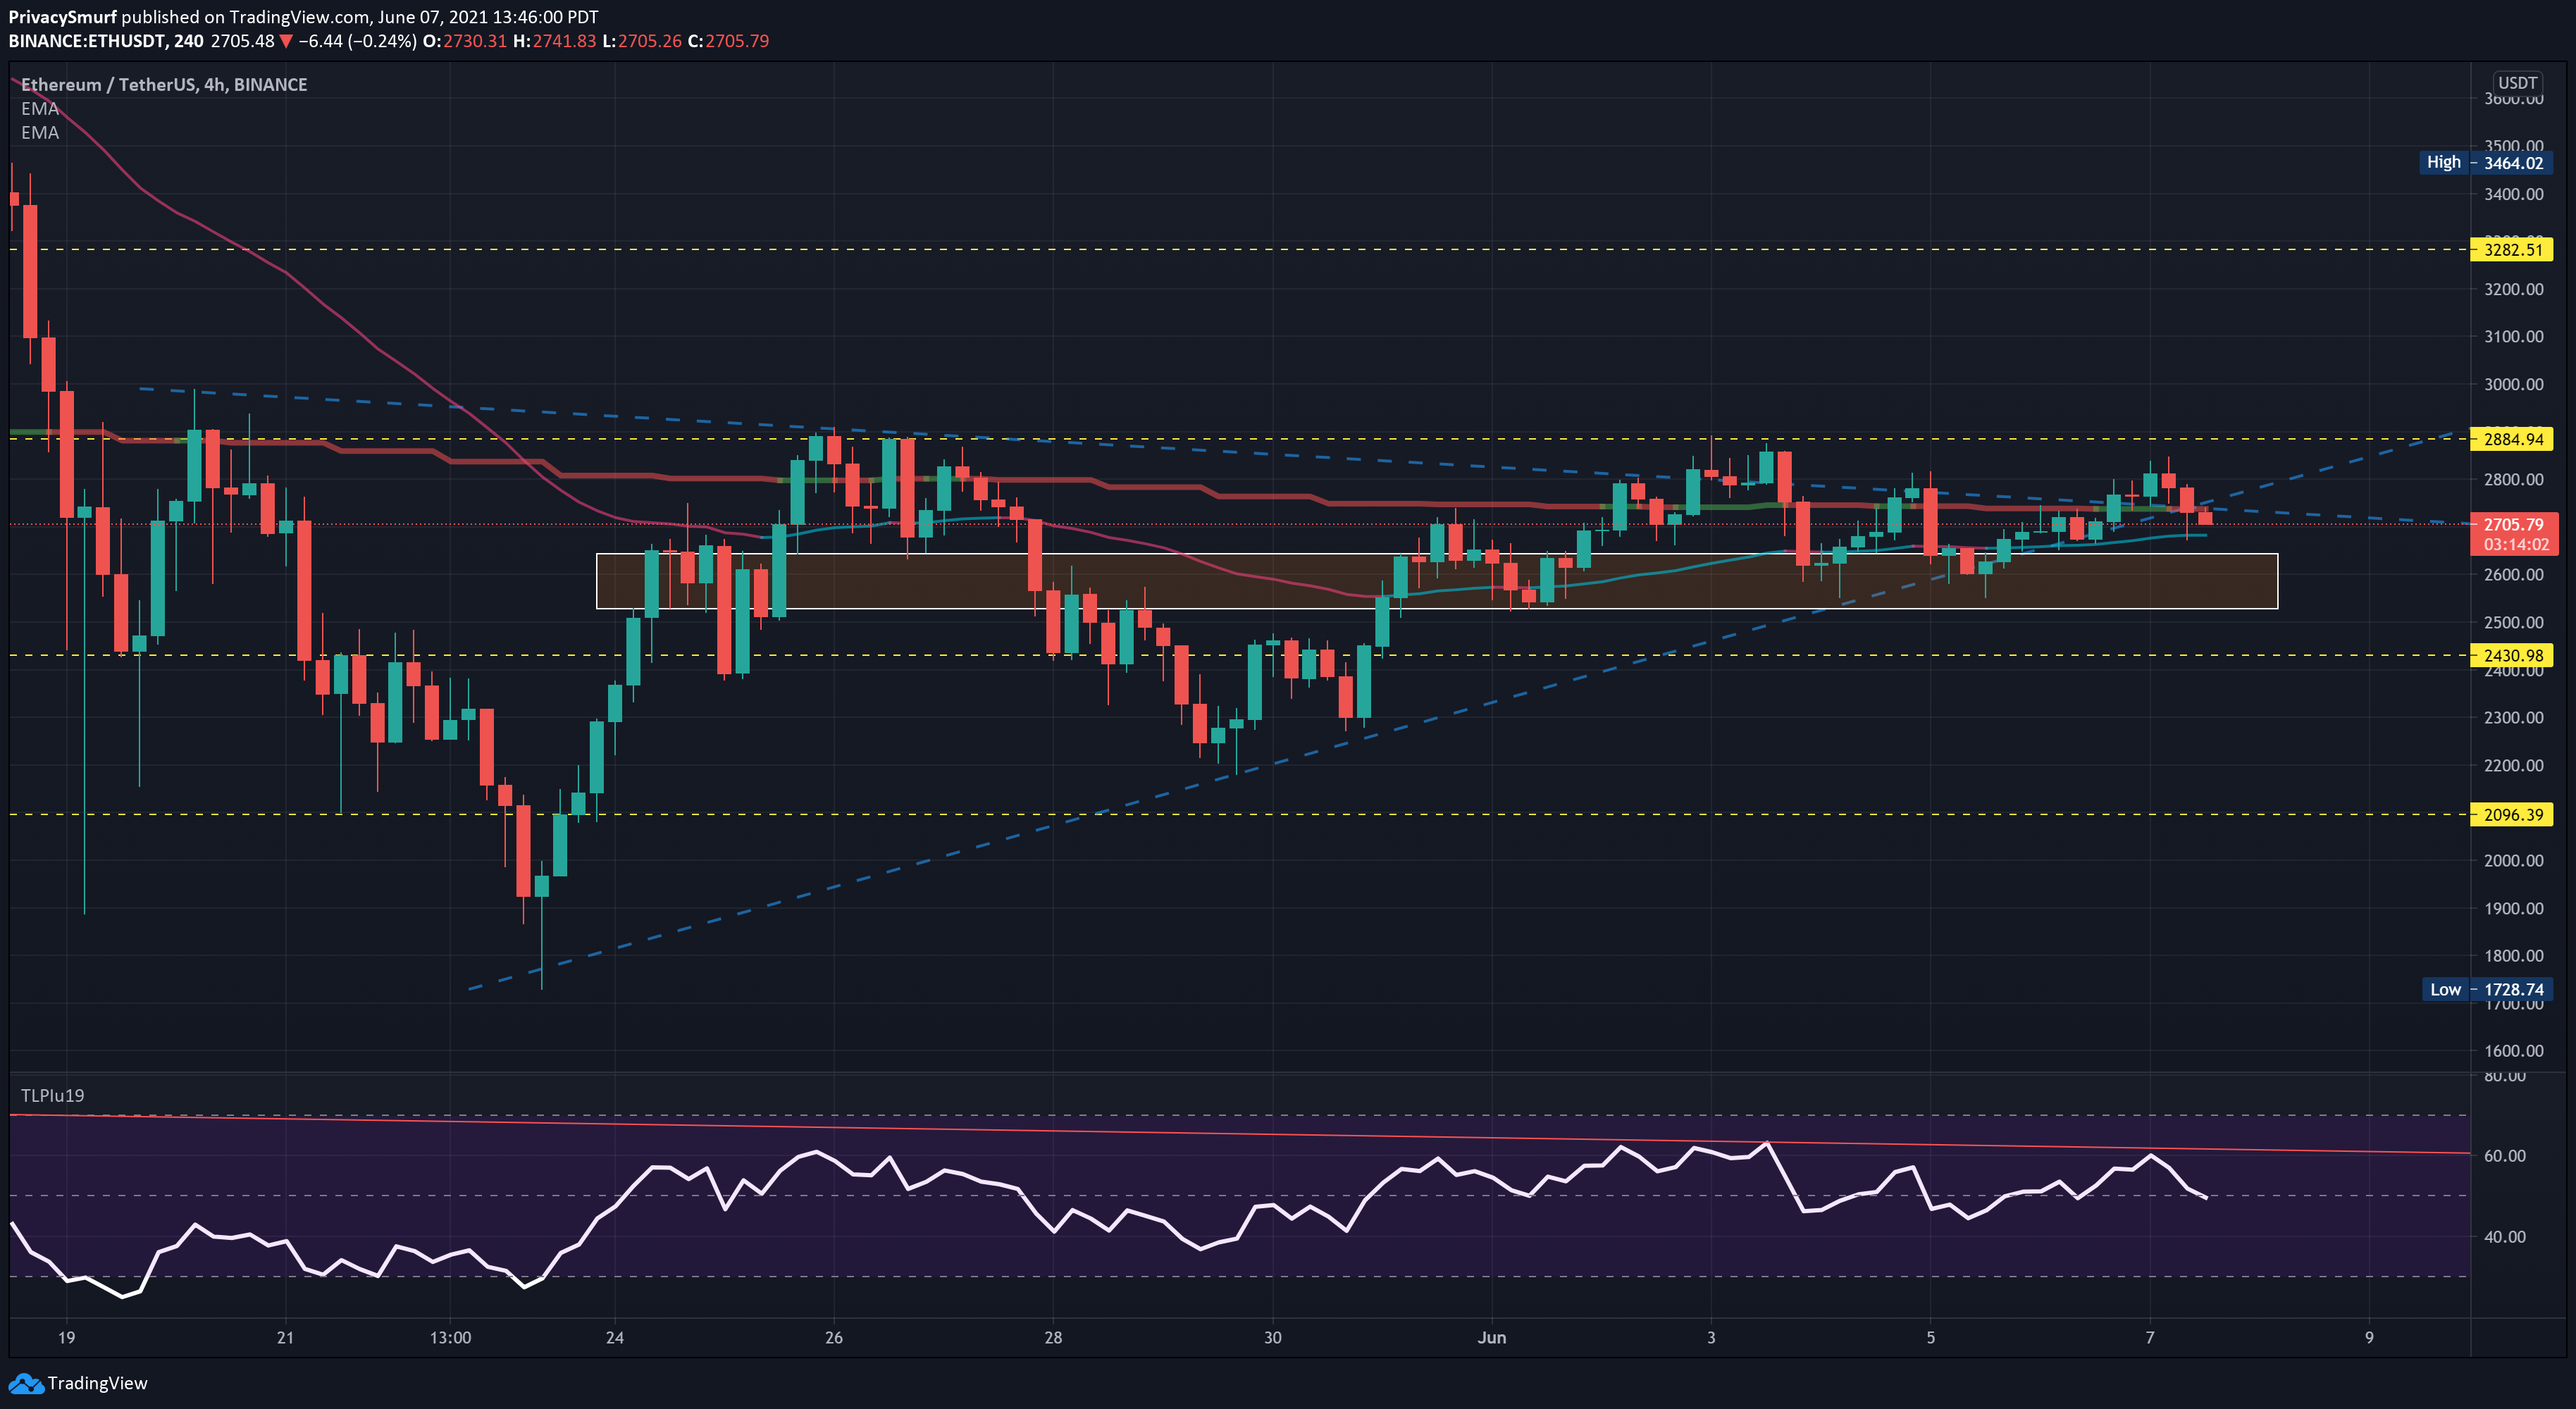
Eth on the daily chart has a slightly more bullish picture than BTC but the 50 Day EMA is still holding up as resistance along with RSI measuring below the midline. I’d naturally be leaning bearish as we come to this point of convergence of the trendlines.

The 4HR chart has just tested a break above the 50 Day EMA. Also (smaller line) the 50 period EMA has been acting as a support. I’d be looking at the 15m or 1HR chart for some entry signals for this support test.
In doing so dropping down the 1HR we can see many things over the last 3-4 hours. The RSI breaking the midline and trading below, a close below the triangle of ascending and descending trendlines, a selloff, a rally to test the resistance of the trendline, and a hold of that resistance. This is confirmed bearishness.
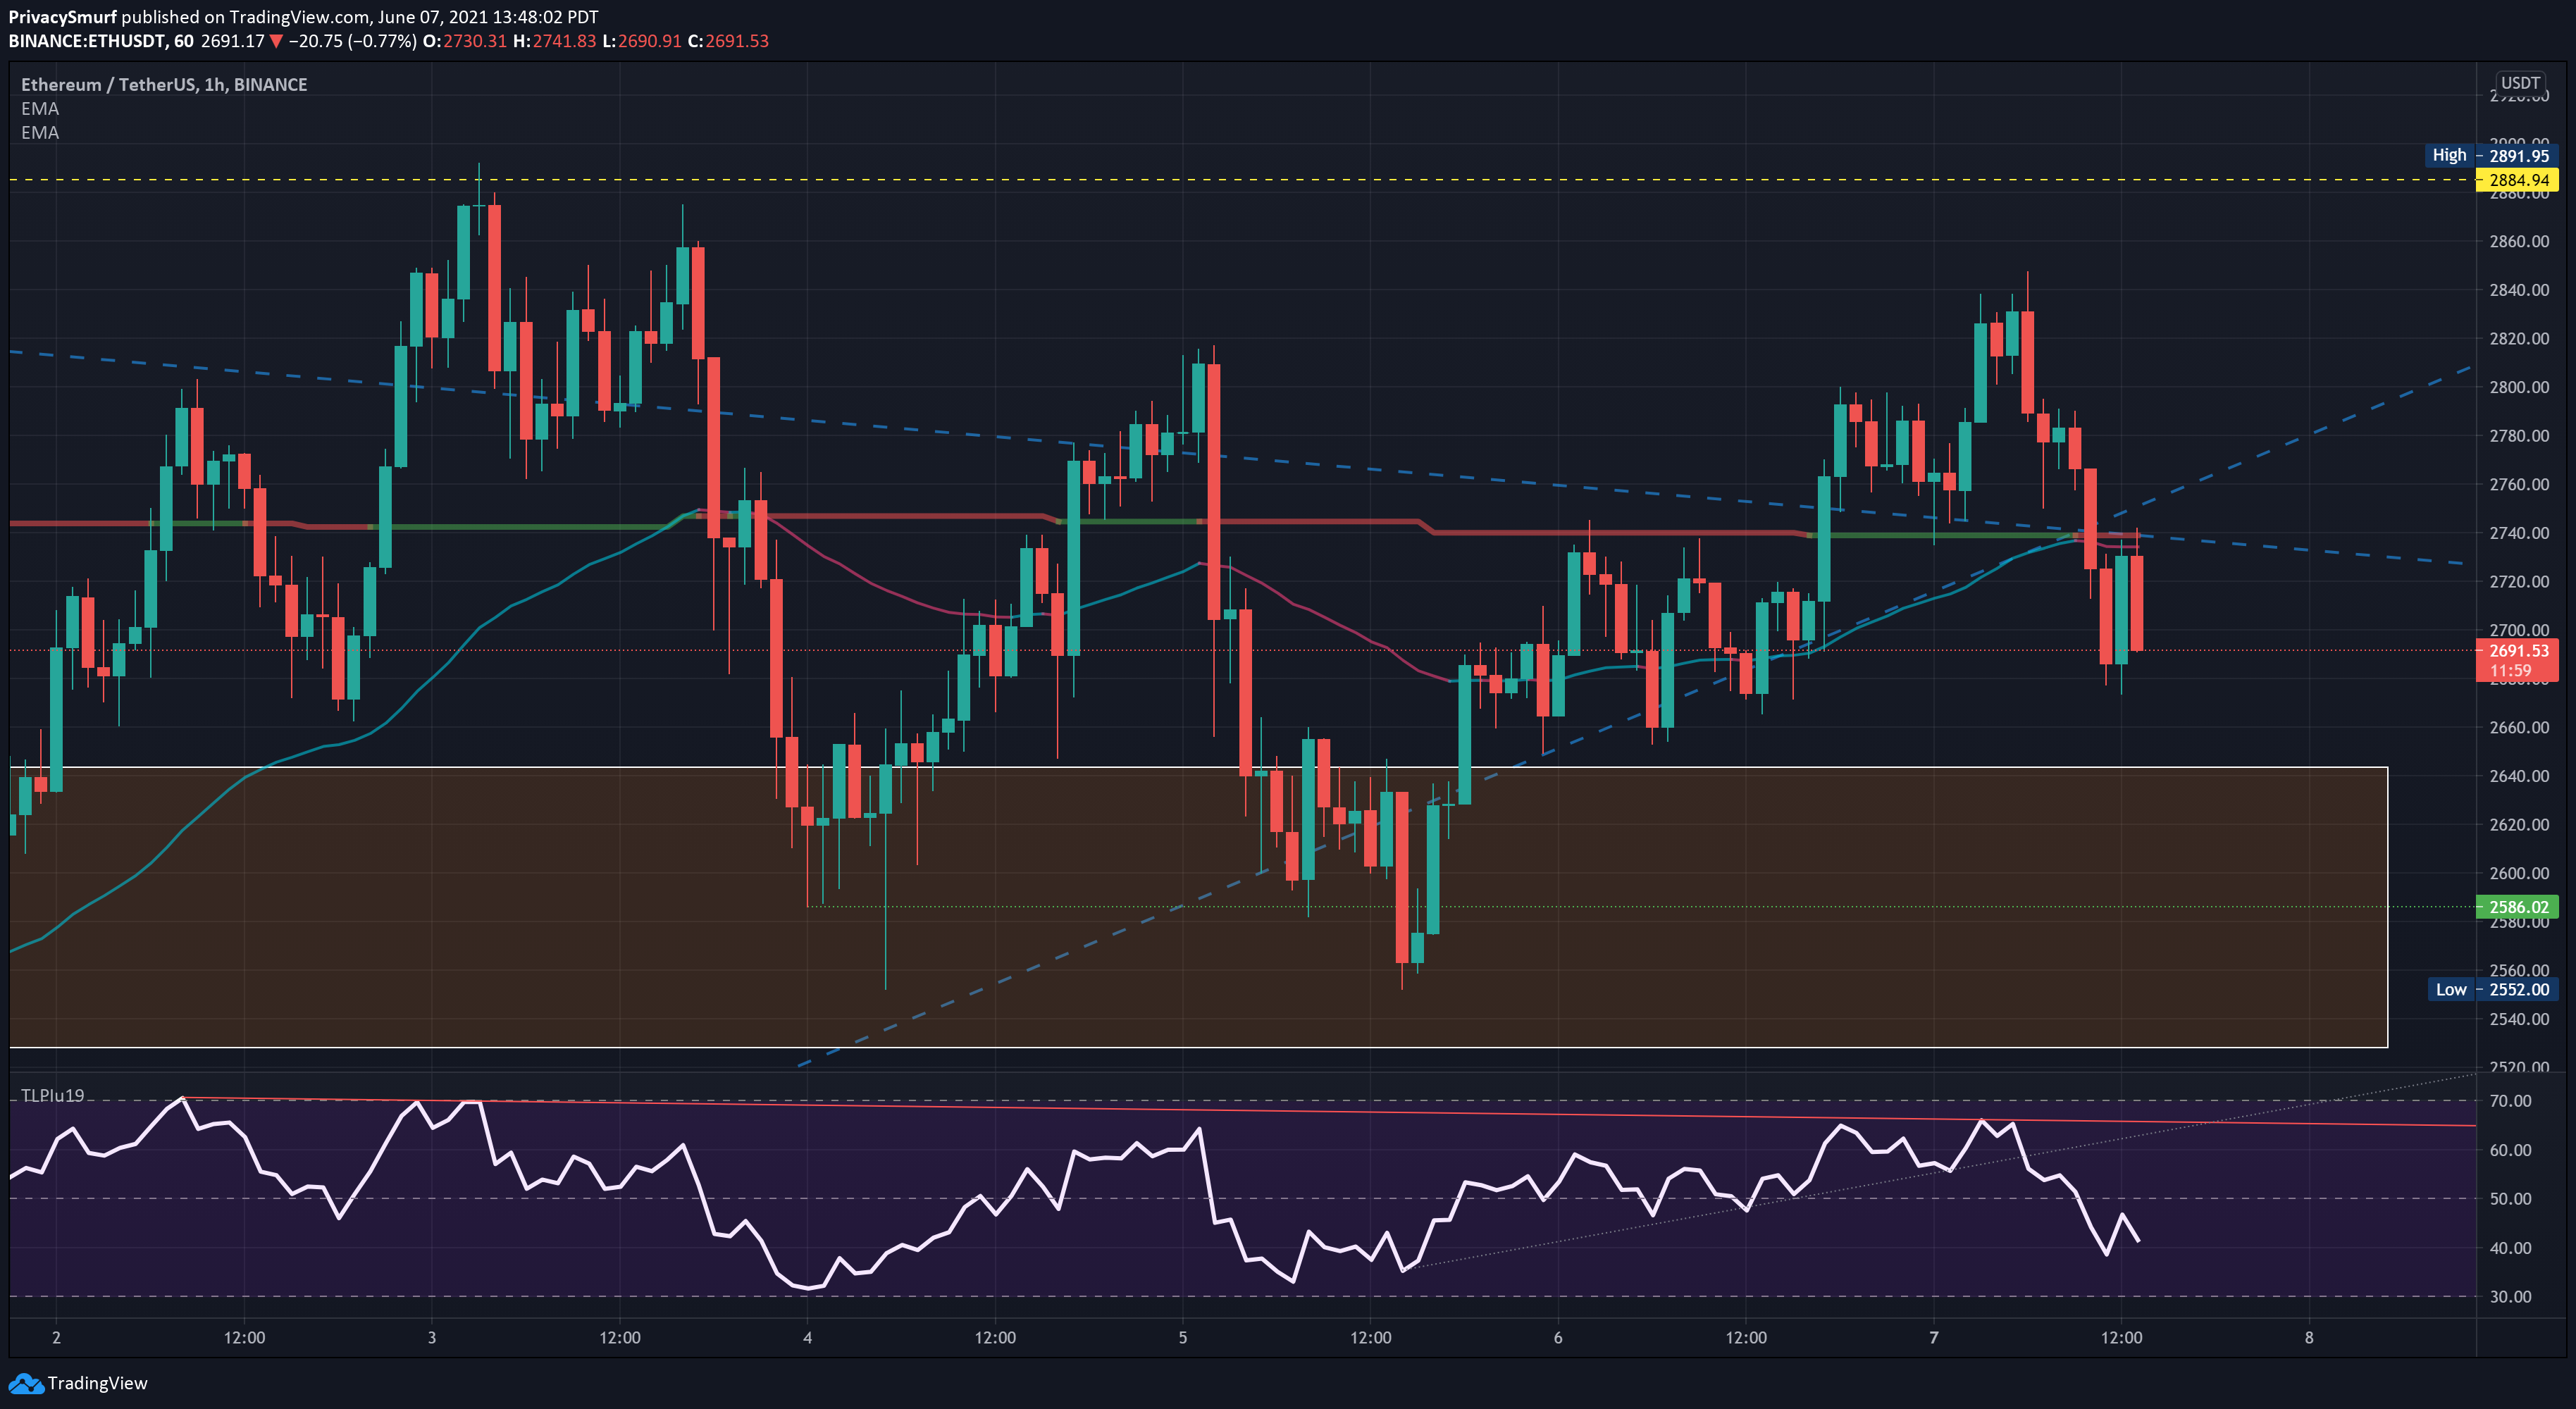
Takeaway: I’d not be trading any longs. I’m anticipating bearish price action with potential supports around 2660, 2620, and more firm support around 2590. The candle patterns on the 5m, 10m, or 15m chart could lead to some good scalp trades if they appear at support/resistance.
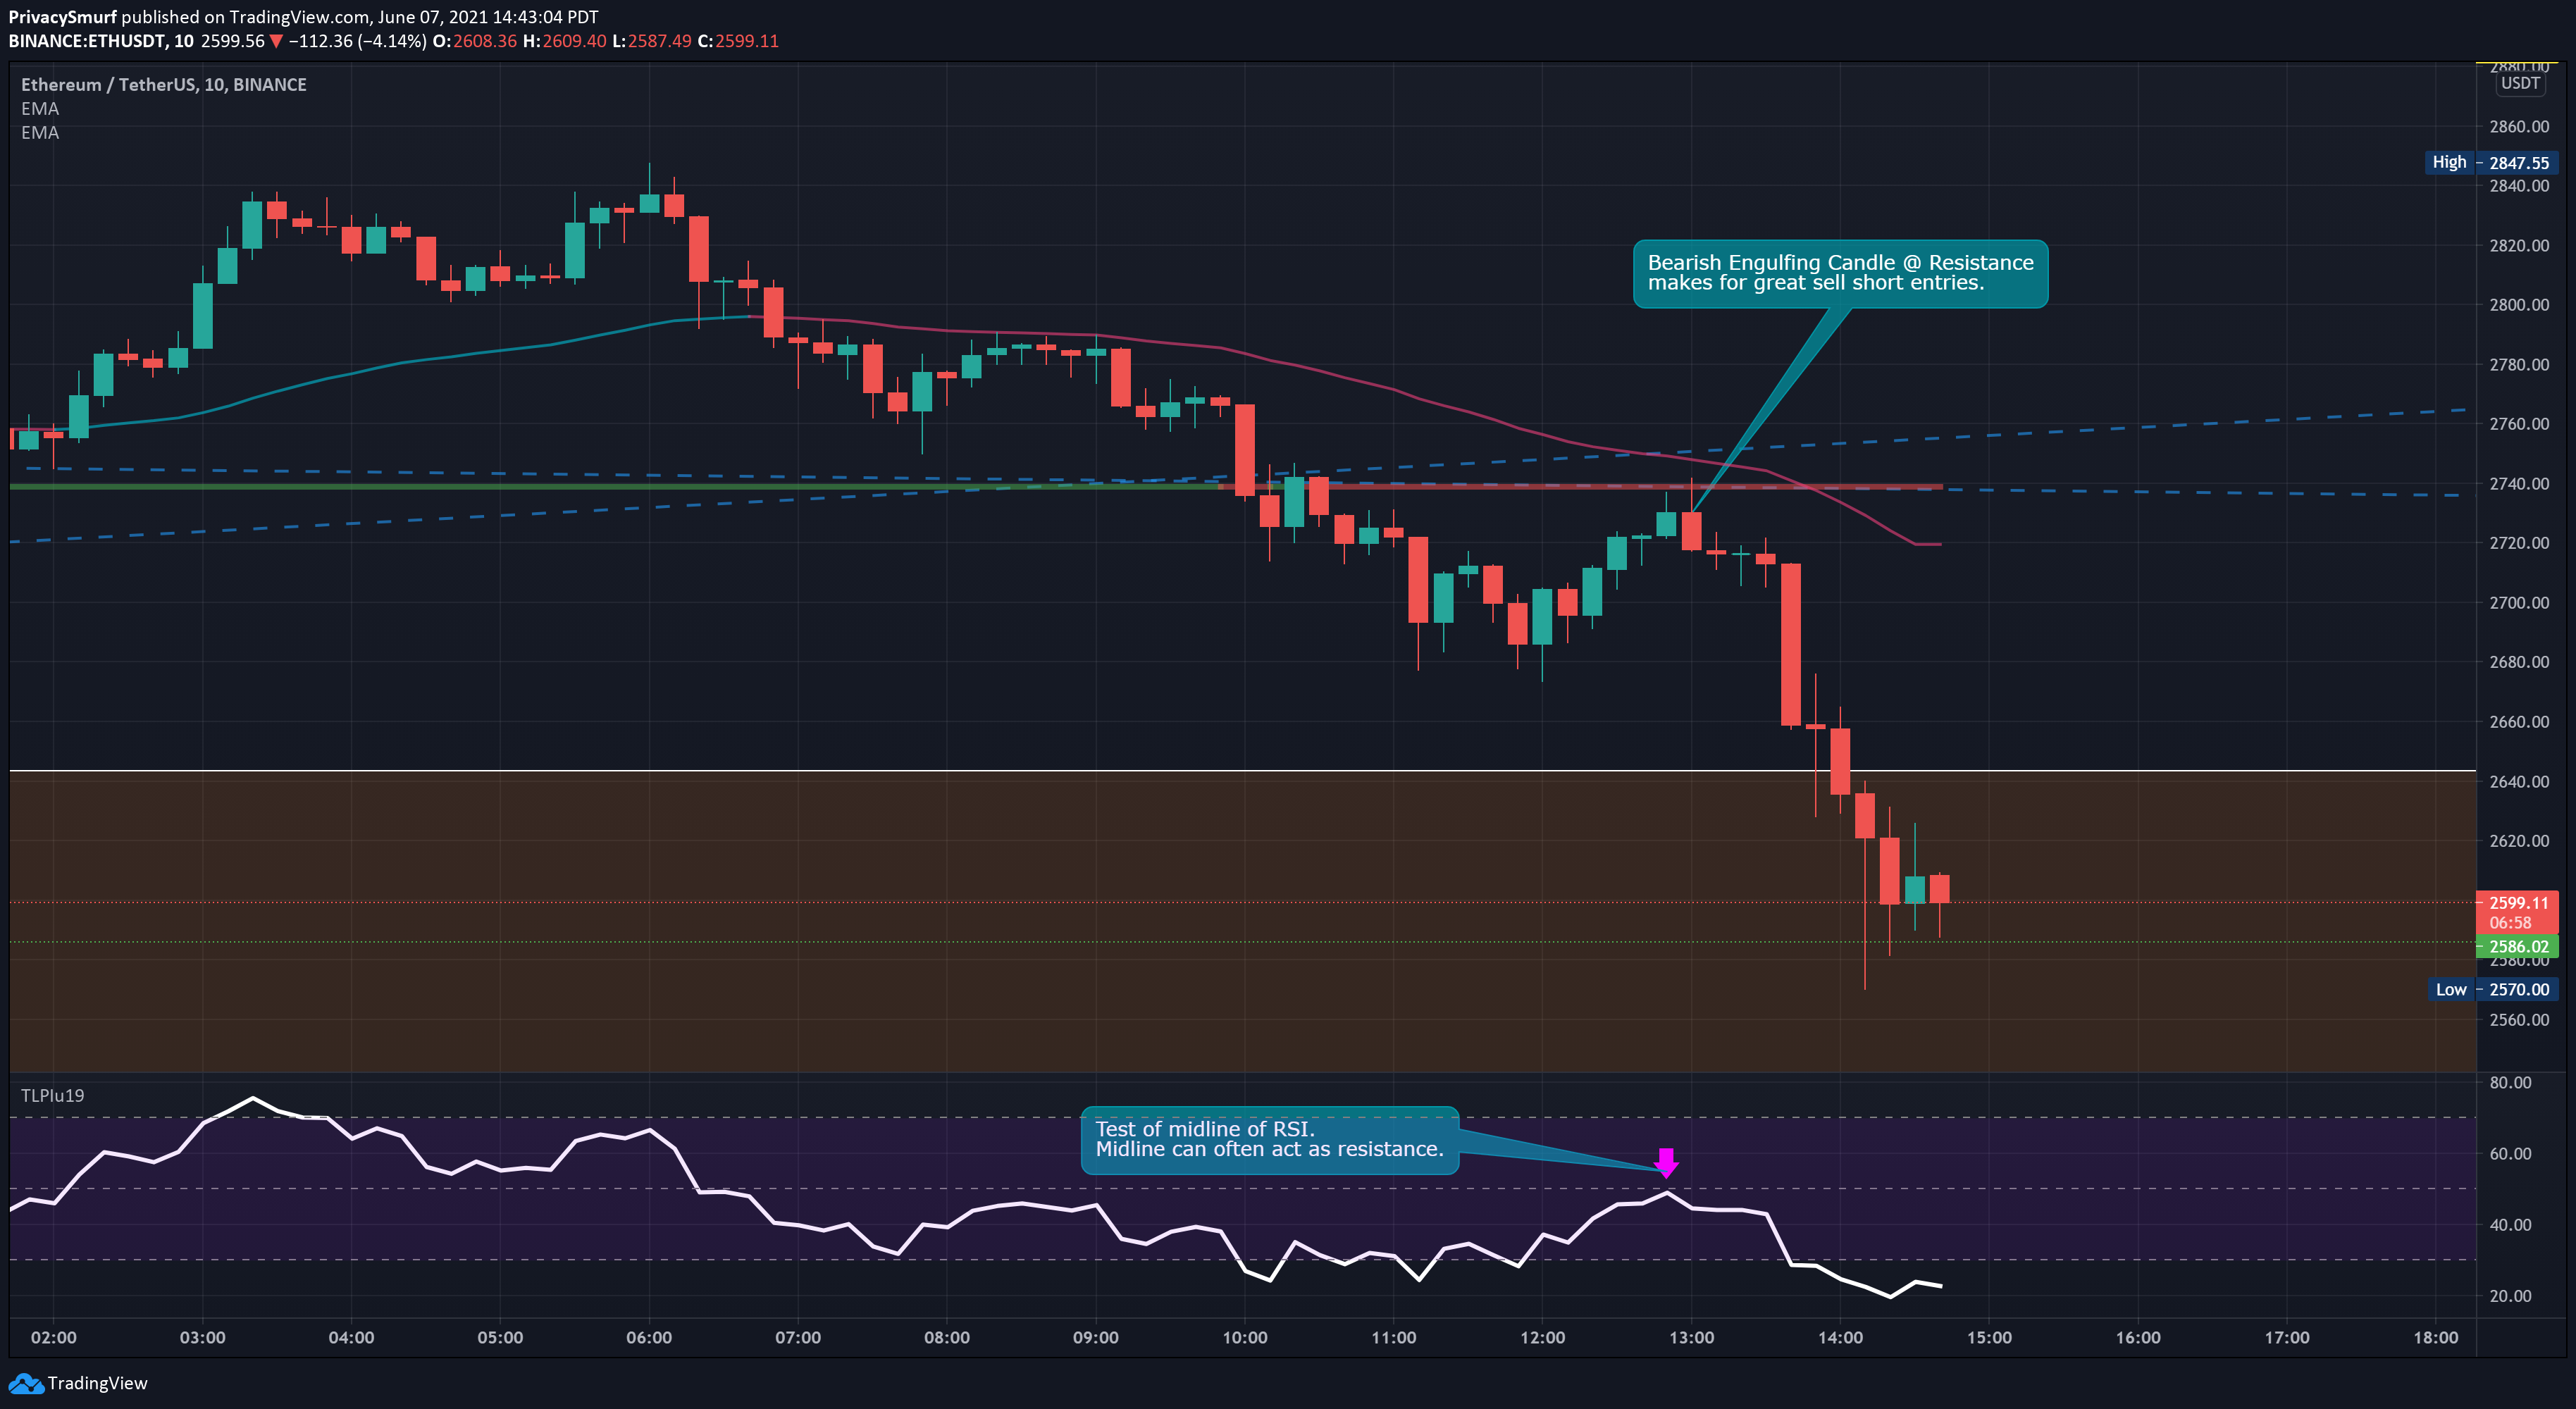
It’s super annoying, I’m finishing up this post and BTC’s price falls off a cliff. I recognize that is something that will happen from time to time. This is not intended to be a prediction of events although it provides a unique opportunity to show some AFTER photos.
In the future, on Topical Thursday, I’ll be going over profitable candlestick patterns I like. Here’s a sneak peek of some that could have been used to make trades off of the recent price action.
See you on Thursday!
@theprivacysmurf