

Micro Monday #6
Micro Monday #6
Disasters are just another star falling in my yard.


Red Hot Chili Peppers predicting “laser eyes” back in ‘99 in the song This Velvet Glove on the Californication album. Nice. Another reason to like them.
Anyways... I’m slowly building a micro bearish bias but those down bars are just opportunities to pick up the falling stars.
There’s going to be a new oscillator on my charts on the smaller intraday timeframes. I’ve been experimenting with it on my day trading for a while and I feel pretty comfortable debuting it here. I’m still working on the coding to release it for anyone who wants to add it but I’ll share that here as well once it’s polished. It’s nothing too crazy. It’s a smoothed and cyclic RSI with adaptive overbought/oversold bands. It is utilized near the same way everyone uses the RSI so it shouldn’t be hard to follow. I’ll explain once more once we get to the charts.
The first part of intraday trading is always looking at the daily chart to understand the larger forces in play. The daily chart updated from yesterday shows prices reaching new highs but the RSI is plotting a lower high, this is a bearish divergence which indicates the potential for a price decrease. This happening at a major resistance gives me the impression that bulls are not going to have the strength just yet to break through the $47k-$49k range. I’ll want to be cautious if I’m looking at intraday bullish trades and higher timeframes may soon be working against me. Smaller timeframe bearish setup although they are countertrend have a bit more appeal.

I’ve been doing more intraday trading on the 2HR timeframe lately. It’s certainly not ideal for the typical methods I swing trade intraday but it’s proving to be a pretty good timeframe for this version of the RSI. There’s a lot going on in this next chart but we’ll take it in parts. Below on the right side, we can see the same bearish divergent setup, increasing prices and falling RSI. The smoothed RSI has fewer micro oscillations with false signals, put simply it has less noise. Once we initially broke above the 50-day on the 25th I was looking for a retest of that EMA for my 100% certain we are bullish confirmation, that didn’t come but we got pretty darn close.
From the beginning of August price broke below the 50-period EMA and tested support just above the 50-Day EMA. The first lowest low in the price is annotated with the “red minus dot” lined with a bottoming on the RSI marked by the “green plus dot”. The price rallied and retraced from the 50-period EMA setting a new lower low (2nd red dot) but a higher RSI measurement (2nd green dot), this is a bullish divergence indicating a potential near-future price increase.
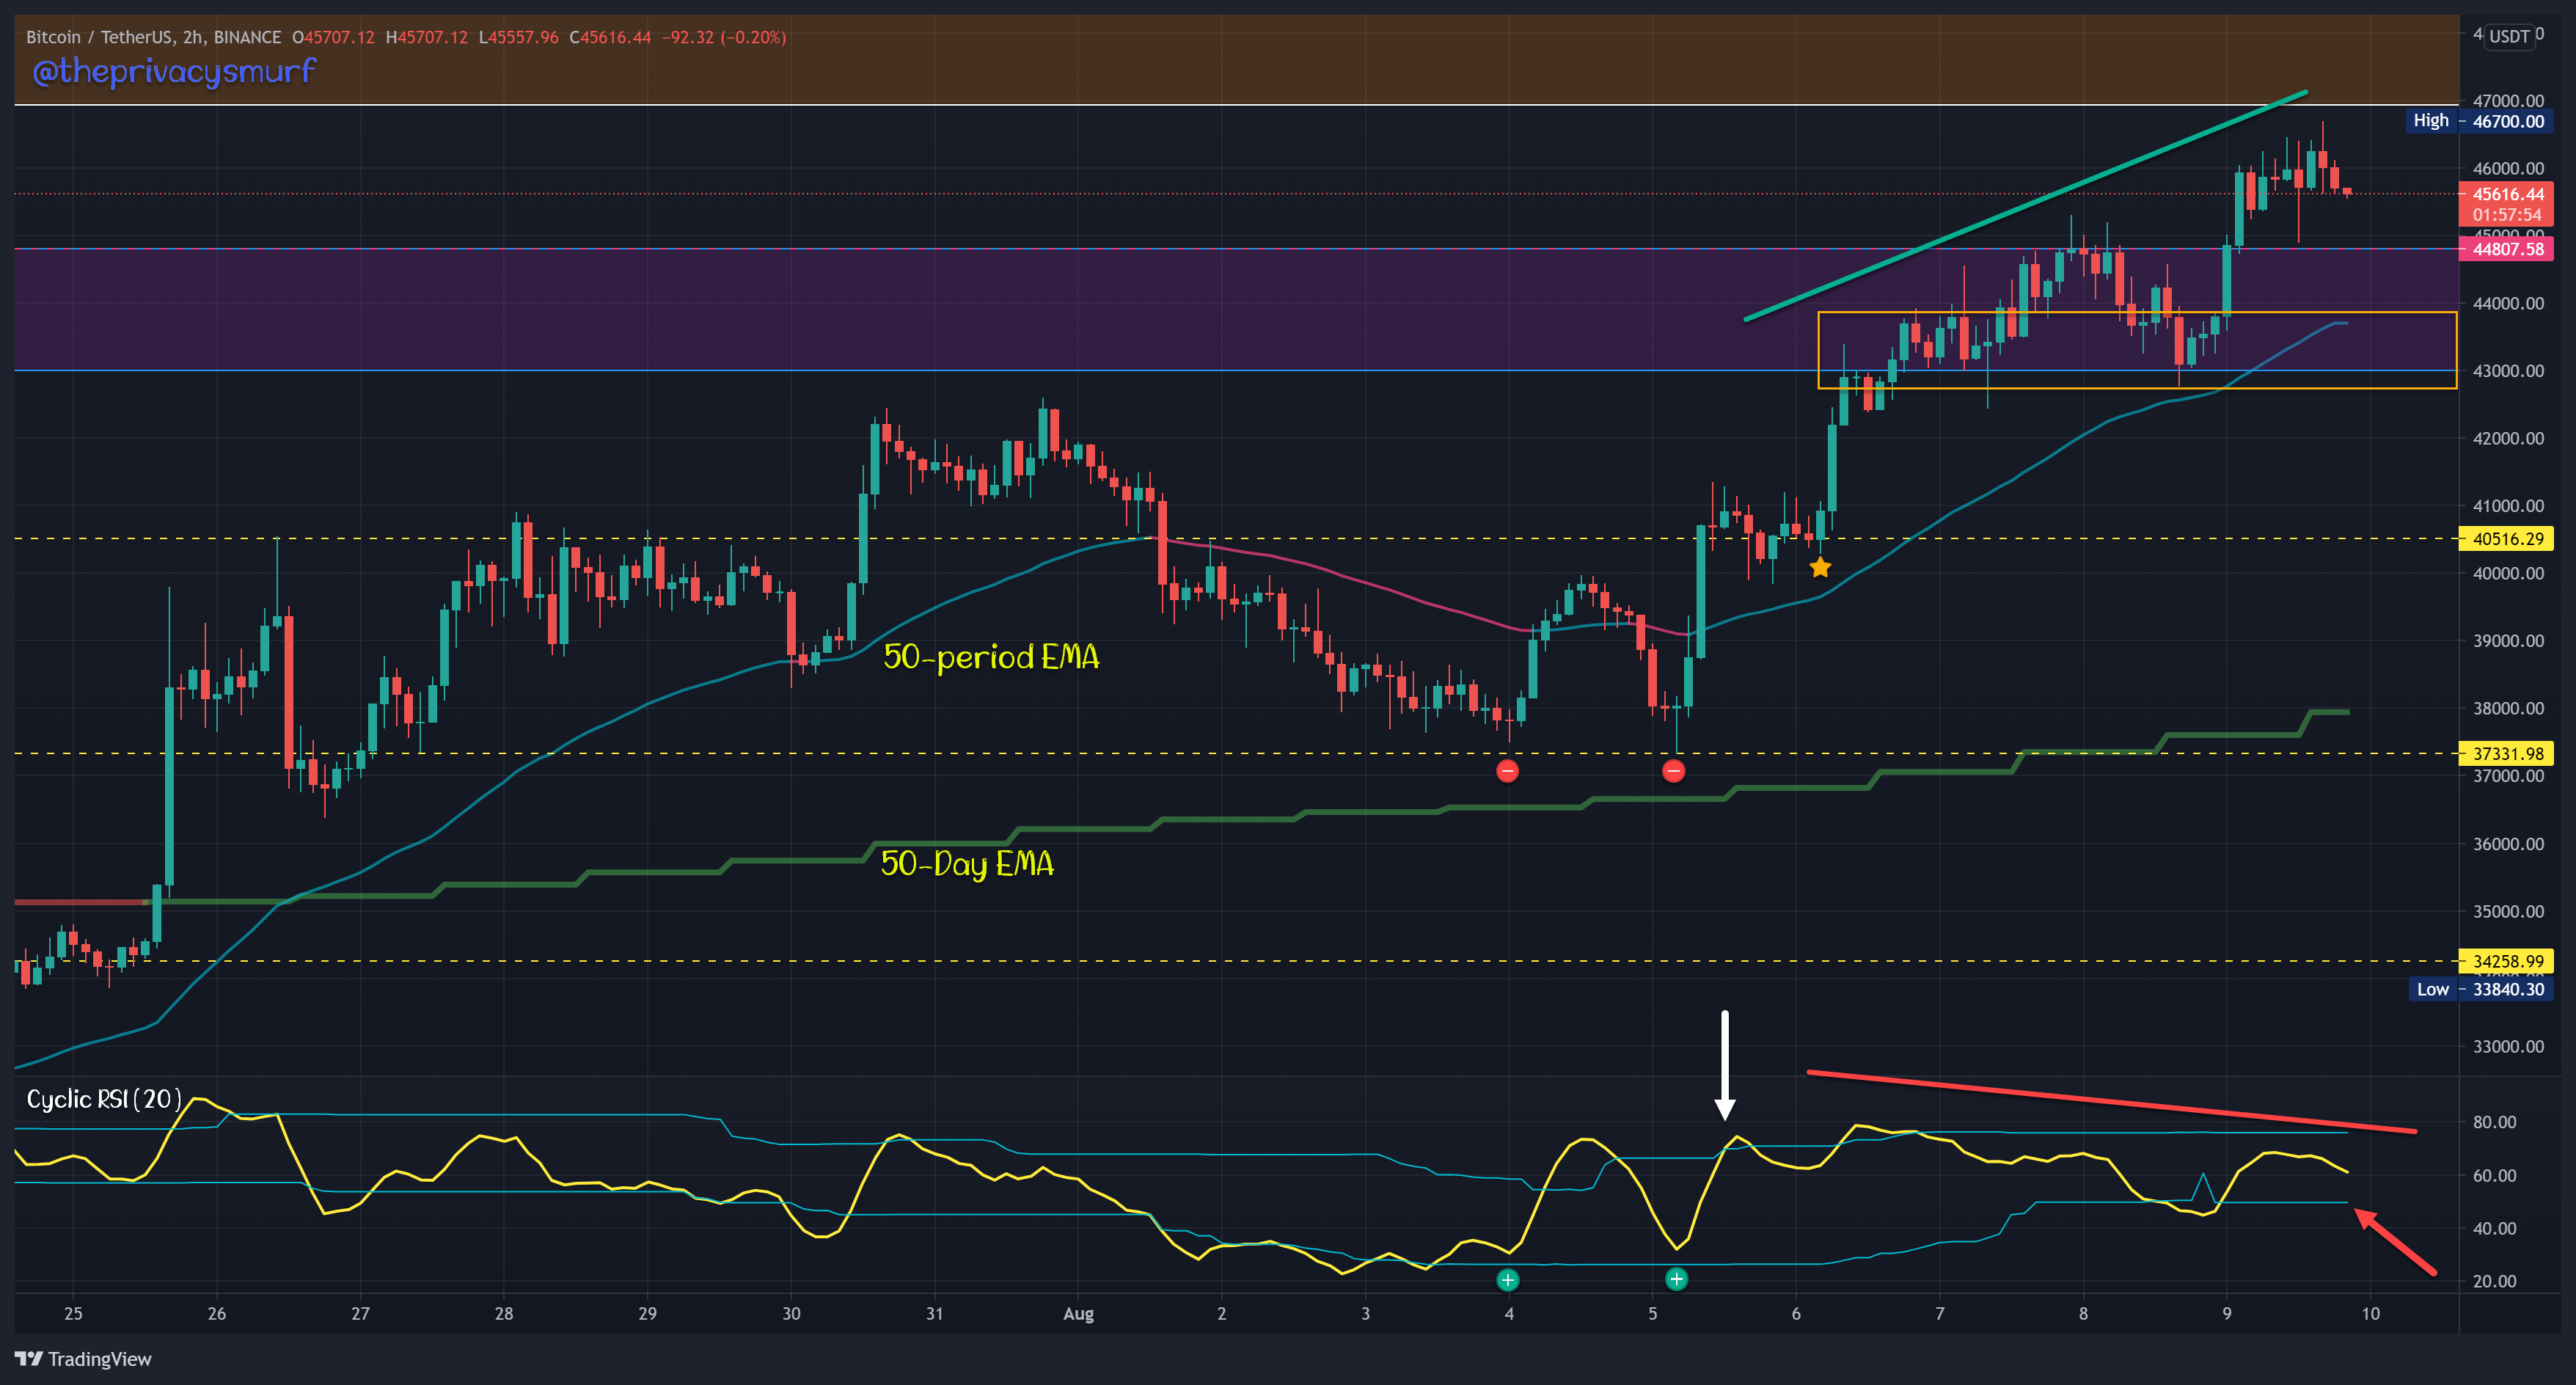
One could enter immediately but confirmation is always my mode of operation. With the modified RSI I’ve been waiting for a few potential entry signals. I’ve labeled one with the white arrow. The breaching of the top adaptive band is typically accompanied by a price bump. The “star” stamp on the 6th created the perfect storm: prior bullish divergence, bullish engulfing candle above support, breaching of the top adaptive band. That would be the ideal entry point as there are multiple aligning signals creating a high probability setup. Entering at the close of the engulfing candle nets an easy 5% up to the first resistance at $43k where I would scale out some profits top derisk my position then let the rest ride.
The same method would be used on the opposite side to exit. There have been two peaks in price, on the 7th and the 9th, matching with lower peaks on the RSI. I’d be looking to close out the position when the RSI breaks below the lower adaptive band, marked by the red arrow. If I was a betting man I’d bet that would probably line up in a zone up from the 50-period EMA and the 44.8k support.
I’ve even ventured into the 20minute timeframe with this setup. The same bearish divergence setup appears, followed by a bearish engulfing candle and break below of the lower RSI band.

Side note, with the RSI setting a lower low than the prior low that is more indication to me that we’ll get a retracement.
ETH is looking in better shape, but not for intraday trading. No divergences yet. It’s just dealing with strong resistance and BTC being a jerk dragging down the market. You can also see the bottom using this modified RSI in the highlighted green section. A low close in the price and RSI on the 22nd. A new low close in price and a higher low on RSI on the 20th. Conservative entry on the 24th when the RSI breaks above the top adaptive band 24th or a riskier entry on the close of the bullish engulfing candle and turn up of RSI on the 21st. Either one is a super profitable position.

The bearish divergence on ETH’s smaller timeframes is less pronounced. I wouldn’t really be taking a short trade here. I could speculate that the price will dip down to test around $2880-$3000 but there’s not a good enough setup here for me as the higher timeframes don’t look so bearish. The price falling down to the 50-period EMA would probably coincide with the RSI breaking the lower band and that’s why I’d think the $2884 support is still in play.

I did have a shot of the 20-minute chart but the price has been in a pretty tight consolidation range and trading around that is basically a dice throw and not my kinda game (outside of the casinos, at least).
That will wrap up this post. When I get the cyclic RSI coding for tradingview done I’ll post it here along with my traditional swing trading trend indicator. Thursday we’ll talk about some profit-taking strategies that I employ and a little bit about stats and percentages. It’s gonna be a bit word & number heavy so prepare yourself. Don’t forget to submit a comment for the Saturday Altcoin showcase, give me one or two you’d like to see.
@theprivacysmurf
Is someone you know aspiring to be a daytrader? Help them out. Pass this along.