

Mid Week Update


Mid-week posts are weird to make but I guess that is the hole I dig myself into when I’m late and stuff happens in the market. Oh well.
BTC/USDT ← chart link
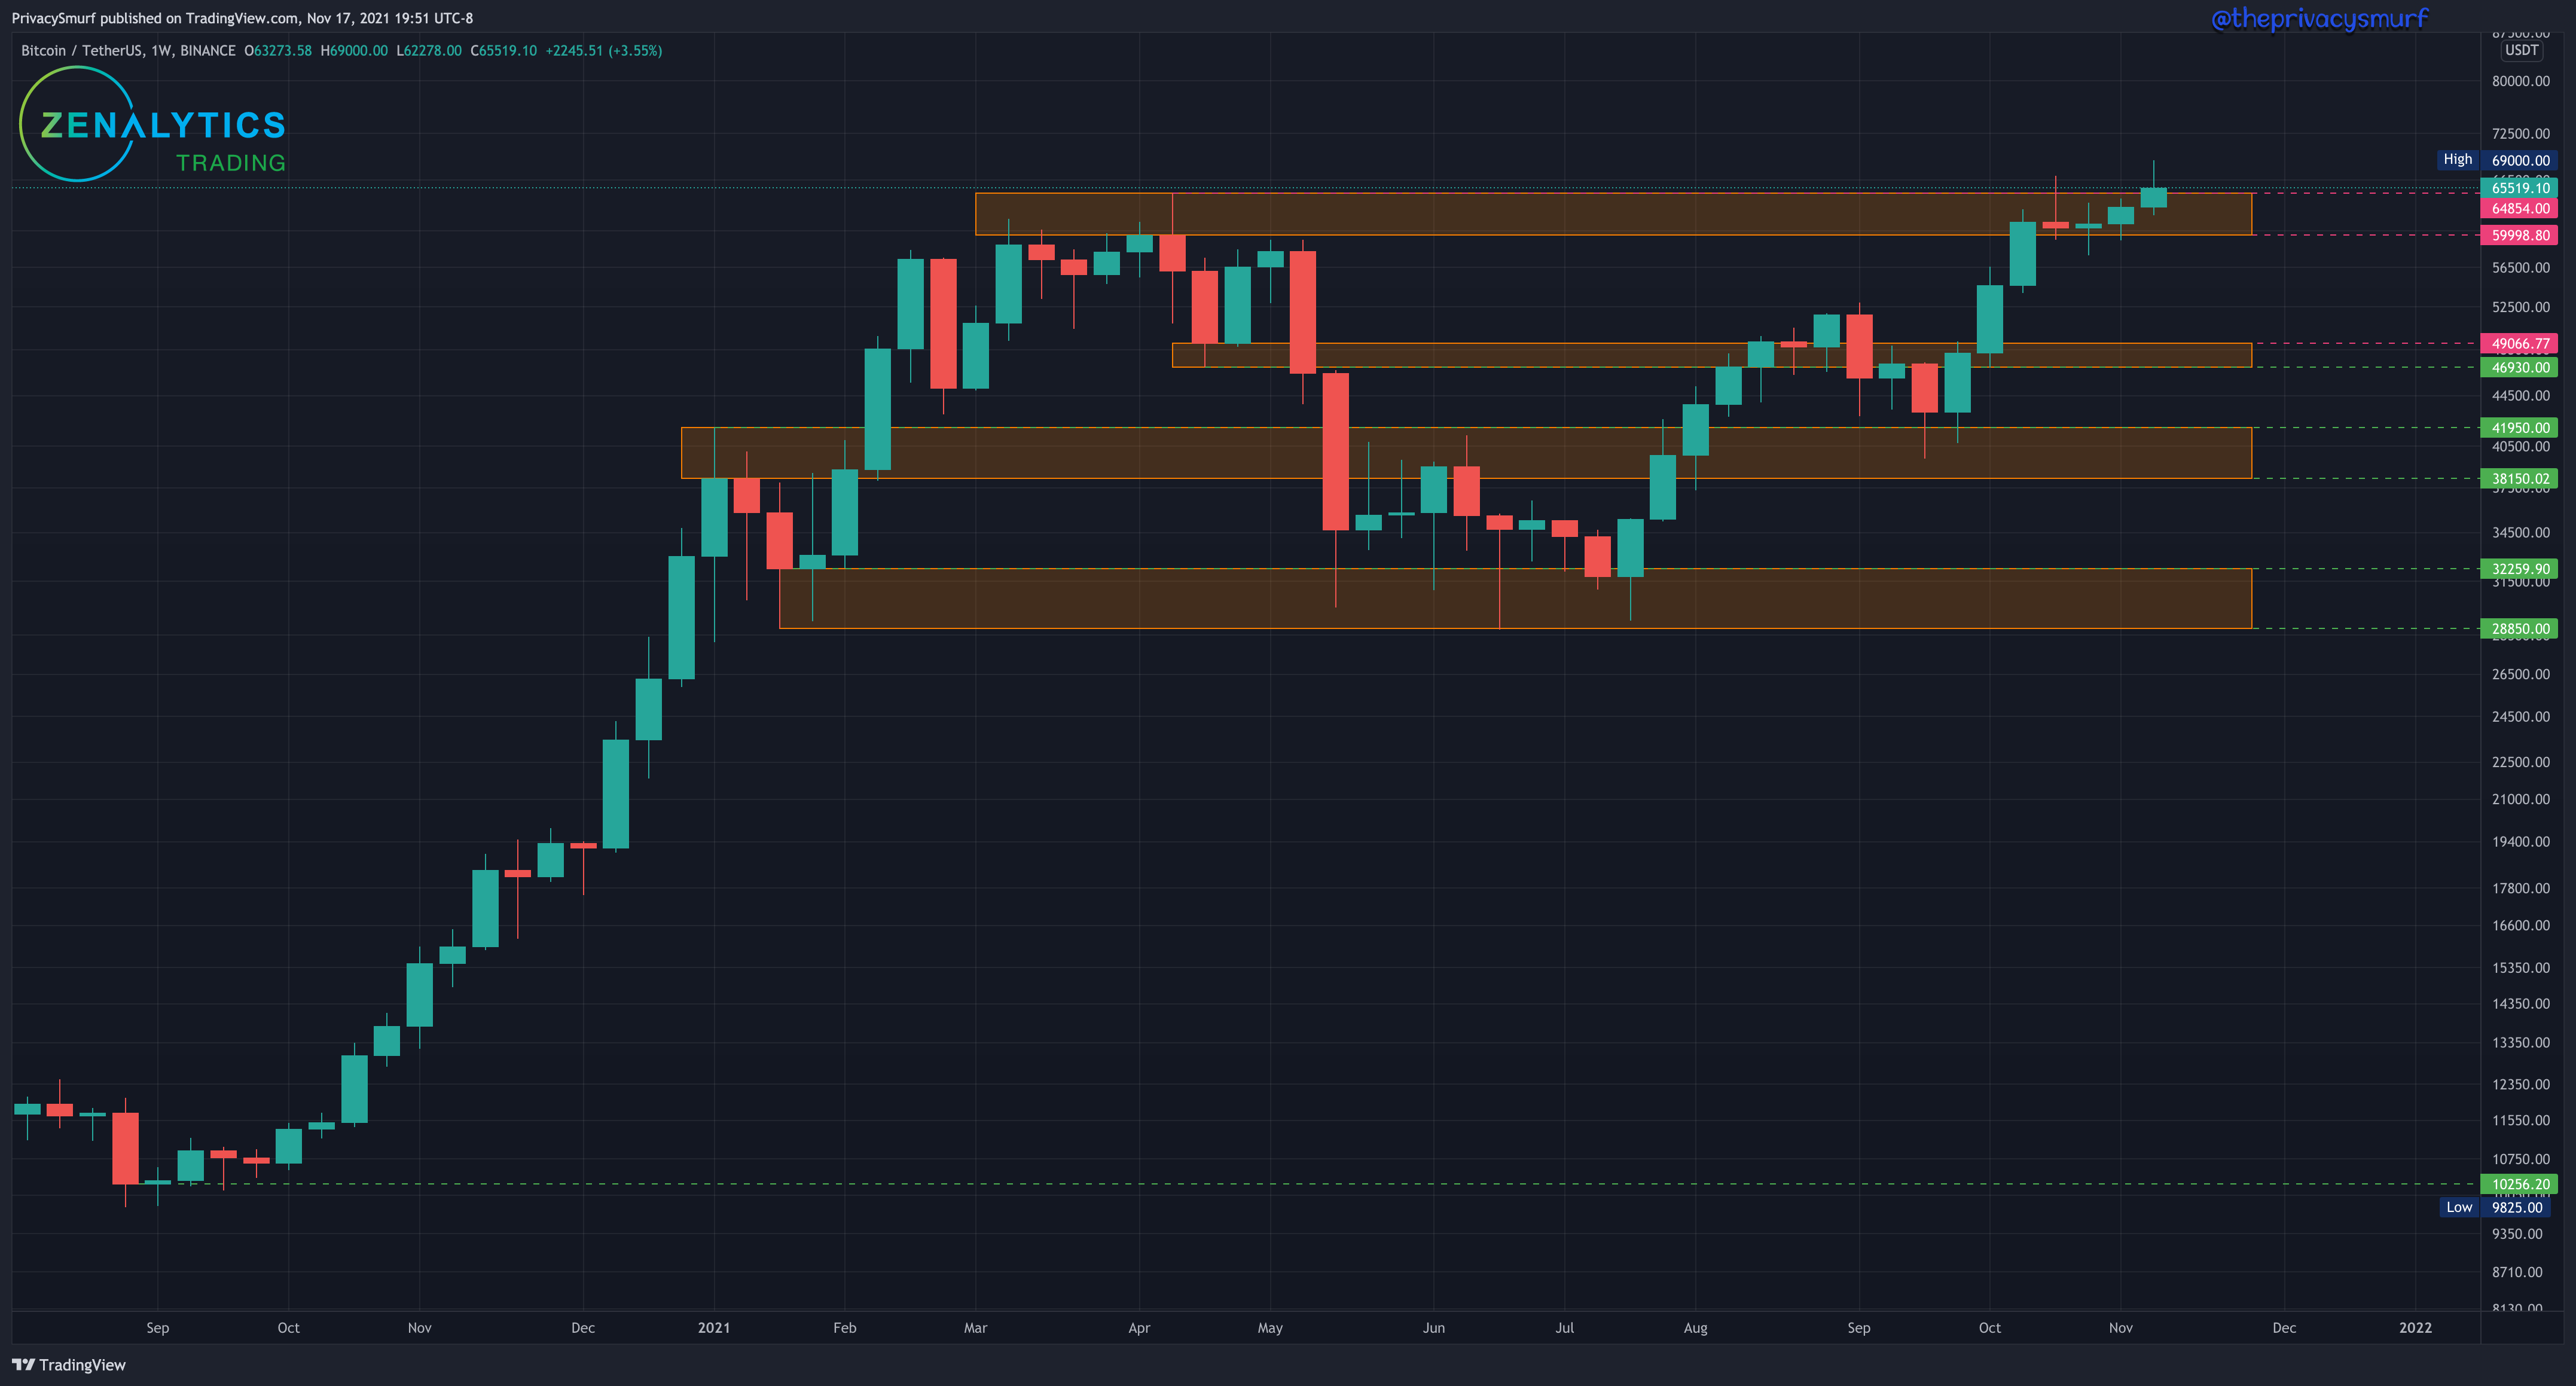
So looking at the past week, omitting this week’s daily price action we see the highest weekly close above summer highs and we set a new all-time high. This is a bullish sign. The market structure is still quite bullish. There’s no reason to change the bias here with this picture.
Moving down to a current daily chart we can see the bearish divergence of increasing price and decreasing RSI measurements I was concerned with last week. It triggered and the price went into decline. That divergence paired with the RSI crossing below the bottom adaptive band at the midline (white arrow) typically will accompany a drop like we see on the chart. We’ve also had a couple of daily closes under the recently established floor around $60.7k. That’s a troublesome position to be in but the fact that the lowest close in this range at 58.4k has held as support is promising. The price is also still riding above the 50-Day EMA. I wouldn’t alter my bullish bias until a daily candle closed under these two supports. I’m still waiting patiently for that juicy buy zone around $56k. It doesn’t seem so farfetched to catch a rampant wick down there, hope it comes around. There aren’t any actions to take here at the moment in my opinion. The 2HR chart will show why.

There is a slight bullish divergence in price and the RSI on the 2HR chart. This is great but often after larger dips, the first bullish divergence won’t be enough to counter the larger bearish move. Also, we can see price compression between the 50-Day EMA and decreasing highs in price, with the 50-period EMA also dropping down. I wouldn’t be expecting bullish prices to move much above 62k at the moment without some increasing measurements on the RSI. It’s entirely possible that the price could break out to either side of this wedge. The downside I wouldn’t be all that worried because it is likely lots of spot buy liquidity exists at $56k (my orders included).

I’m expecting a bit more price compression between these 2 EMAs for the ending of the week until some inevitable volatility with the breakout of the wedge. Overall I have a bullish bias on the daily chart but I’m prepared and leaning towards a wick down into the lower buy zone based on the smaller timeframe pictures. Volume will also need to be monitored because dwindling volume into the weekend could send prices down lower again.
ETH-BTC ← chart link
Another boring week on the ETH/BTC chart. Still a bullish bias. ETH is still moving in line with BTC. It’s just not time yet for the ETH run. Still a bullish bias here.

The daily chart shows the recent failure at the test of the long-term ascending trendline. The 50-Day EMA and horizontal support are below price so those both push me towards a bullish bias. The RSI is moving in line with the price as well. A bullish candle pattern showing up over the next couple of days may be a reason to expect ETH to start gaining on BTC but it looks like the big picture there’s just too much indecision in the market around BTC and ETH. Neither is the standout right now. Failure of the EMA and horizontal support and I’d expect the next level of support around the 0.068 mark.
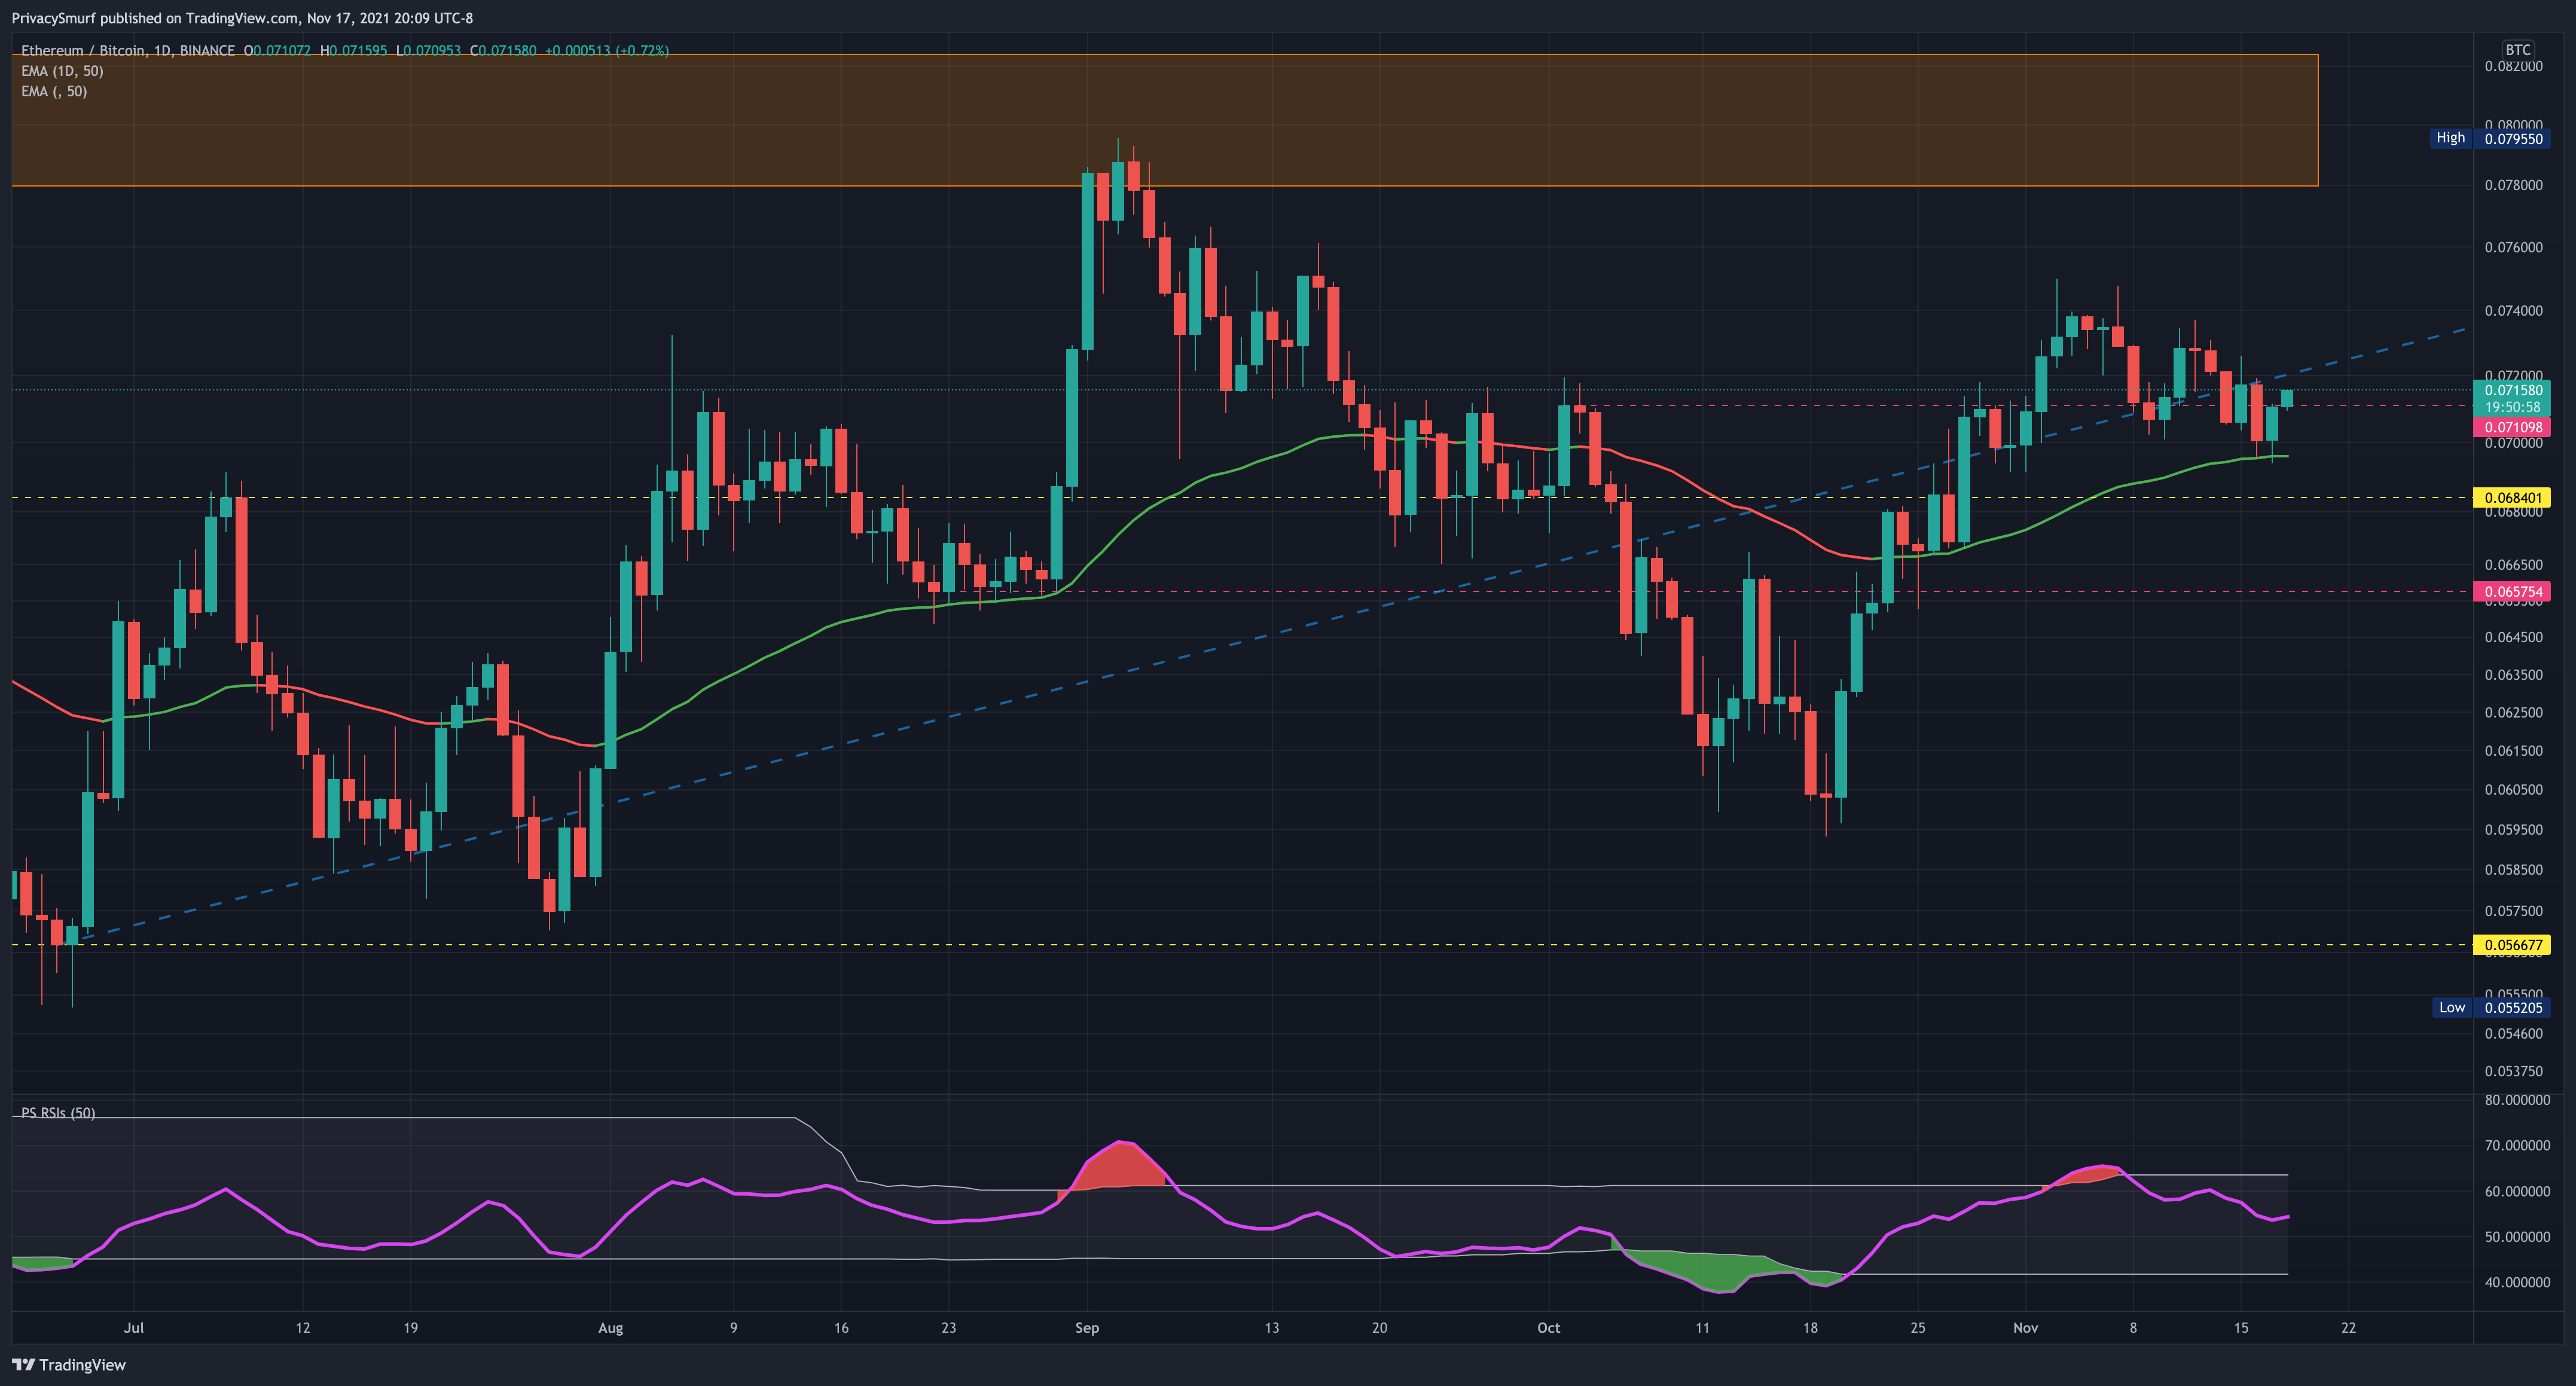
This chart setup doesn't really present me with a scenario to sell ETH into BTC or BTC into ETH to maximize gains. A break above the 0.074 mark would push me towards the buying ETH trade. That would likely run up to the 0.078 mark before resistance would push back.
ETH/USDT ← chart link
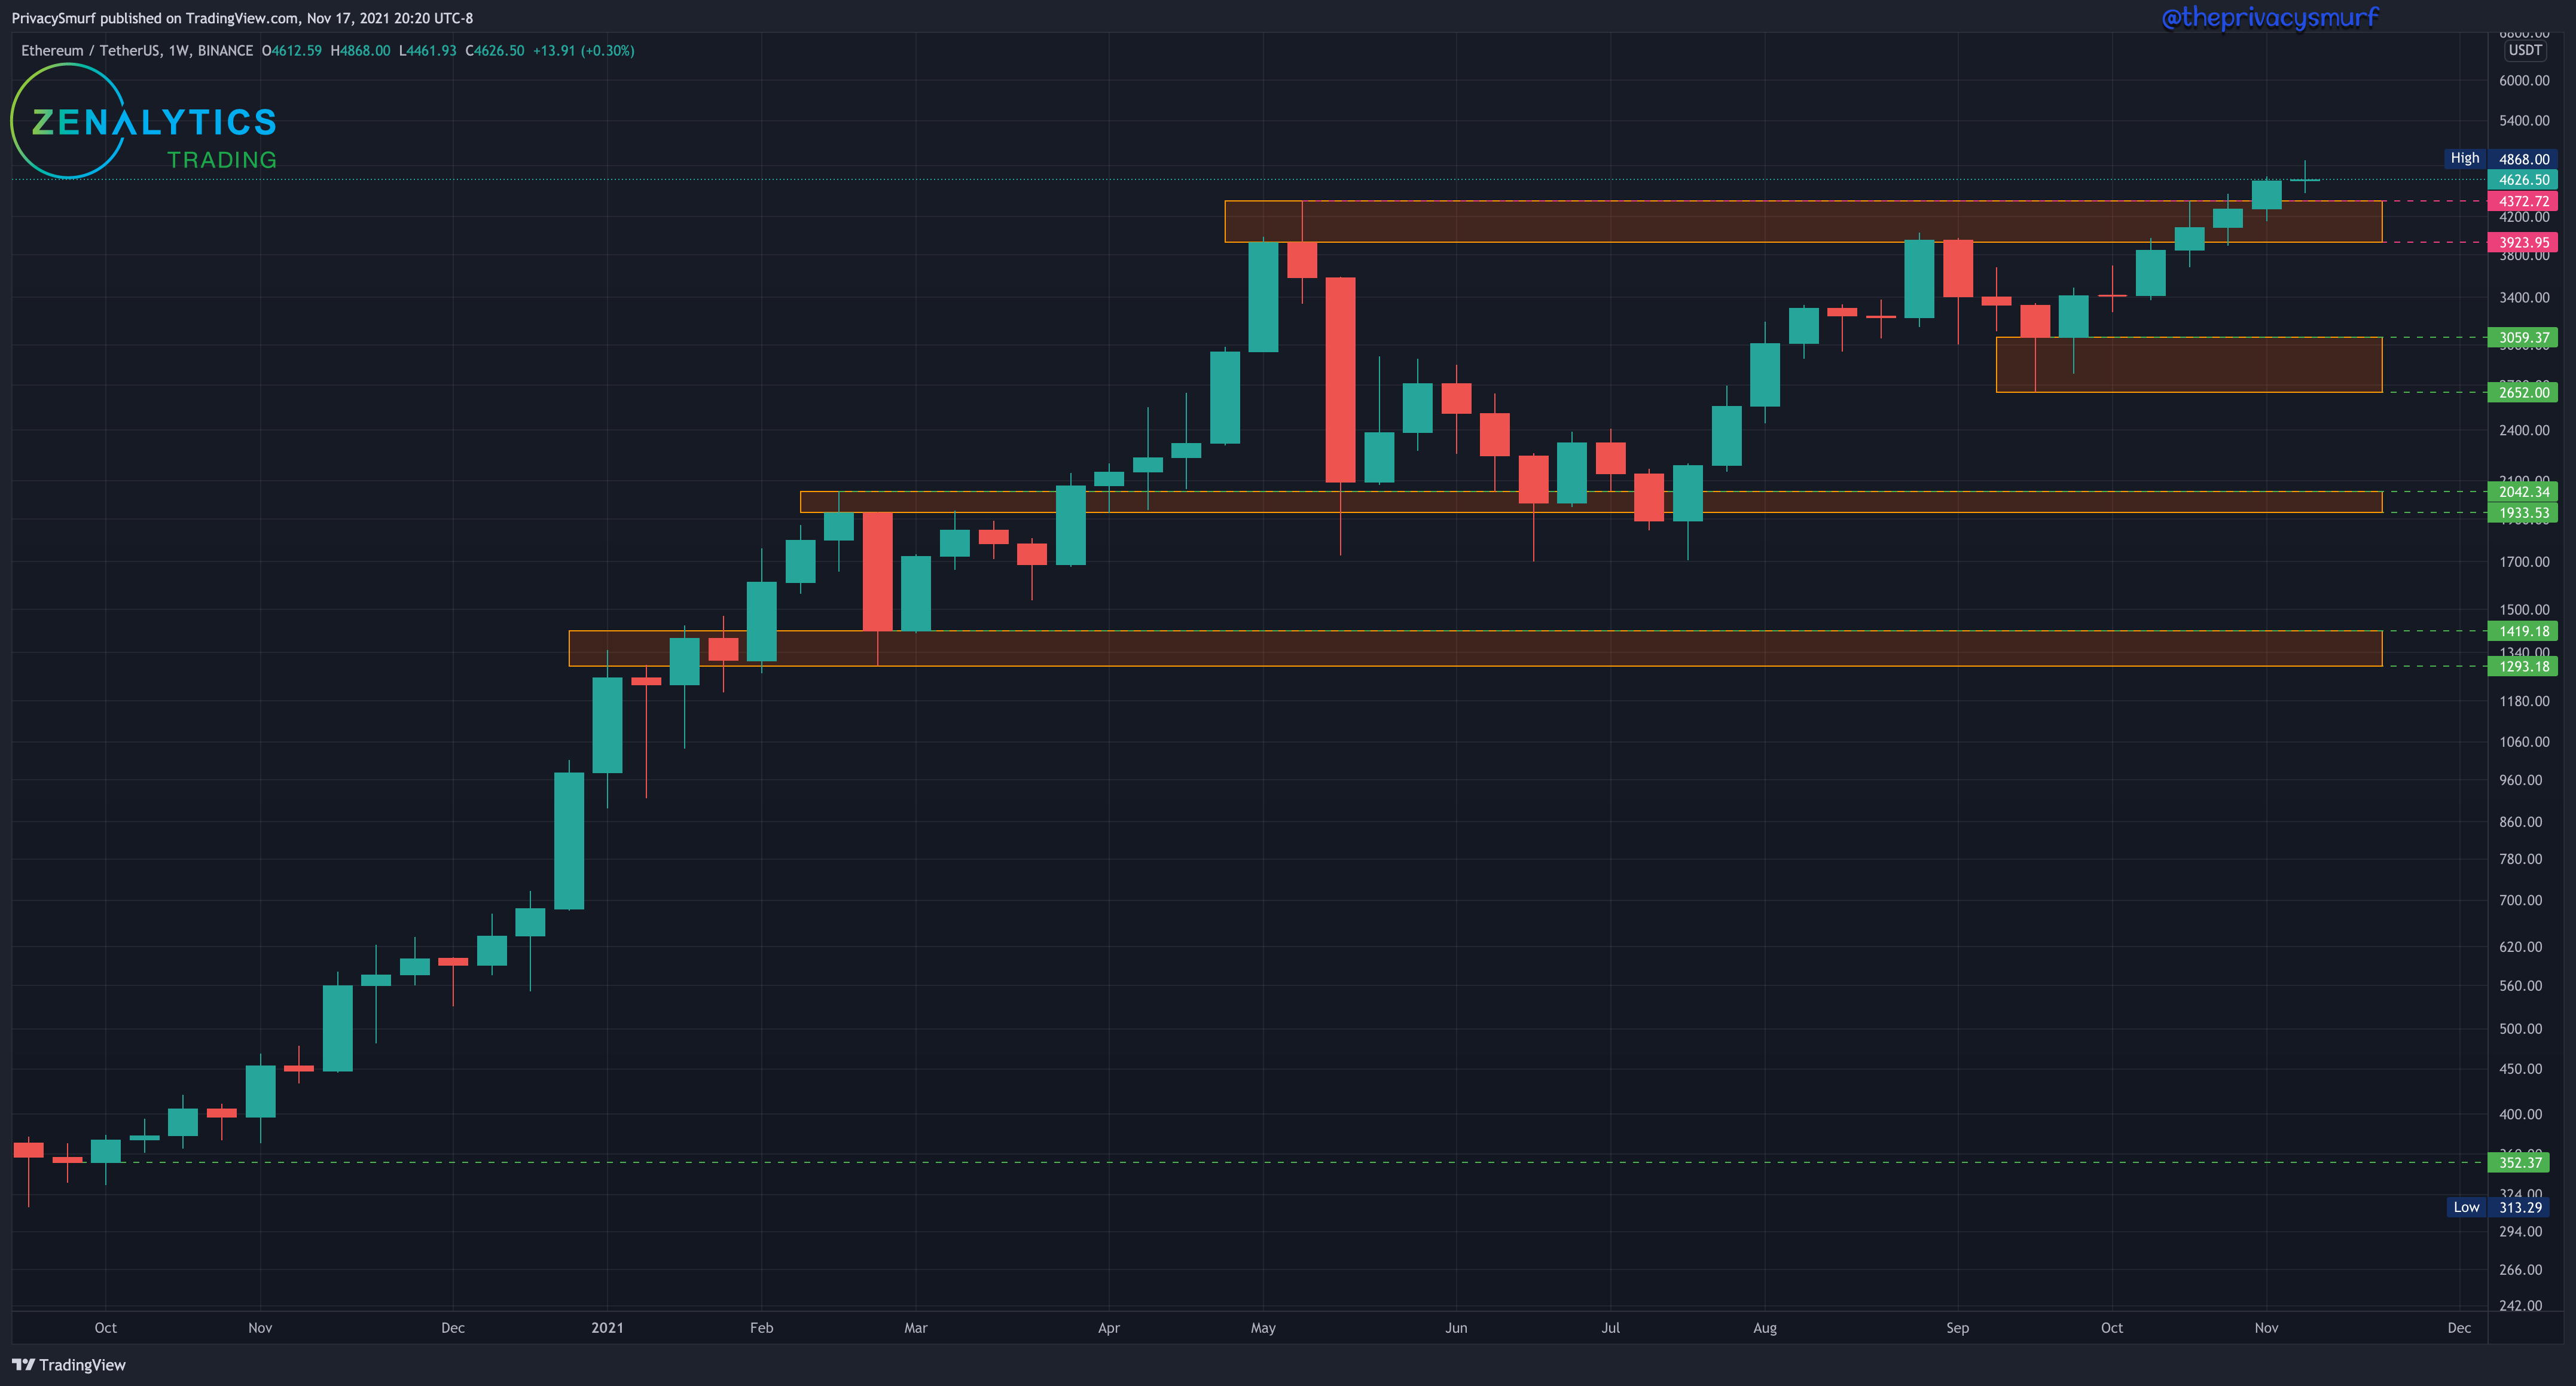
We see the past week closed as a Doji, a small body with the close near the open, and longer wicks to both sides. This is a signal of indecision. It’s also the middle part of a evening star candle pattern If next week closes bearish it’s a pretty standard reversal signal to many traders. The weekly chart is still bullish but this would give me pause on trading the breakout of the new highest weekly close two weeks ago.
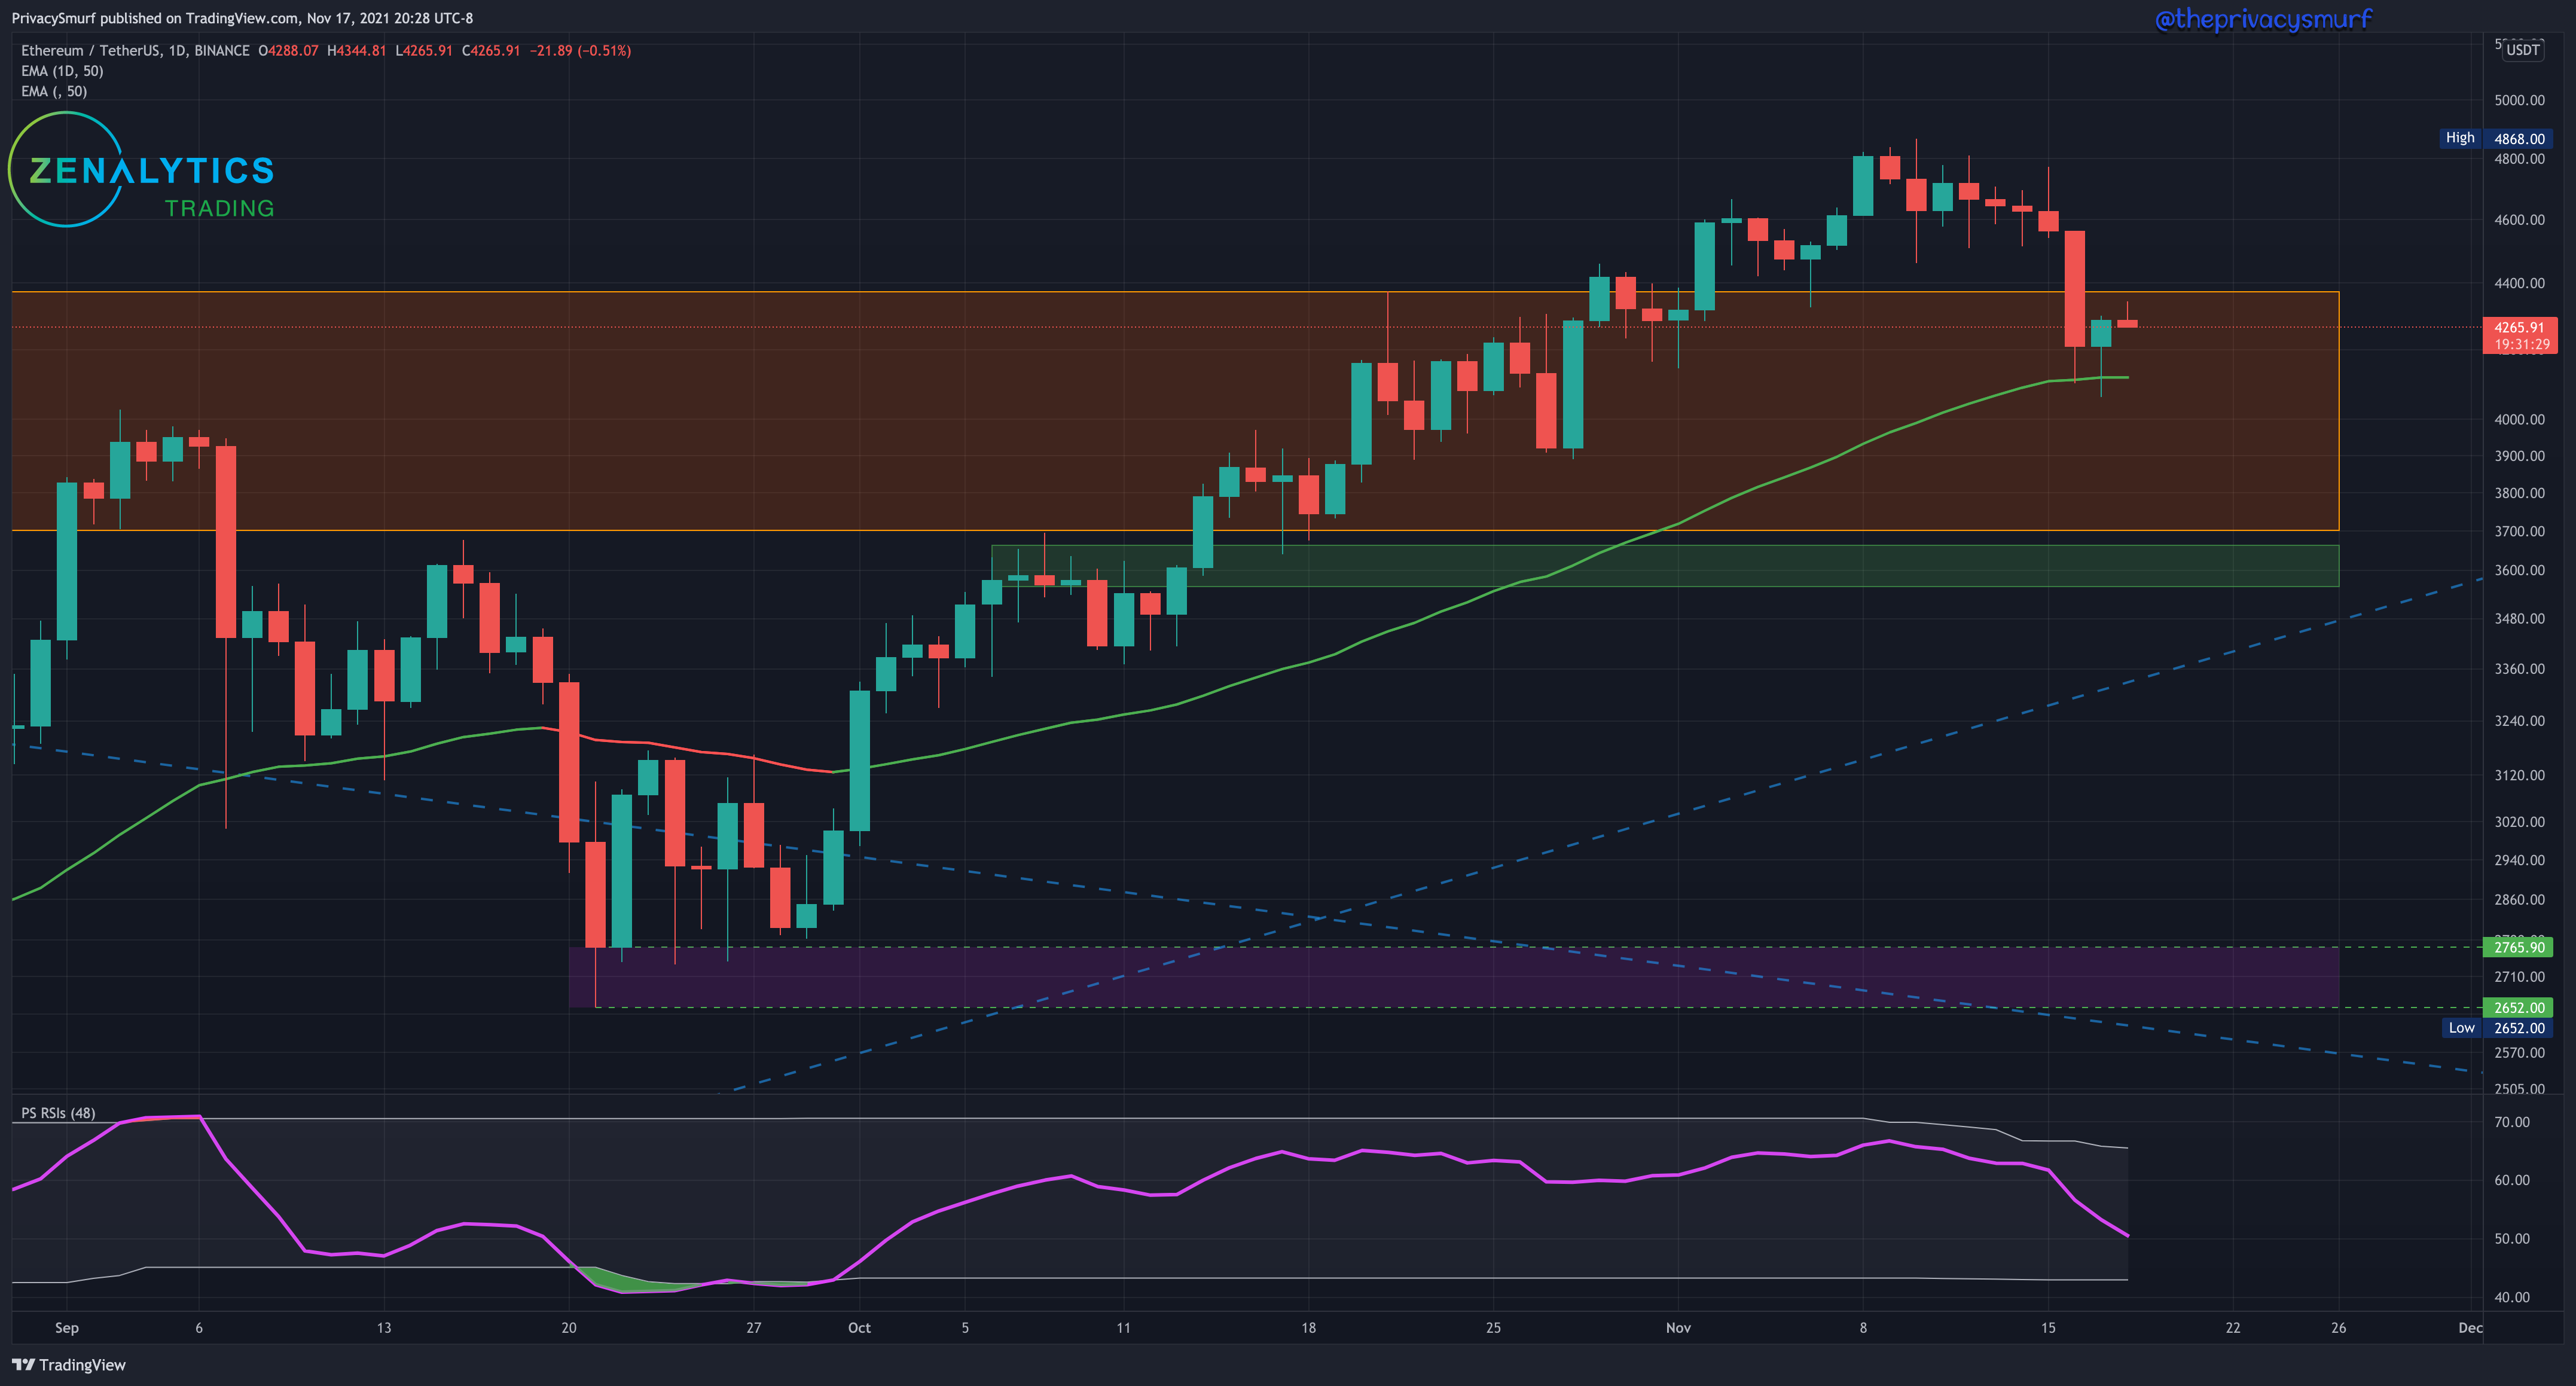
It would appear here that the sustained buy button that was being held down for the last few weeks was finally let go, haha. There wasn’t any bearish divergence on the daily timeframe for ETH so it has a stronger bullish setup compared to BTC dispute the similar-looking charts. If the EMA fails I’d expect support starting around $3900. The juicy buy zone for ETH feels pretty far away. There’d have to be a pretty large correction to be reached.
Looking intraday we see the same small bullish divergence between price and the RSI and a similar price compression between the 50-day EMA and 50-period EMA like on the BTC chart, but ETH has already set higher highs. A break of the top band on the RSI if testing the 50-period EMA above may lead to a bullish breakout.
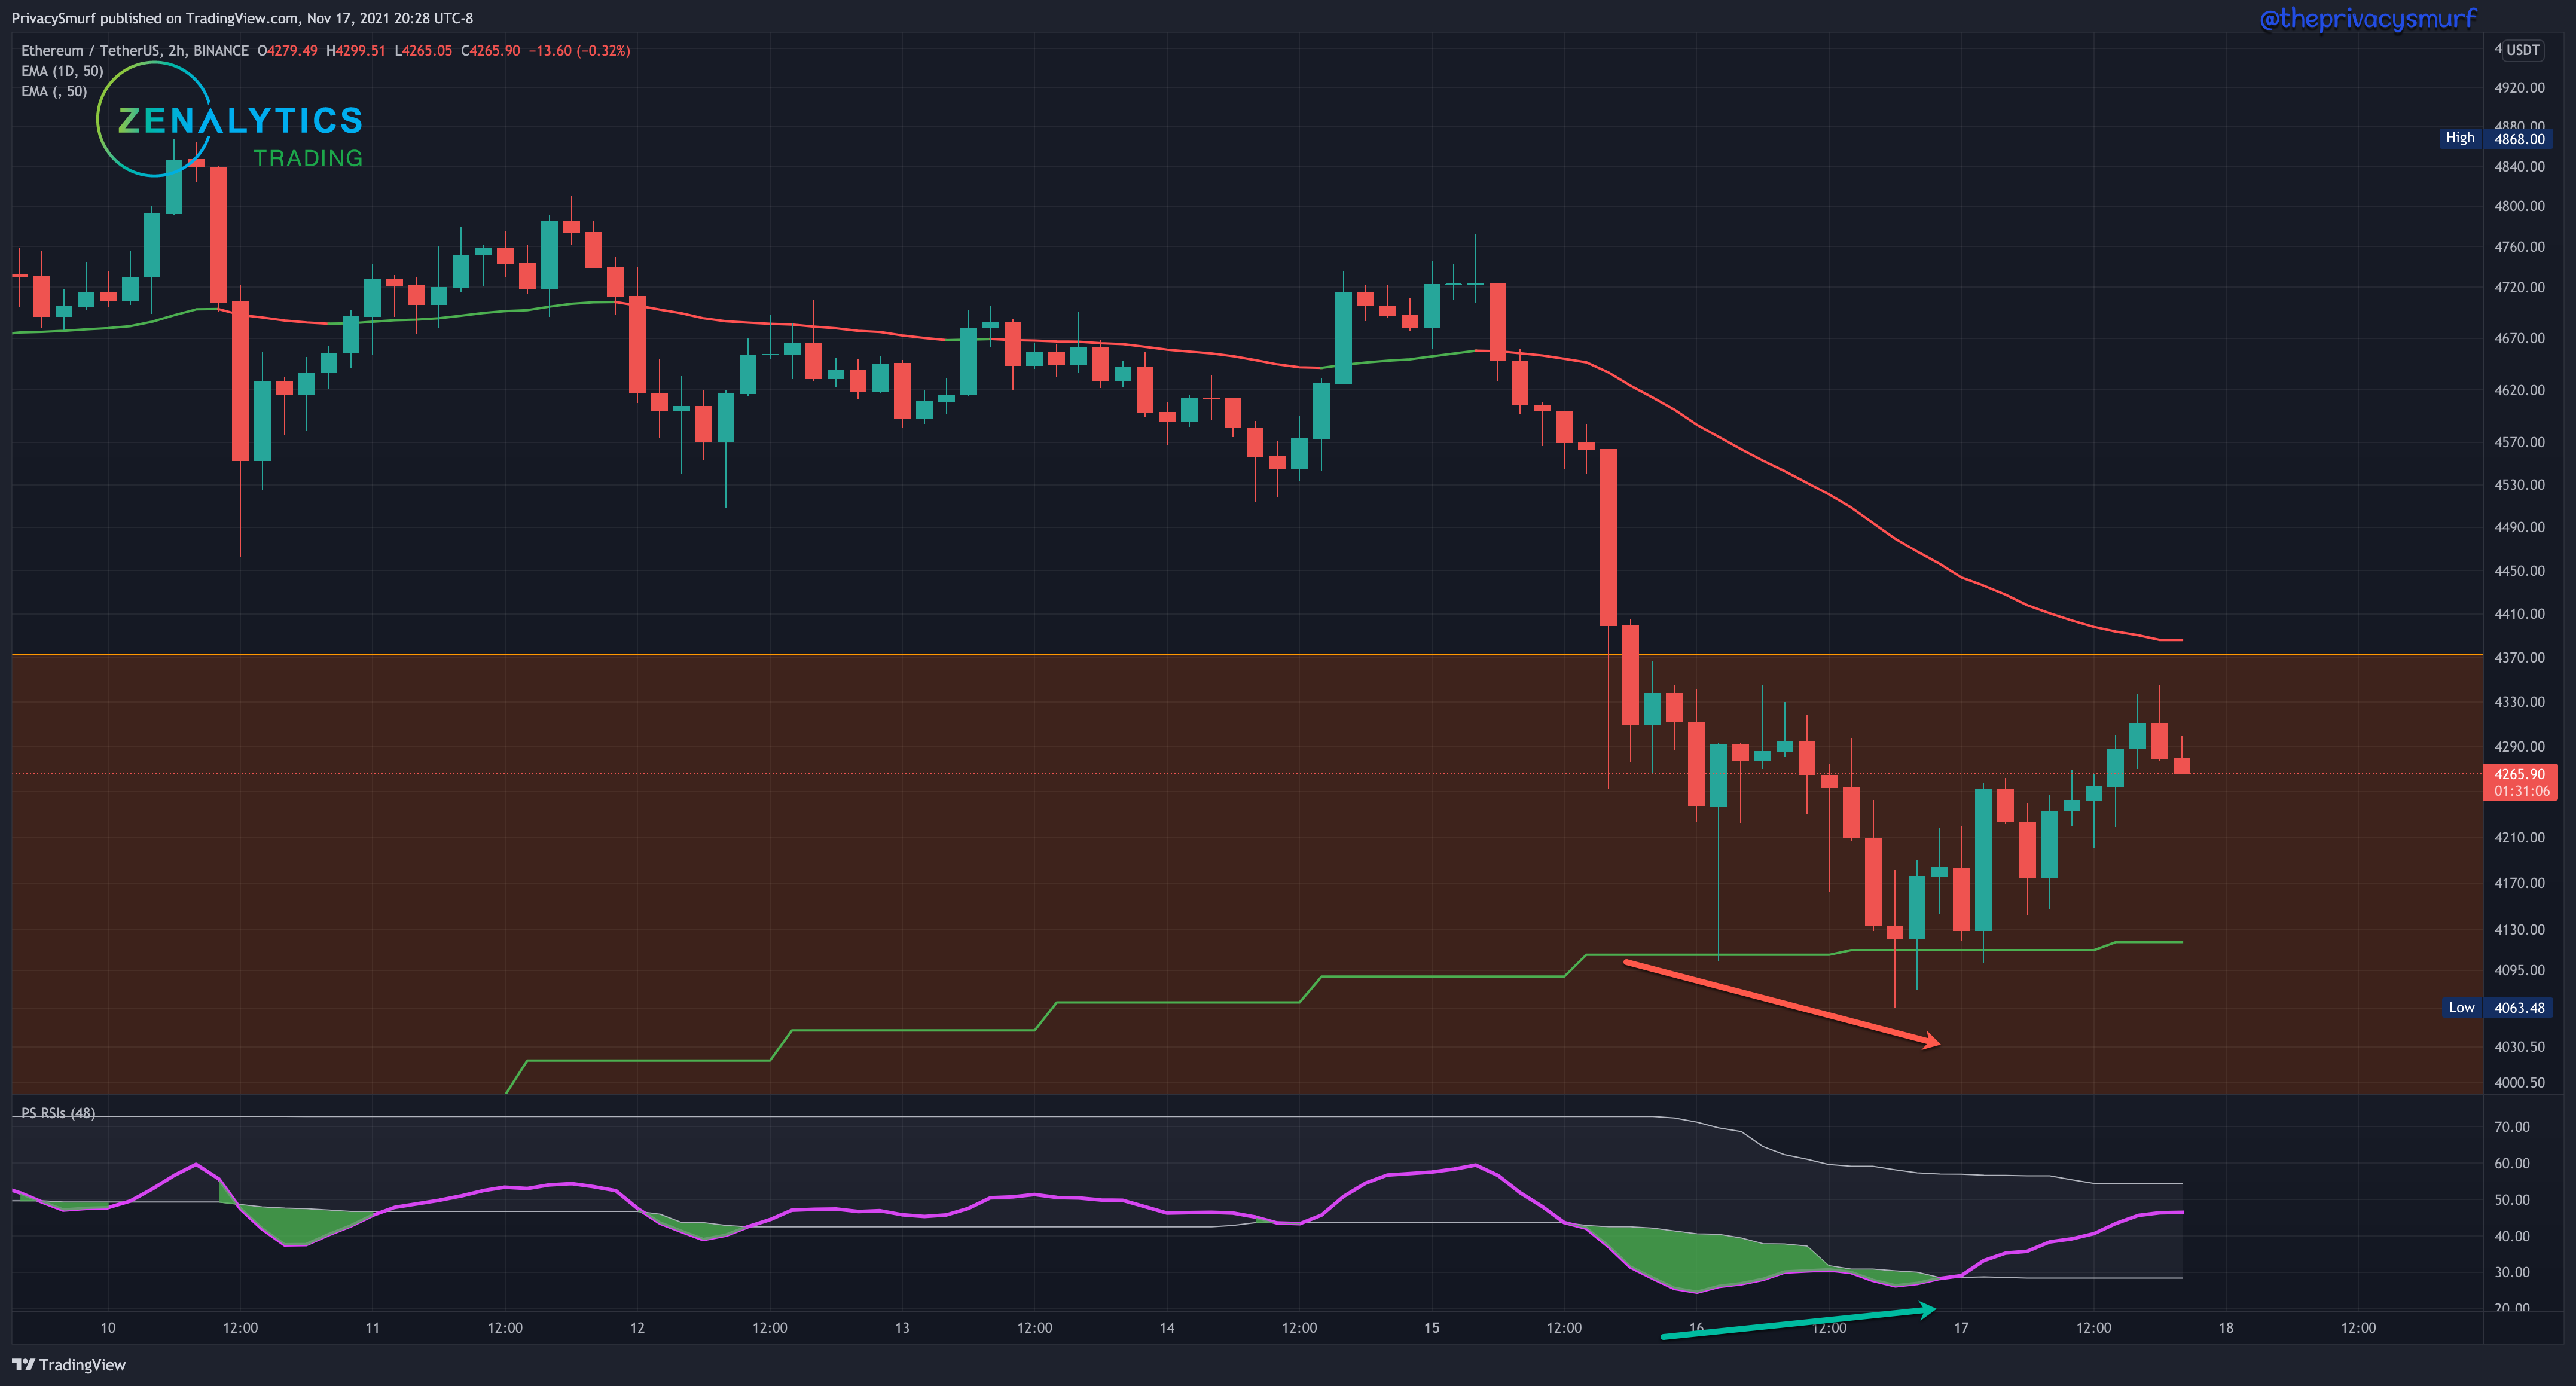
Here, just like BTC this setup is a waiting game over the rest of the week until the price has consolidated to a smaller point and is forced to react with volatility up or down. I’m leaning up at the moment.
The topical Thursday post tomorrow is about an interesting thought train I was on yesterday while running some 80/20s at the soccer field by my place. I’ll get the alt coin post out soon. Hard to give a day at the moment. I’ve got lots to catch up on. Sunday will be the return of the typical Sunday Synopsis.
See you tomorrow,
@theprivacysmurf