

On point.

Yesterday I posted this video talking about the new live cycle models. Take note of this portion at the 2:37 minute mark.
Here’s how that has played out, presenting a perfect short opportunity identified well ahead of time.
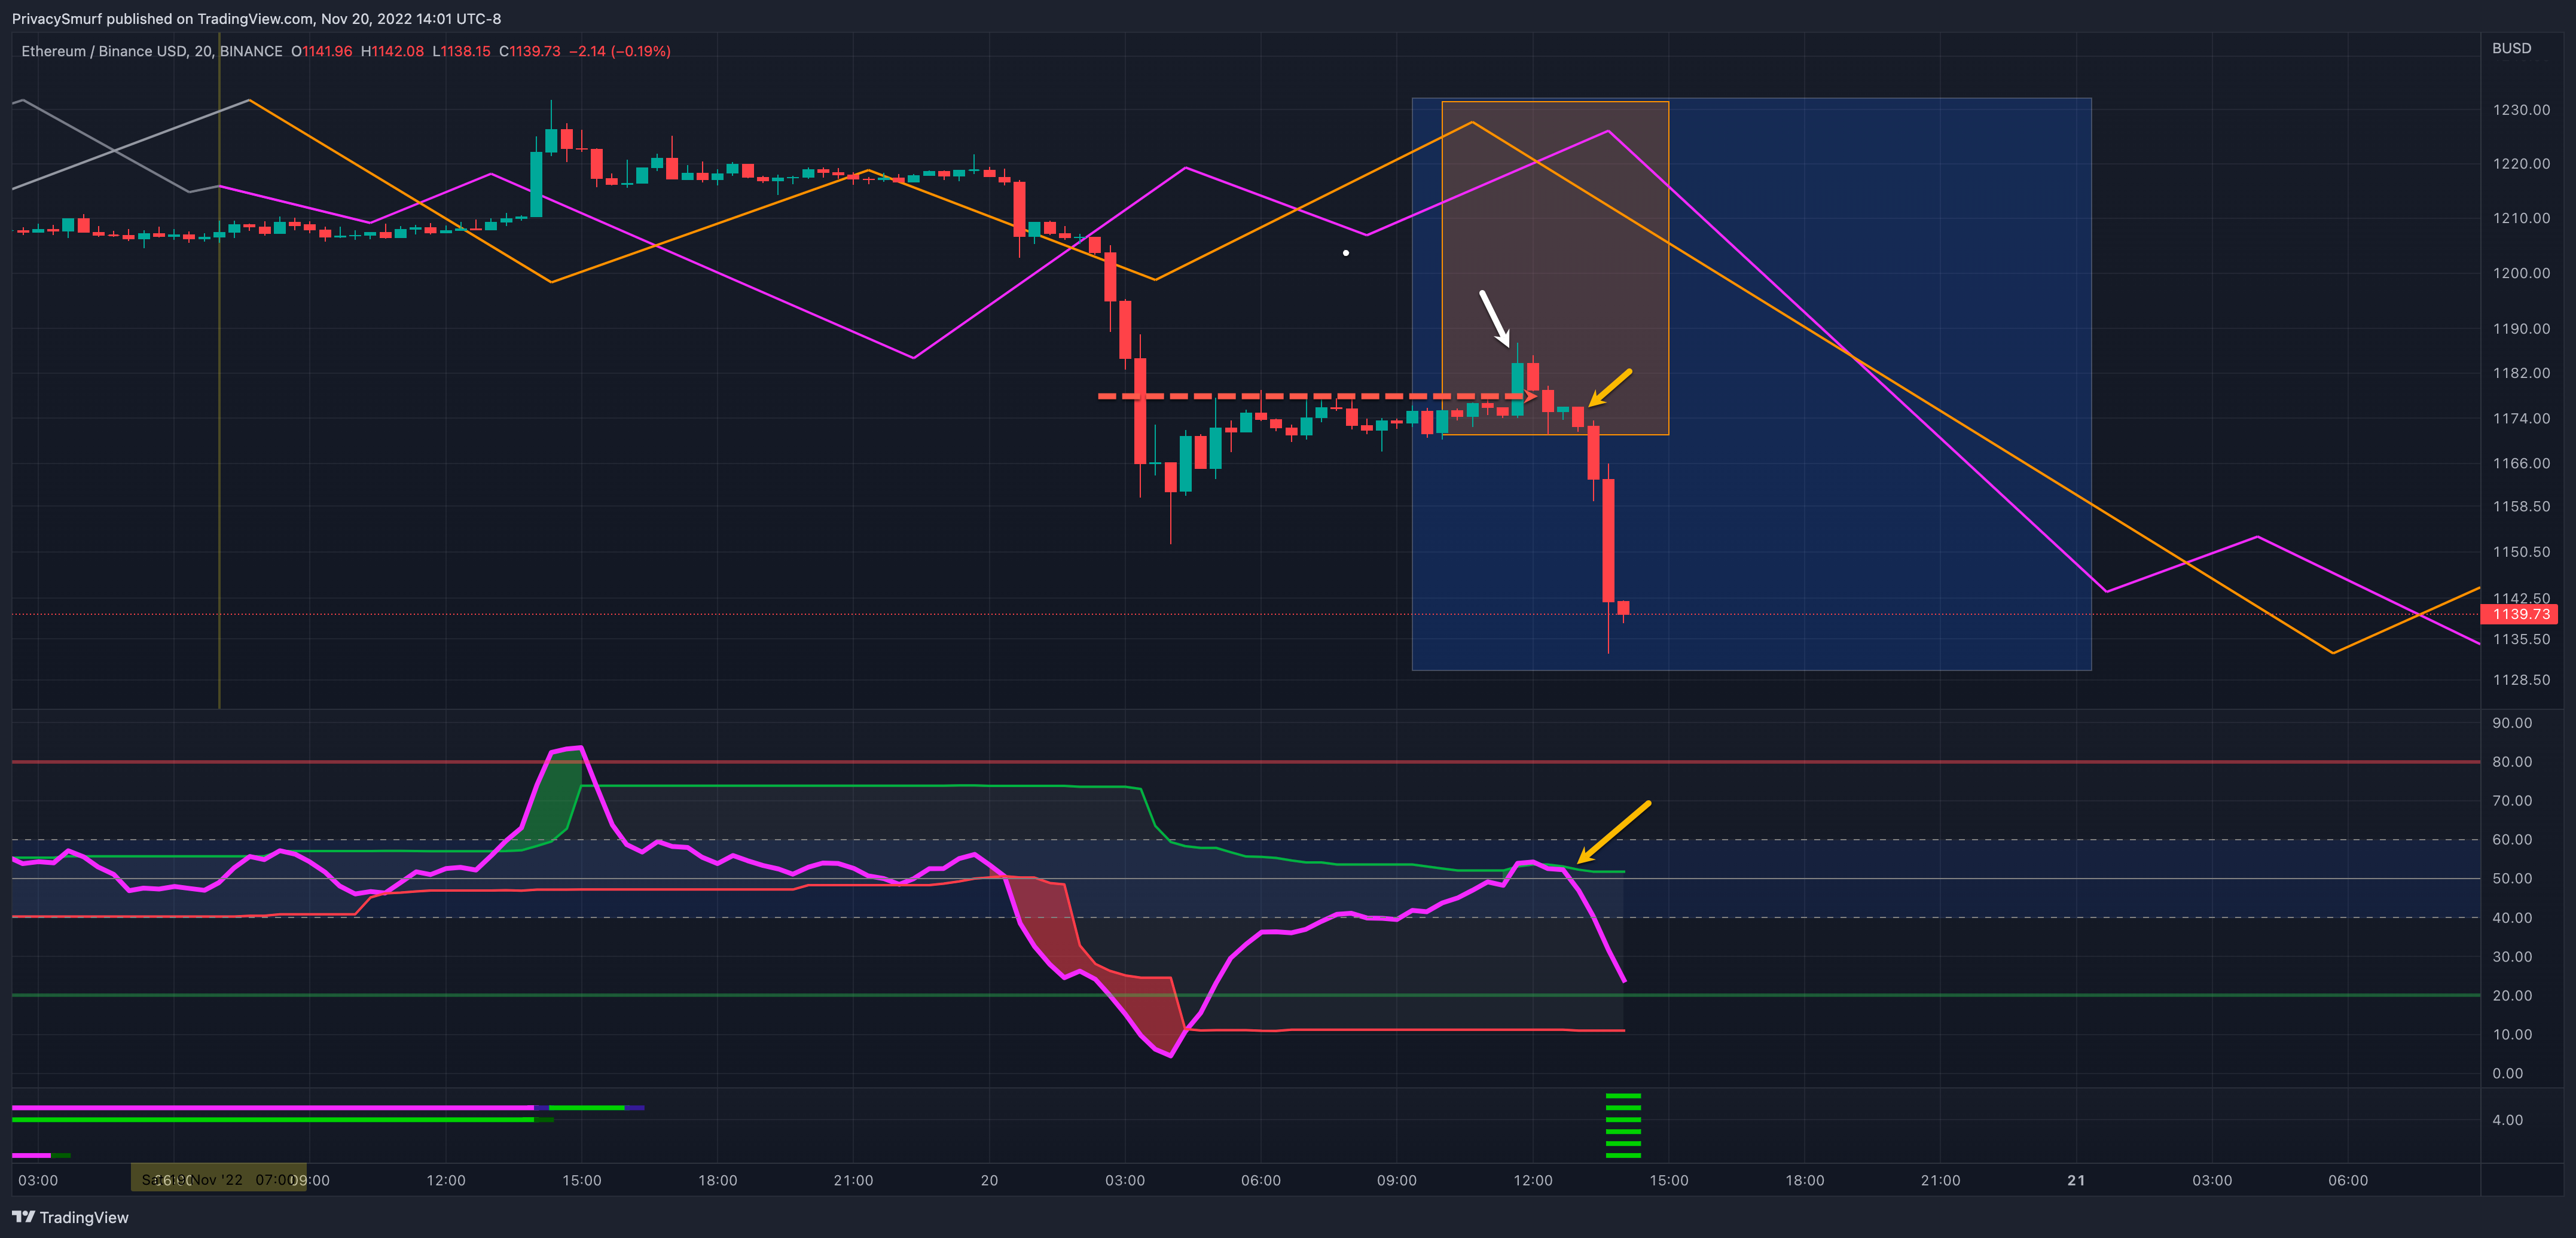
After the price entered the peaking window, there was a failed breakout above resistance (white arrow and red dashed line). After falling back under the resistance, a bearish engulfing candle was created at the same time the RSI crossed under the midline suggesting a transition to a bearish influence on price (yellow arrows). The combination of the technical signals on top of a cyclical peak and bearish alignment makes for a good probability of a successful short.
I hope you are as excited to experiment and trade with the models as I am to get them in your hands and on your charts. These are exclusive to the paid packages on the site.
If you haven’t at least registered for the free side, you should. I’ll be posting the Sunday synopsis there tonight. I will include it in the substack email until the end of the year, and then the substack will be offline.
Here’s the post talking about the division of the sections.

Here’s the video talking about registering at https://www.zenalytics.info
See you there!
@theprivacysmurf