

Party Week: Day 1
Party Week: Day 1
There's a party goin' on right here. A celebration to last throughout the years. So bring your good times and your laughter too. We gonna celebrate and party with you. Come on now.


With all the excitement across the market, this will be a slightly different week of posts.I’ve got a lot of really interesting study projects to share with you all. On top of all that it’s been an intraday trading bonanza out there. Today will be the weekly update. Tuesday for the paid subscribers I’ll do a quick update of the cycles from the Q4 forecast. Wednesday for all subscribers I’ll highlight a few macro indicators I’m looking at. Thursday for the paid folks will be a typical Topical Thursday. Friday will be a surprise for everyone. Saturday will be a big altcoin showcase for paid subscribers so comment your suggestions. I’ll commit to at least 20, over the typical 4 or 5. Sunday will be a return to the Sunday Synopsis as usual.

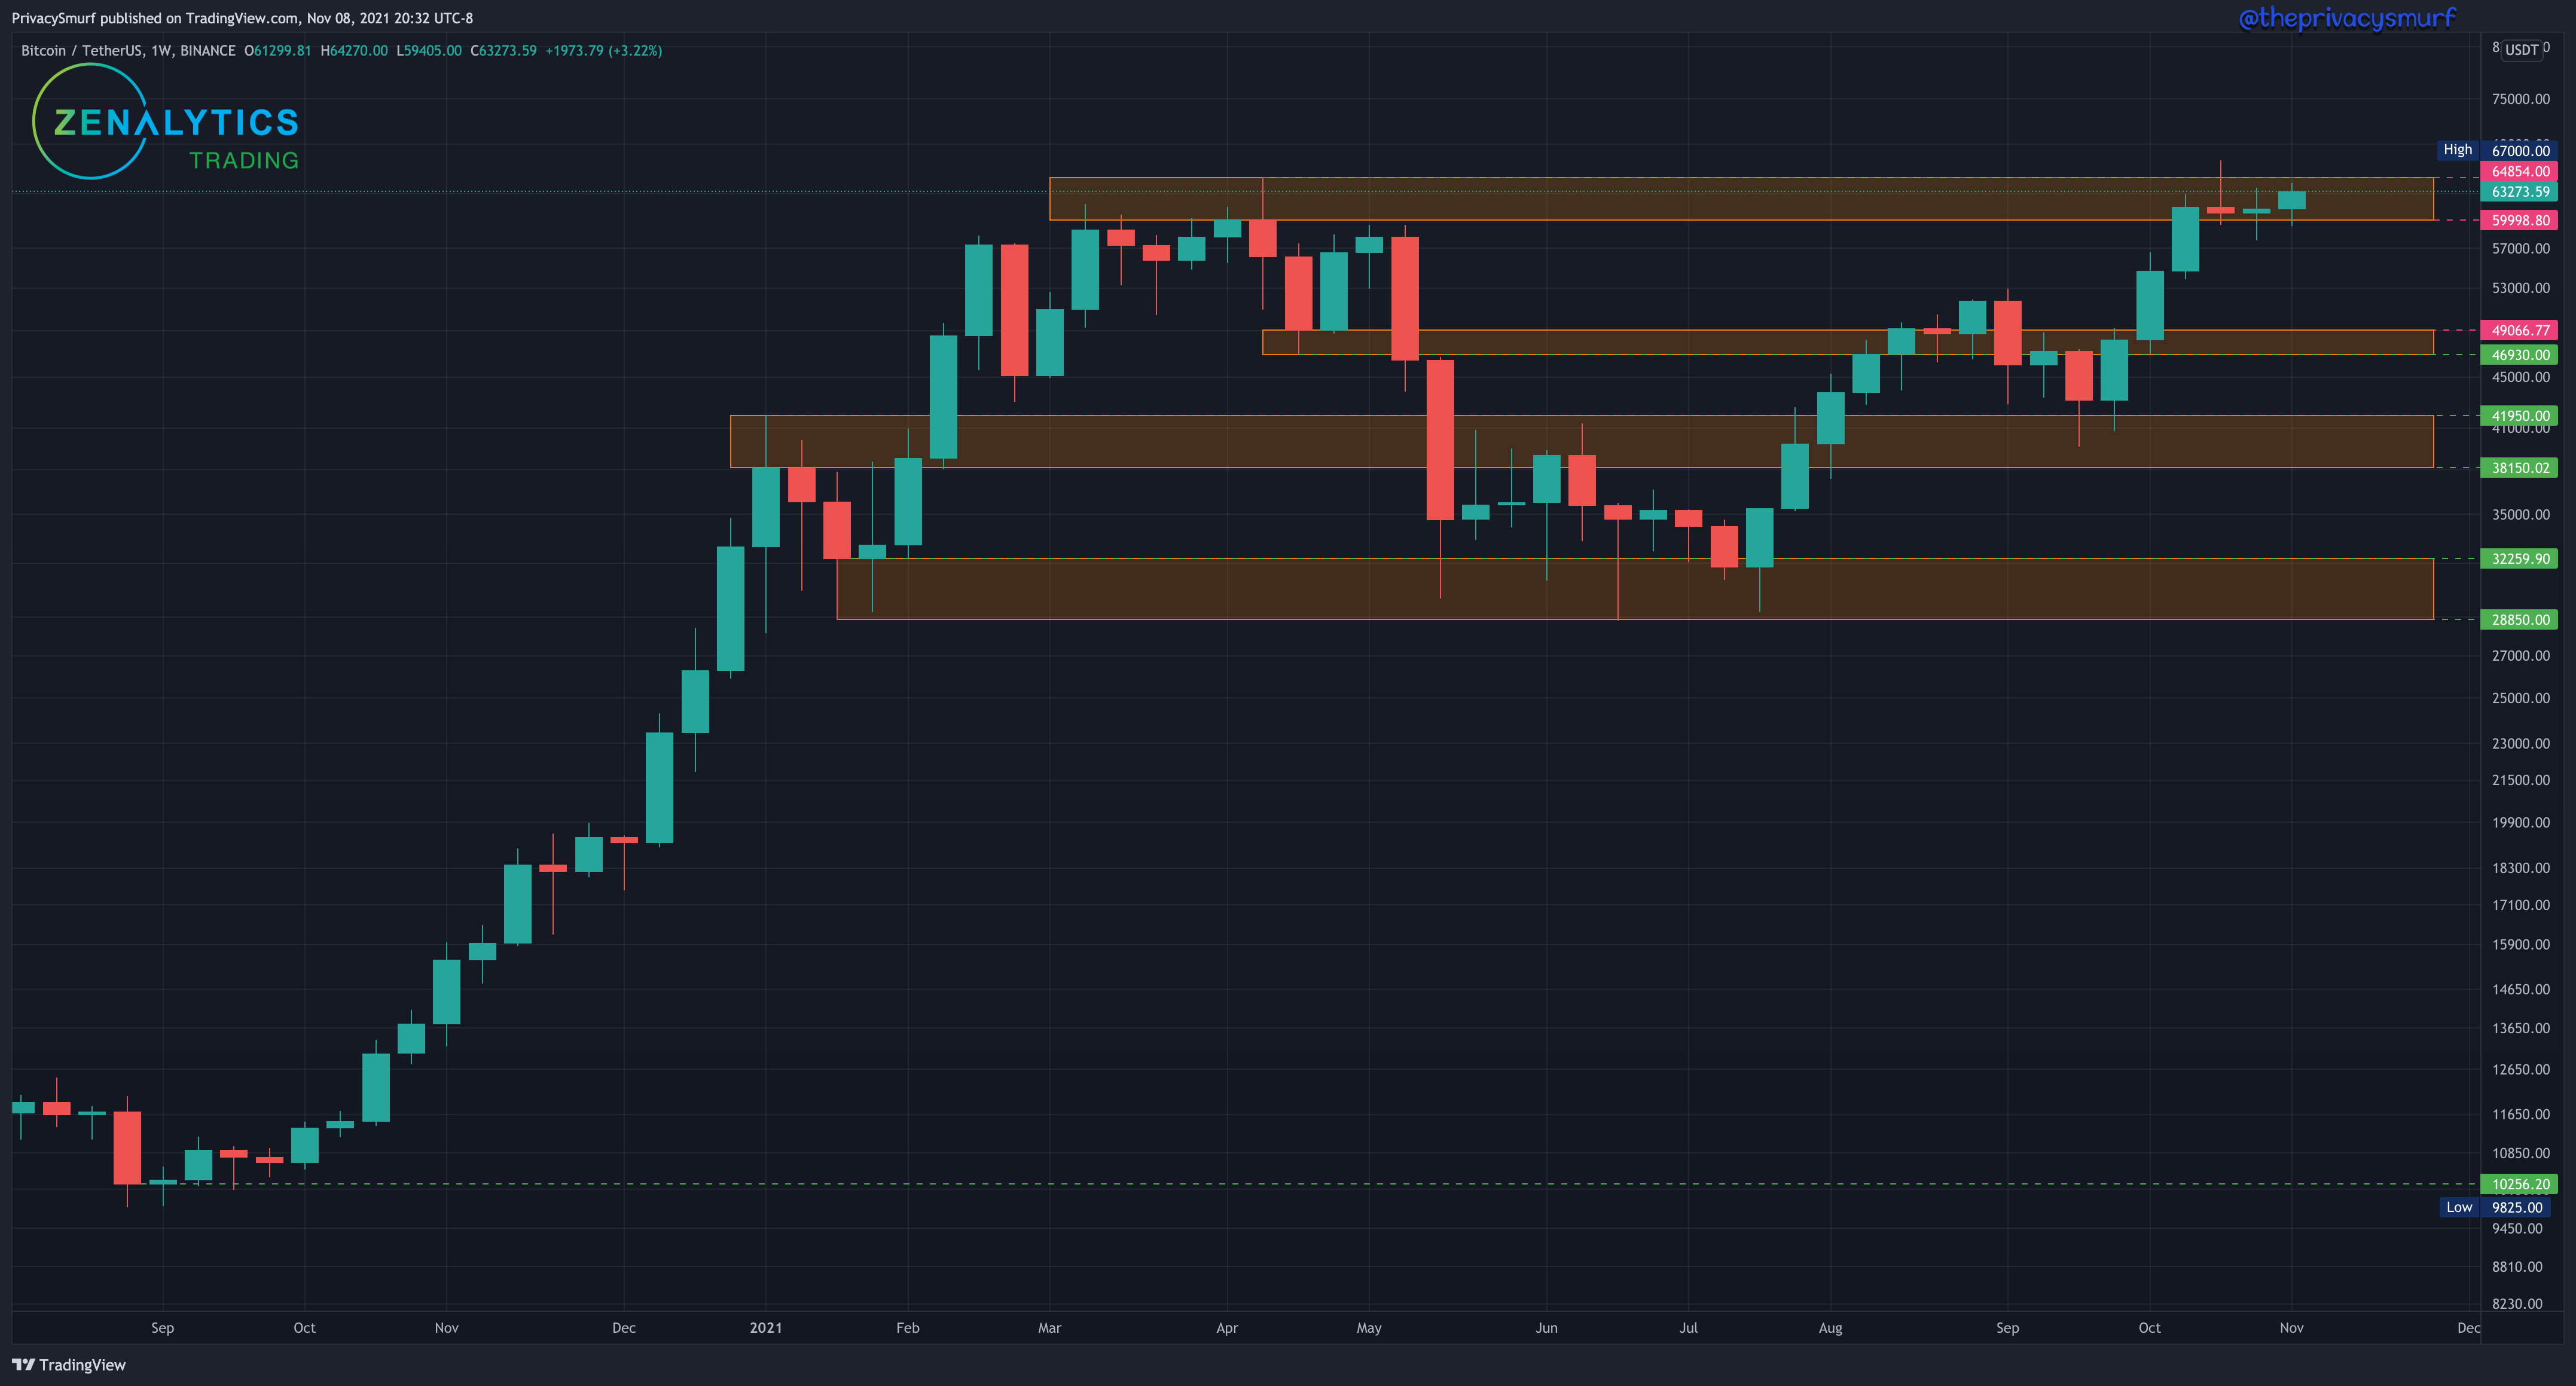
BTC/USDT ← chart link
Perhaps I should call BTC weak more often. The bullish bias last week was the right one to have. BTC finished off the week with a new highest weekly close. If this week can close above the ATH we could see some great movement and price appreciation. This bottom of this top zone will likely still as a form of market structure support. closing below it will likely see prices continuing down. I see no reason to change the bullish bias with this picture.
This shot of the daily chart includes the new week. Sunday while prepping the post the market was popping off and I had a feeling a lot of what I would have included could easily be invalidated so I opted to see how things played out before making any rushed assessments. Here we see a new highest daily close to go with last week’s highest weekly close. This is also bullish but something to keep aware of is the bearish divergence that has been formed by this new high. The RSI is not setting a new higher high. This divergence can be invalidated if the RSI catches up and pops up over 80 though. During the parabolic bullish periods these divergences do often get invalidated so it’s not an immediate worry, but the more times they keep popping up the more worrisome it becomes. Also, something to consider, even if this divergence does lead to a pullback it could equate to a support test of the previous high range resistance around $64k. Still a bullish bias but some caution. A retest is on the horizon. How BTC deals with that is anyone’s guess. Highs like this are notoriously tricky to analyze. I’d not be concerned with significantly lower prices unless we get a daily close or two under $60688.

Looking intraday at the 2HR chart we see another bearish divergence indicating a potential pullback. I’d be watching the $66.3k area for the first bit of support but I wouldn’t rule out a test of the last range high around $65k. When the markets get super bullish I like to throw on a new moving average. The 8-period moving average of lows. Notice where once BTC took off and slowed down to consolidate around $65900 it tapped the moving average while forming a bullish engulfing candle and took off again. This is not an uncommon phenomenon. It’s a great line plot to include when things get to moving up quickly. As long as momentum is in line with the price action I often look to this moving average for reentry on short-term intraday trades.


ETH-BTC ← chart link
Another week of price action in line with the analysis. Another bullish close on the week that is also above a previous resistance. There's still plenty of close resistance above the price so I’m not expecting to rocket through just yet on the weekly chart but I’m still operating with a bullish bias here. The daily chart will provide some more insight as well.
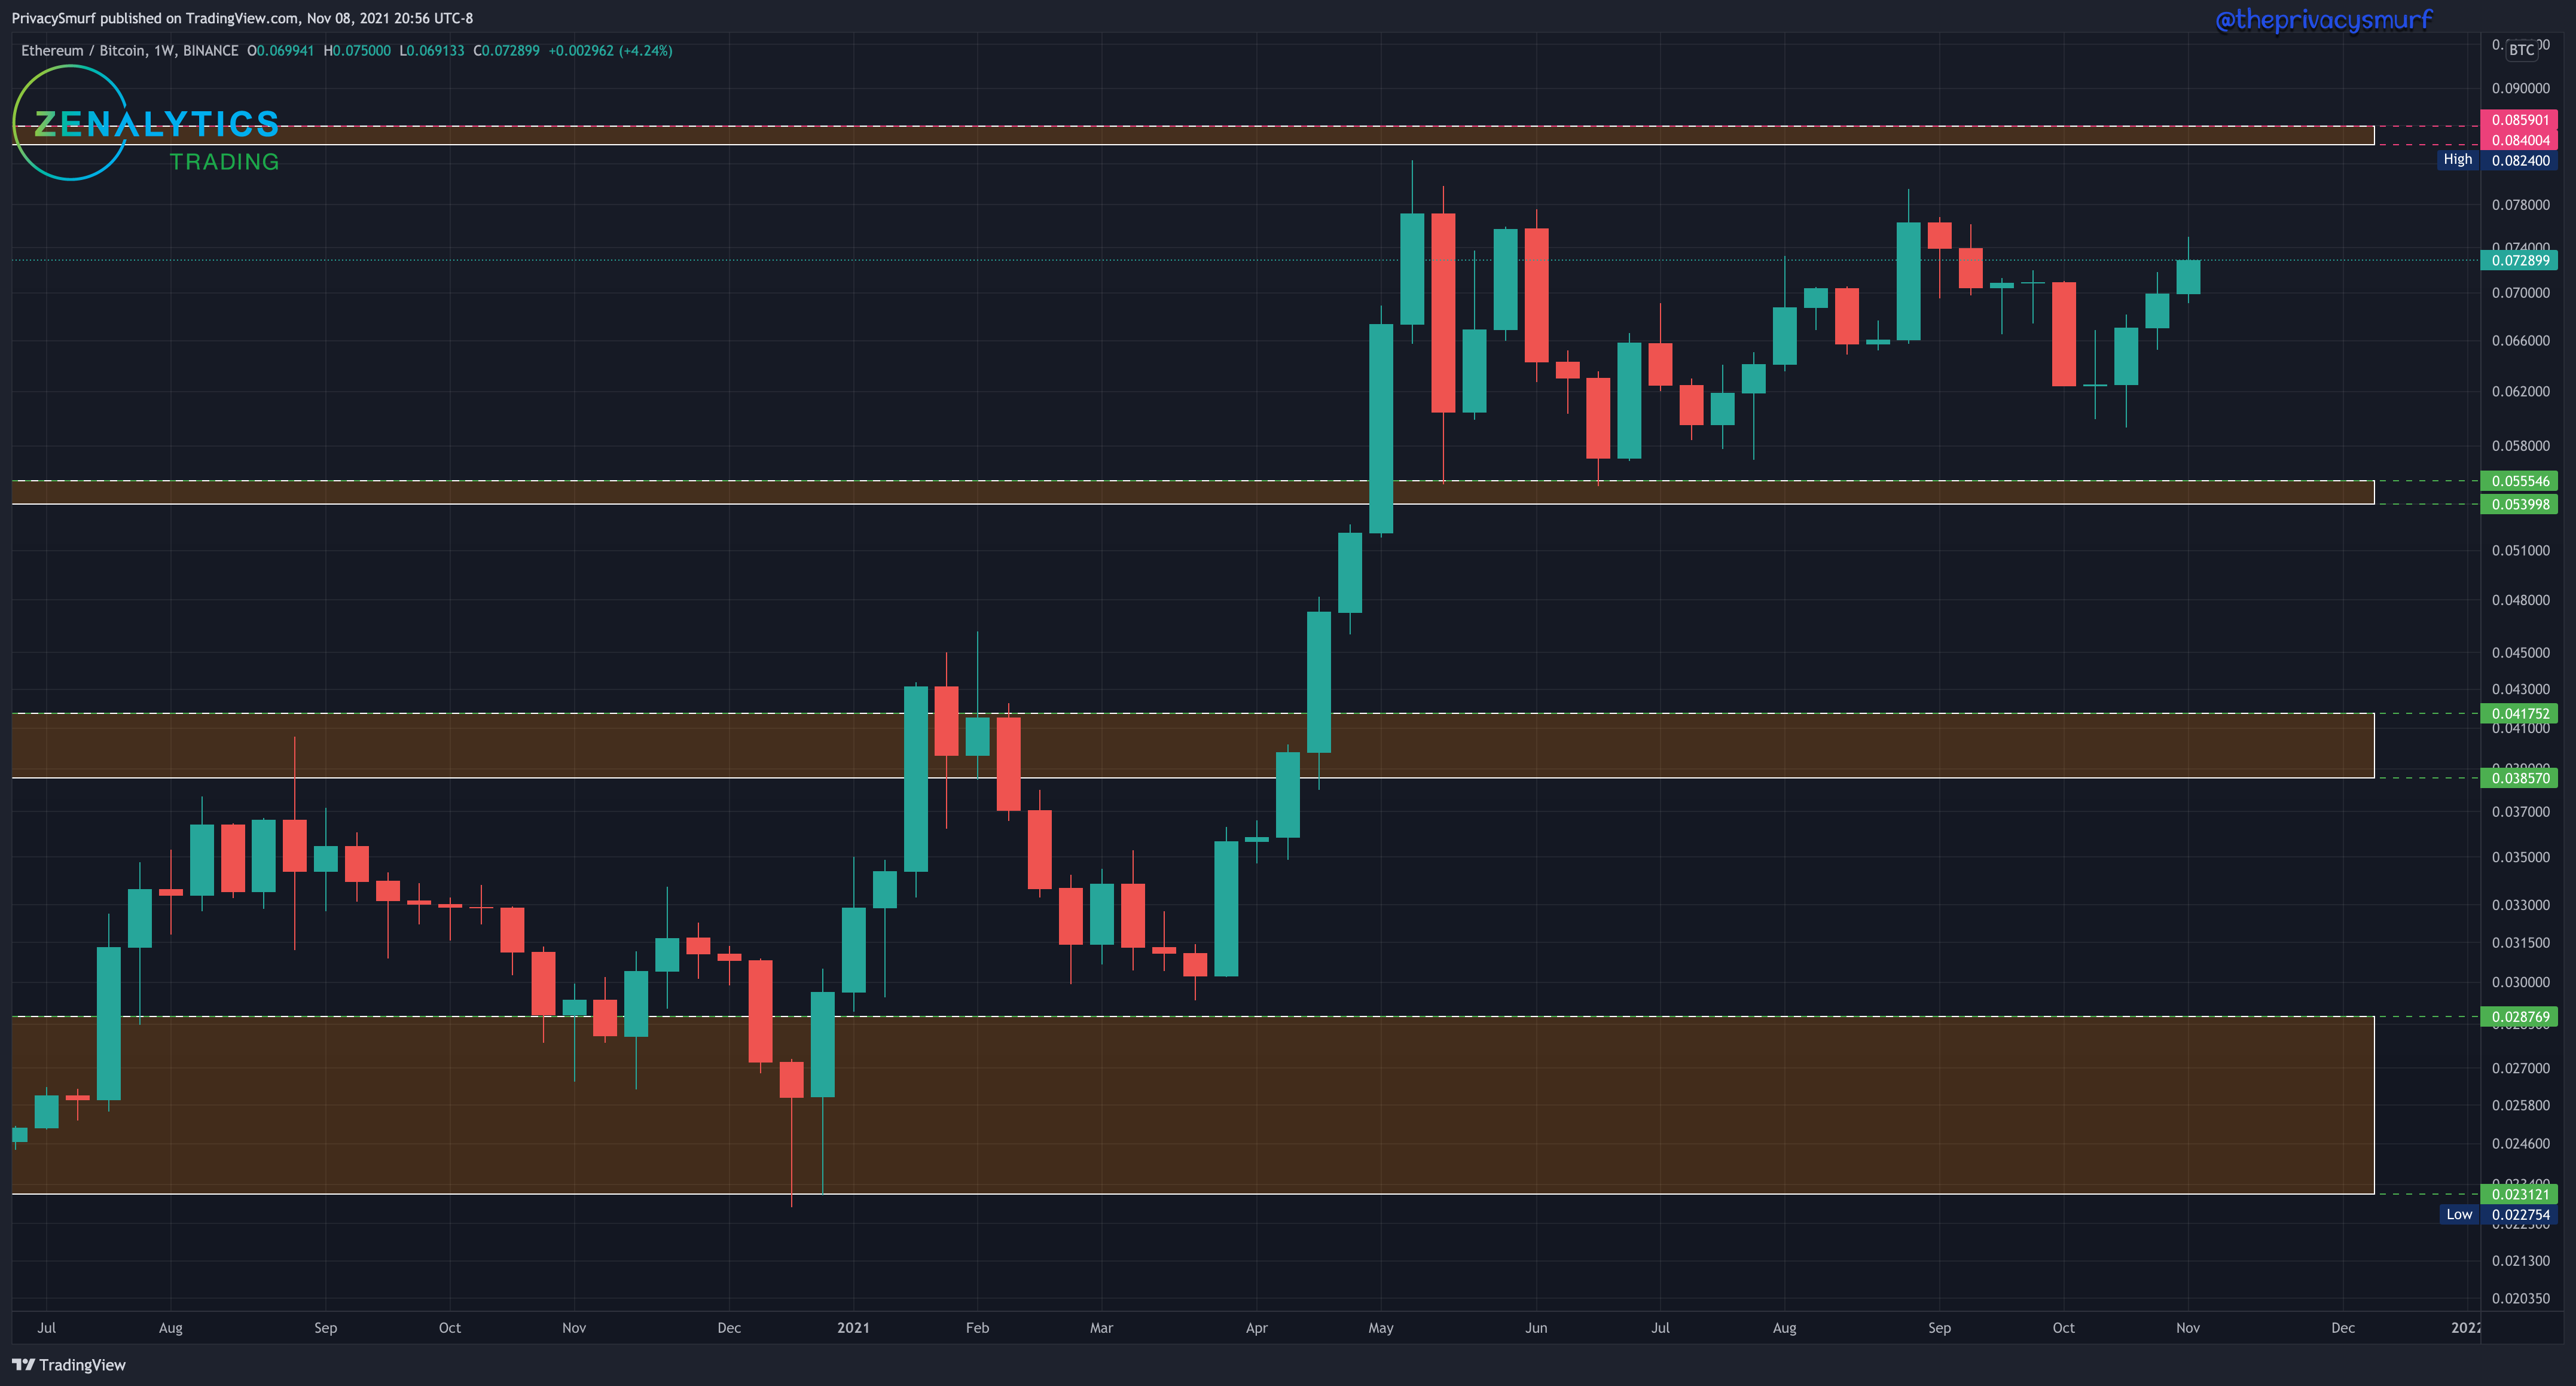
Last week I suggested the following…
If the value of 0.71098 can be broken there’s room to run towards 0.074-0.076 for ETH relative to BTC which will likely be reflected in the ALT market as well.
That ended up playing out shown below. At the moment the long-term ascending trendline is being tested for support after the breakout. If that fails I’d expect the price to fall down to the 50-Day EMA which also is at horizontal support at 0.068. This support is pretty critical to ETH keeping up with BTC. If it fails this means that BTC is on a wild ride by itself. The RSI is in line with the price so there are no hints into what may transpire. I suspect that a test of the midline on the RSI (50) will line up with the EMA and horizontal support test. I’m leaning bullish on that support holding but we’ll have to see when the price actually gets there to make that call.

Looking at an intraday chart you can see the 8-period moving average of lows again acting as great support during the strong bullish trends. Also one could draw an ascending trend line as well, but I tend to lean on moving averages and horizontal support more than trendlines if I can. Another thing I’d like to call attention to is the RSI bands on the bottom of the chart. Using the RSI script I modified in TradingView (a writeup about it can be found here) if you watch the adaptive bands, when the bottom band begins to creep up towards the midline line around 50 (show with the white arrows) when the RSI breaks below often it will correspond with a selloff. When this is happening I start to watch for a bullish divergence to form so I can look for a bullish entry. If you look around the 13th-15 on the chart you can see the inverse of this phenomenon where the top band moves down toward the midline, the rsi breaks above, the price shoots up and I start watching for a bearish divergence to trade a short to the downside. Side note, this small timeframe also supports the idea of a test of the 50-Day EMA and horizontal support.


ETH/USDT ← chart link
The bullish bias was not the wrong one to have this past week with ETH. A strong finish on the week set up ETH with a new highest weekly close. There’s no reason to suspect anything else but more bullishness with this picture so the daily chart will be needed for some more insight. Weekly lows if they come I’d expect to find some support at least in that top range zone.
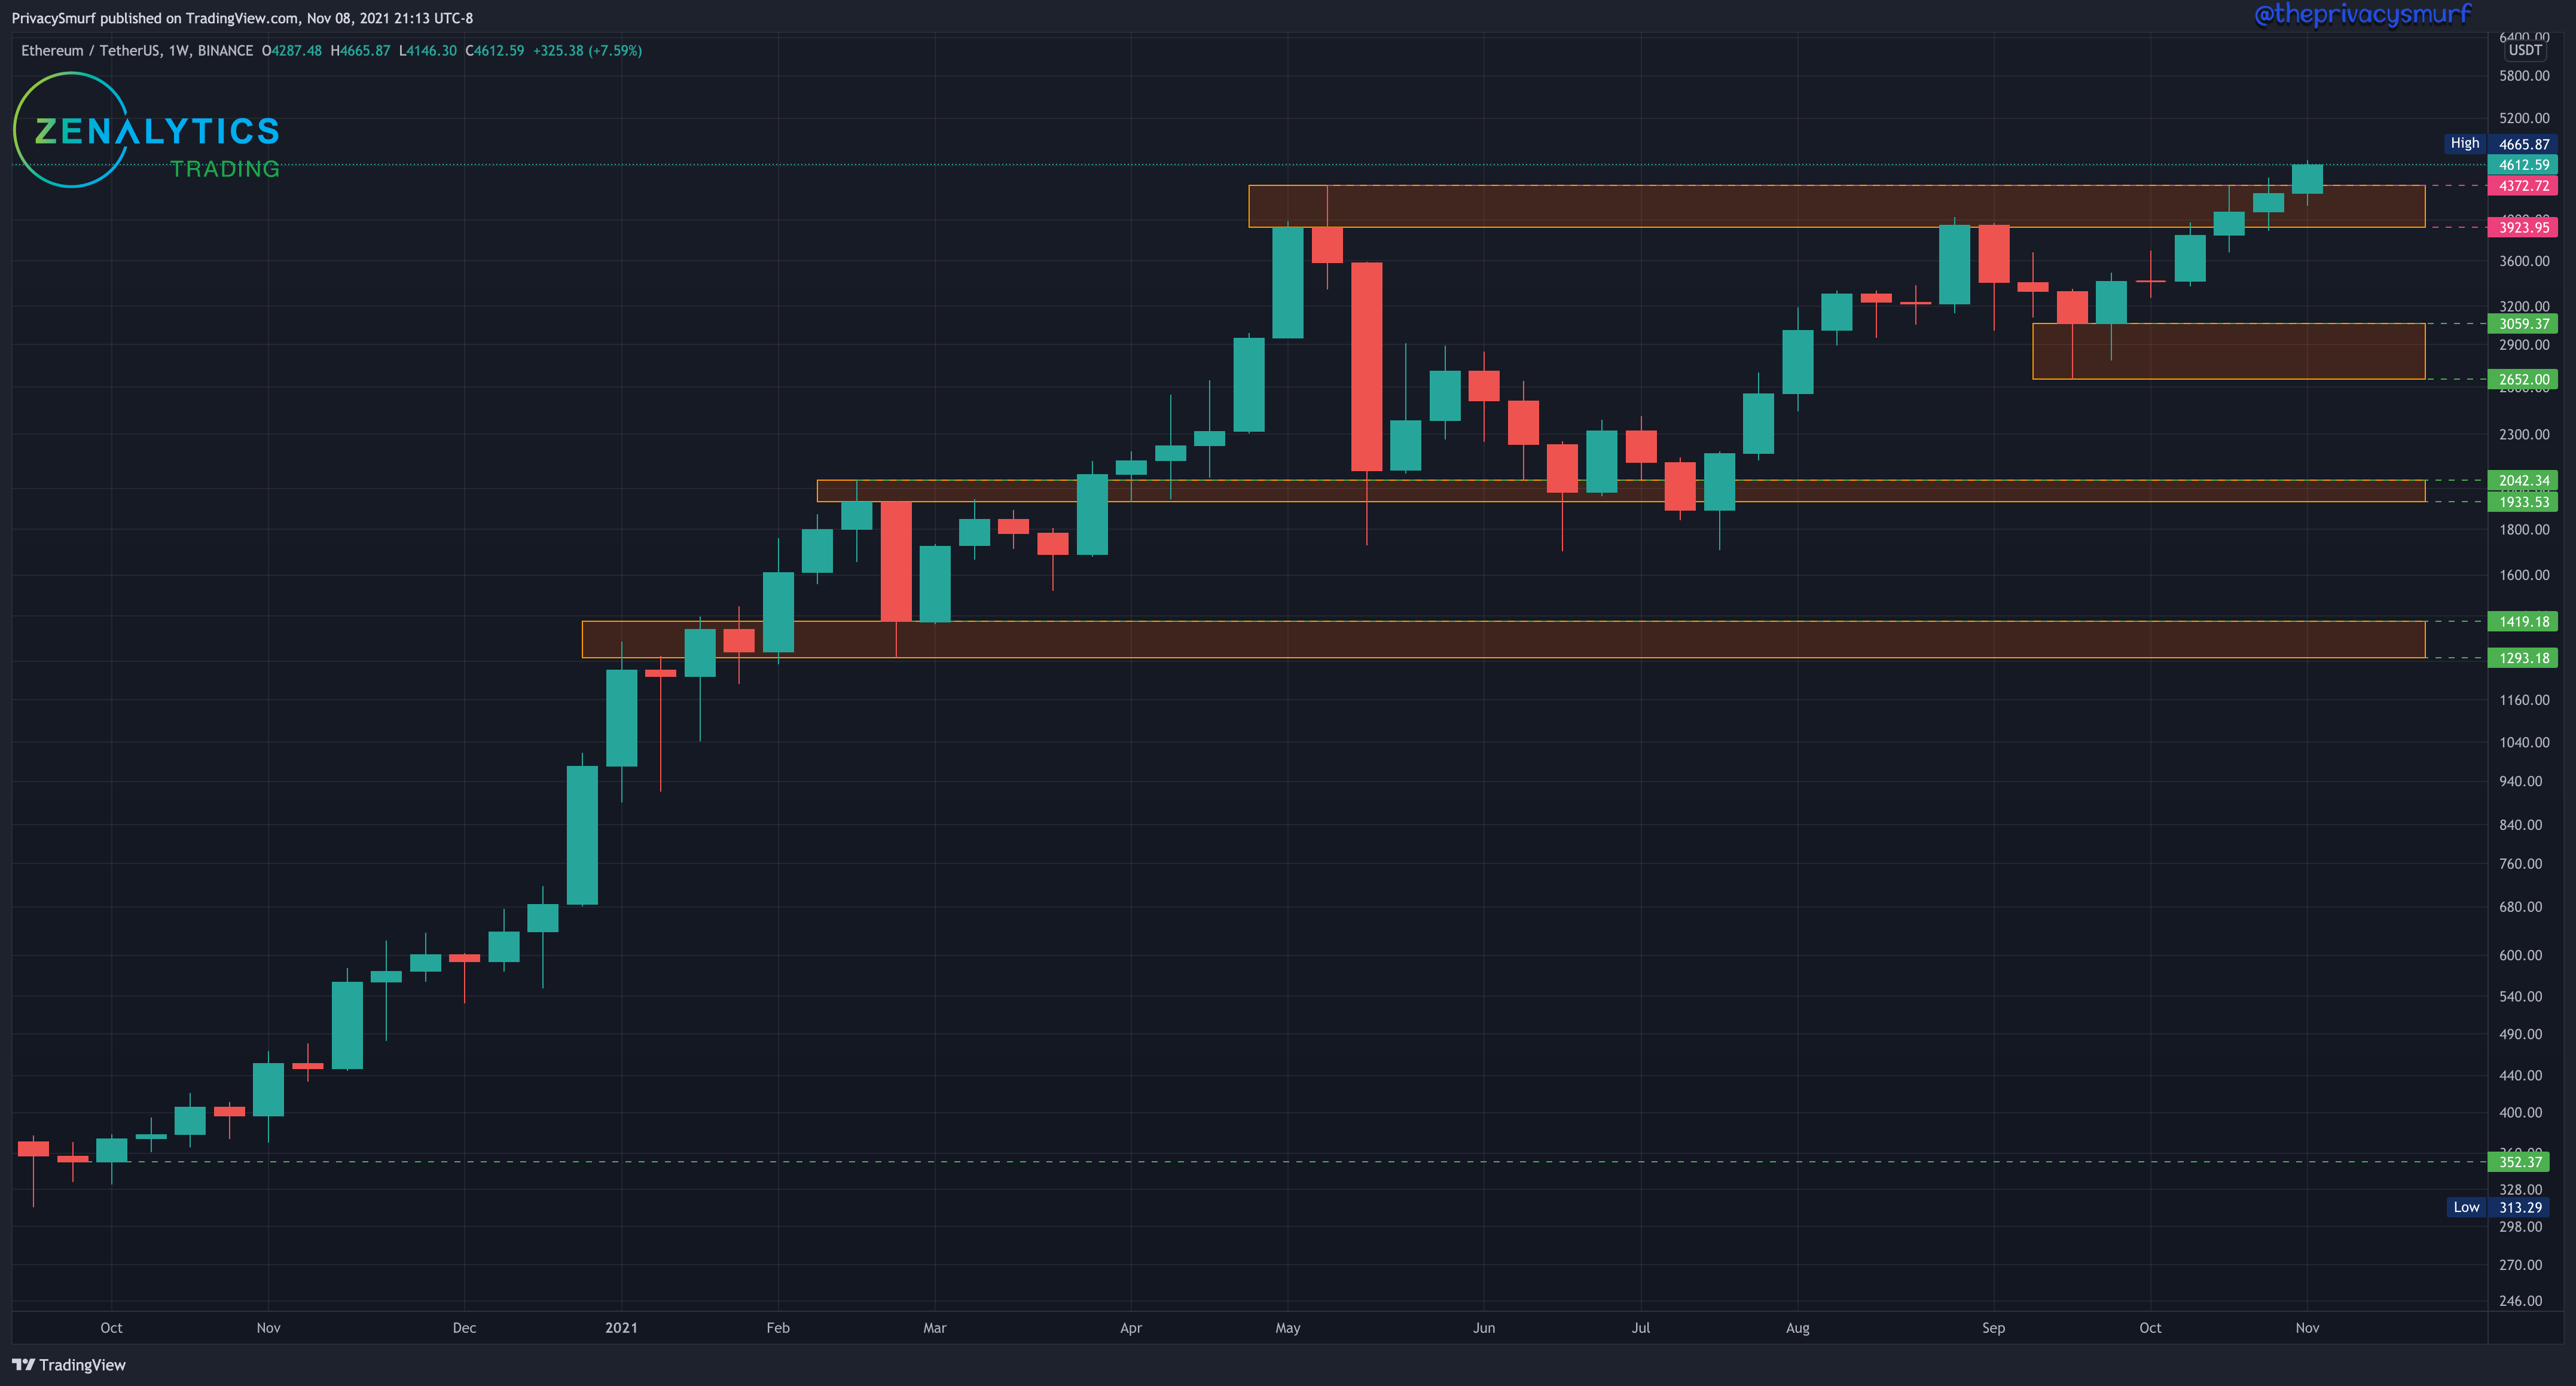
I went ahead and added the 8-period moving average of lows to the daily chart as well here just for another showcase of its validity during extreme bullish price action (Yes, I know it’s technically an 8-day moving average now, but don’t go applying the 8-day moving average to intraday charts and expect this same result). Below we can see the RSI is moving well in line with the price. I don’t really see much to talk about here. Since we are breaking into new all-time highs it’s something to always keep in your mind about potential pullbacks but the picture is still pretty strong. ETH is nearing a short term cyclical peak and that’s something I’ll get into tomorrow but just based on this chart things are looking pretty good. For pullbacks I’d expect first support to come in around $4610 and at the top of the prior range around $4375.
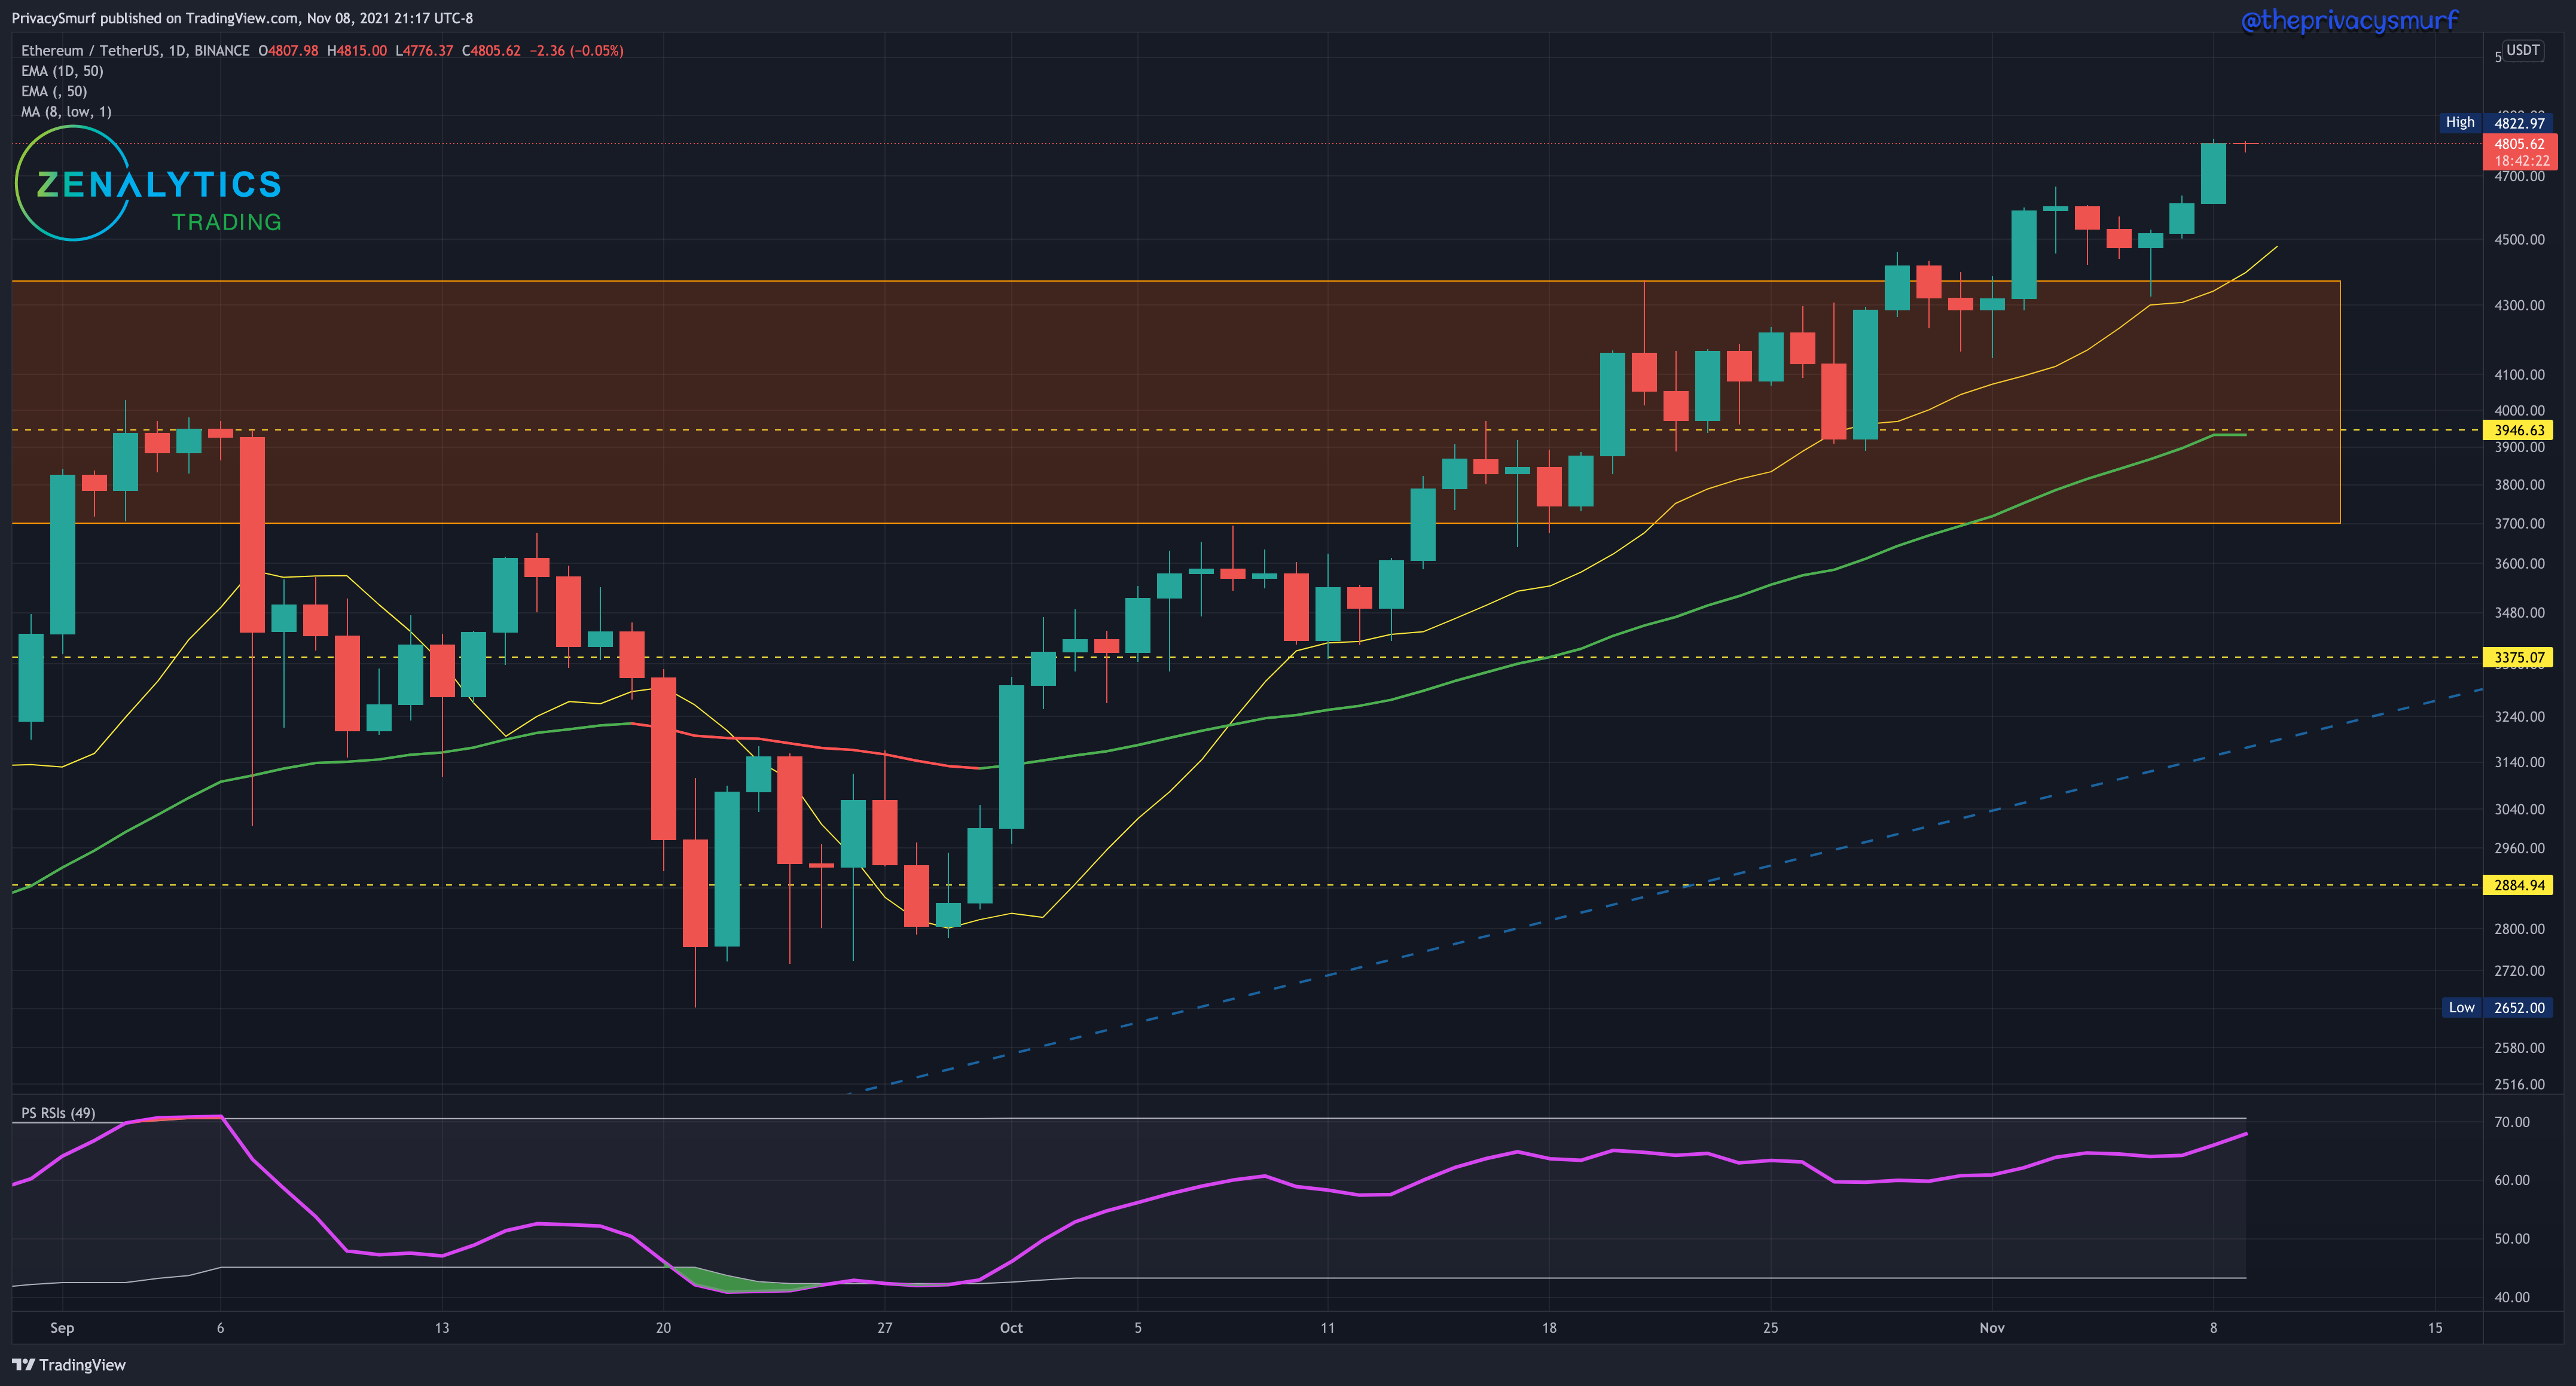
looking intraday ETH has even been too bullish for the 8-period moving average of lows. We can also see the building up of bearish divergence. This likely wouldn’t be a large pullback. Potentially just to the moving average or support around $4720. Worst-case scenarios the 50-period EMA around 4610 has added horizontal support so that would be a decent place to start considering buying this new strength in ETH if price action candles and momentum agree with a bullish reversal.


Crypto Money Fountain ← chart link (writeup on chart)
In Sunday #19 I said I was looking for:
BTC to stay in the support resistance ranges of 60k- 66k… if it goes above that it will likely start taking money back from alts and this relationship cycle will be reset
We saw that in full force this week. BTC had a daily close outside of the $60k-$63k range and rocketed away while each other market section declined relative to BTC. Relative to USD though ETH and alts are improving so it’s not a problem trading them but if stacking BTC is your goal you don’t want to be trading altcoins against BTC until a new trading range is established.

ETH/BTC is testing support so it potentially has a chance to gain on BTC if BTC slows down.
Large-cap coins are also nearing strong support. Look for those coins to buy with BTC if their respective charts are showing a similar support test and have momentum in line, or bullish divergence.
Mid-cap coins are in a middle space and not really in an ideal place to buy with or sell into BTC. I’d wait a little bit for either a support test on the charts or a breakout of resistance.
Small-cap coins are nearing a support test. It’s likely the BTC and ETH profits get rotated soon. Look for these charts at support with bullish candle patterns or bullish divergence.

Alrighty. That’s that. See you tomorrow!
@theprivacysmurf
Thanks for all the analysis Terry, it is amazing and not for the faint of heart. lol
How are you feeling about MATIC going forward?