

Party Week: Day 3
Party Week: Day 3
From the Halls of Montezuma To the shores of Tripoli...


Semper Fi and happy 246th birthday to my fellow Marines out there!
Dang, another exciting day out there. Market-wide corrections. Hope everyone got some good low buys in. I posted this up in response to a comment online but I’ll add it here because every time this happens people are always asking why this or why that and it’s just not really a useful question in my opinion. This is an excerpt from a book written by one of the pioneers in cycle analysis back in 1947.
"Most of us, taught to think in conventional terms of cause and effect, and trained in a system where educational wares are often cut to the lowest common denominator of mass intelligence, find it hard to remember that the human mind is finite. It can never hope to grasp in any situation all the causes that may work together to produce any given result. That is why judgements are so faulty when we reason solely on the ordinary cause-and-effect basis. Some if not most of the actual causes will escape our knowledge, and those we do take into calculation may be pure assumption. If despite this we reach a correct conclusion it is a triumph of accident - or of intuition."
Keeping that in mind has saved me from doing plenty of mental gymnastics and from experiencing undue stress. It ultimately doesn’t matter to me or my portfolio/trading account why things are happening as long as it’s predictable and consistent and looking at the right technicals most things are.
Today I’ll post up a couple of interesting macro indicators that are found out there that I think are useful. Some are more intuitive than others.
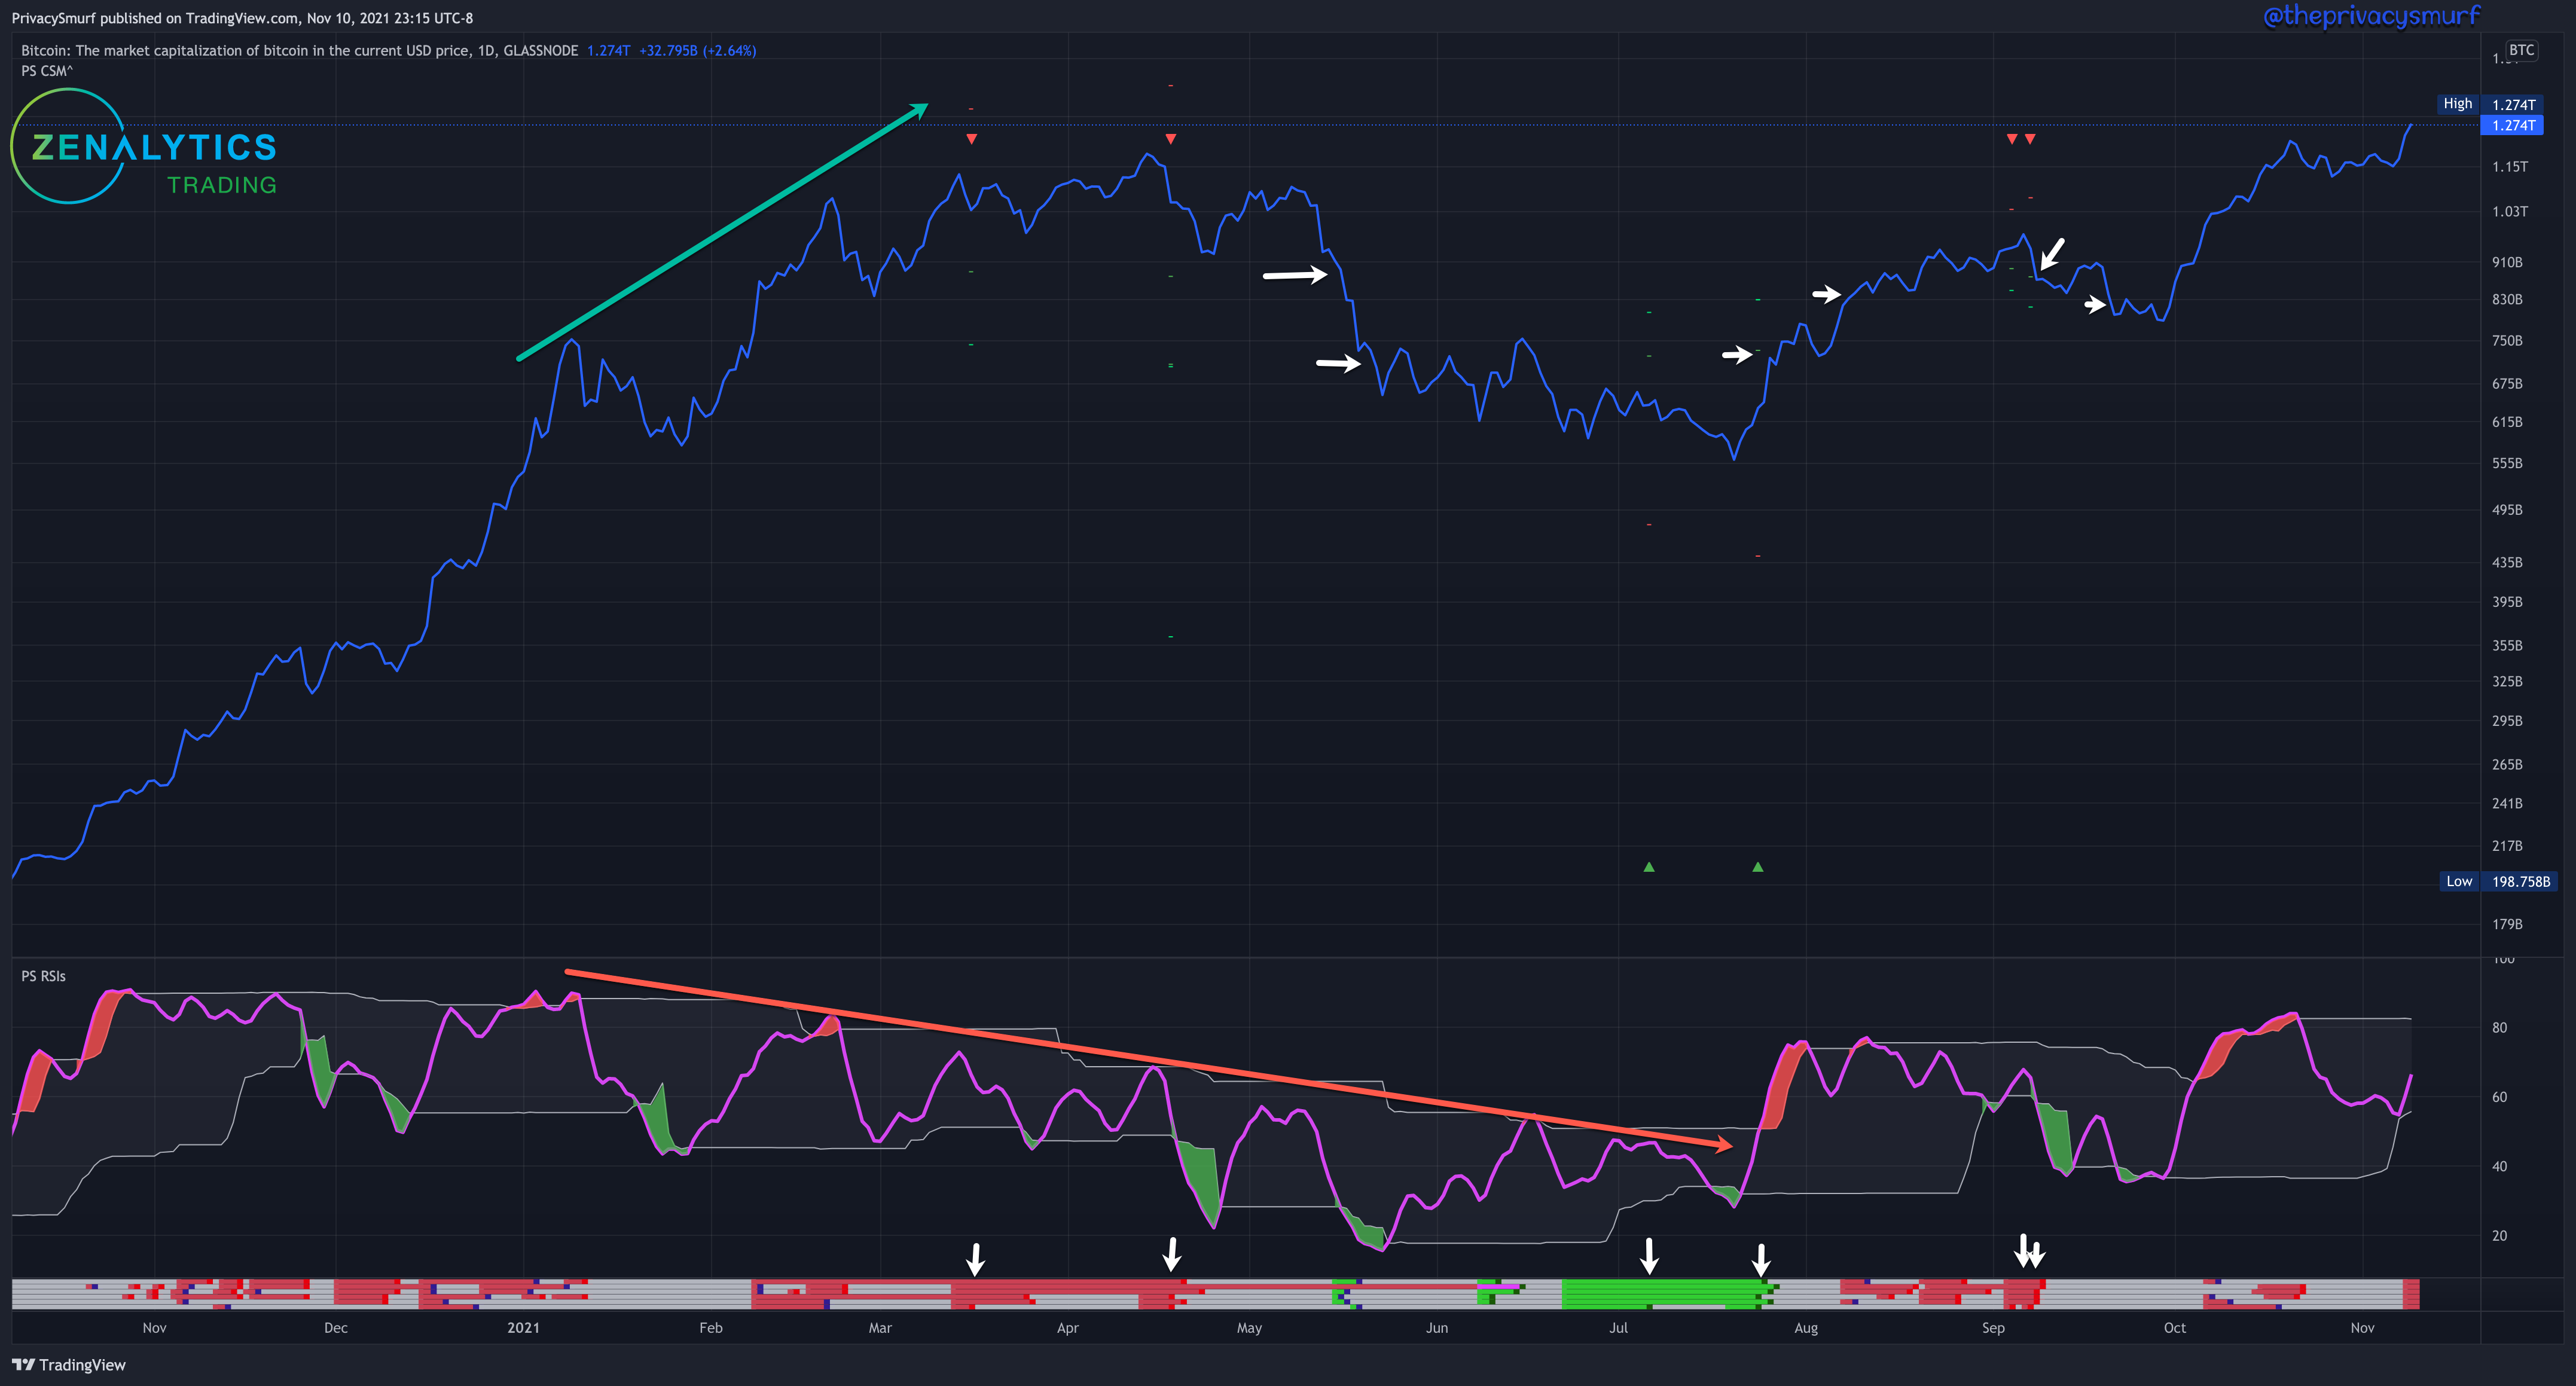
BTC Market Cap
Pretty simple. It can be measured just like anything else. Note the divergences on the RSI, both bullish and bearish. The bar at the bottom of the screen is my indicator that I’m still polishing up that shows when signals are lining up for a reversal. The white arrows down there are showing when all the oscillators agree. The horizontal white arrows are the targets of the correction. Each of the signals’ targets was met. You can also draw trendlines and horizontal support on the market cap and find success in that as well. I don’t typically do that but it can be done. I like the RSI and other oscillators to show divergence more and you don’t need my meter on the bottom. Any standard price action oscillator will work (although you can use my RSI if you want). Ideally, you don’t want to be looking at any measurements under the daily though.
Fear and Greed Index ← link
This is a decent macro indicator. In a basic sense the lower the value the closer we are to a bottom in the market and the higher the value is the closer we are to a top in the market. It is a “contrarian” signal, and I use that term sparingly because if everyone is using it the same way it’s not really contrarian. I don’t know. I just have issues with that word. Everyone thinks they are contrarians… Anyways, it can be paired with standard technical analysis for confirmations. If bullish signals appear when fear is at at a low (lower values on the chart) that can be confirmation of the market bottoming out and reversing. If a bearish signal appears on the charts when greed is at a high (higher values on the chart) that can be confirmation of markets topping out and falling.

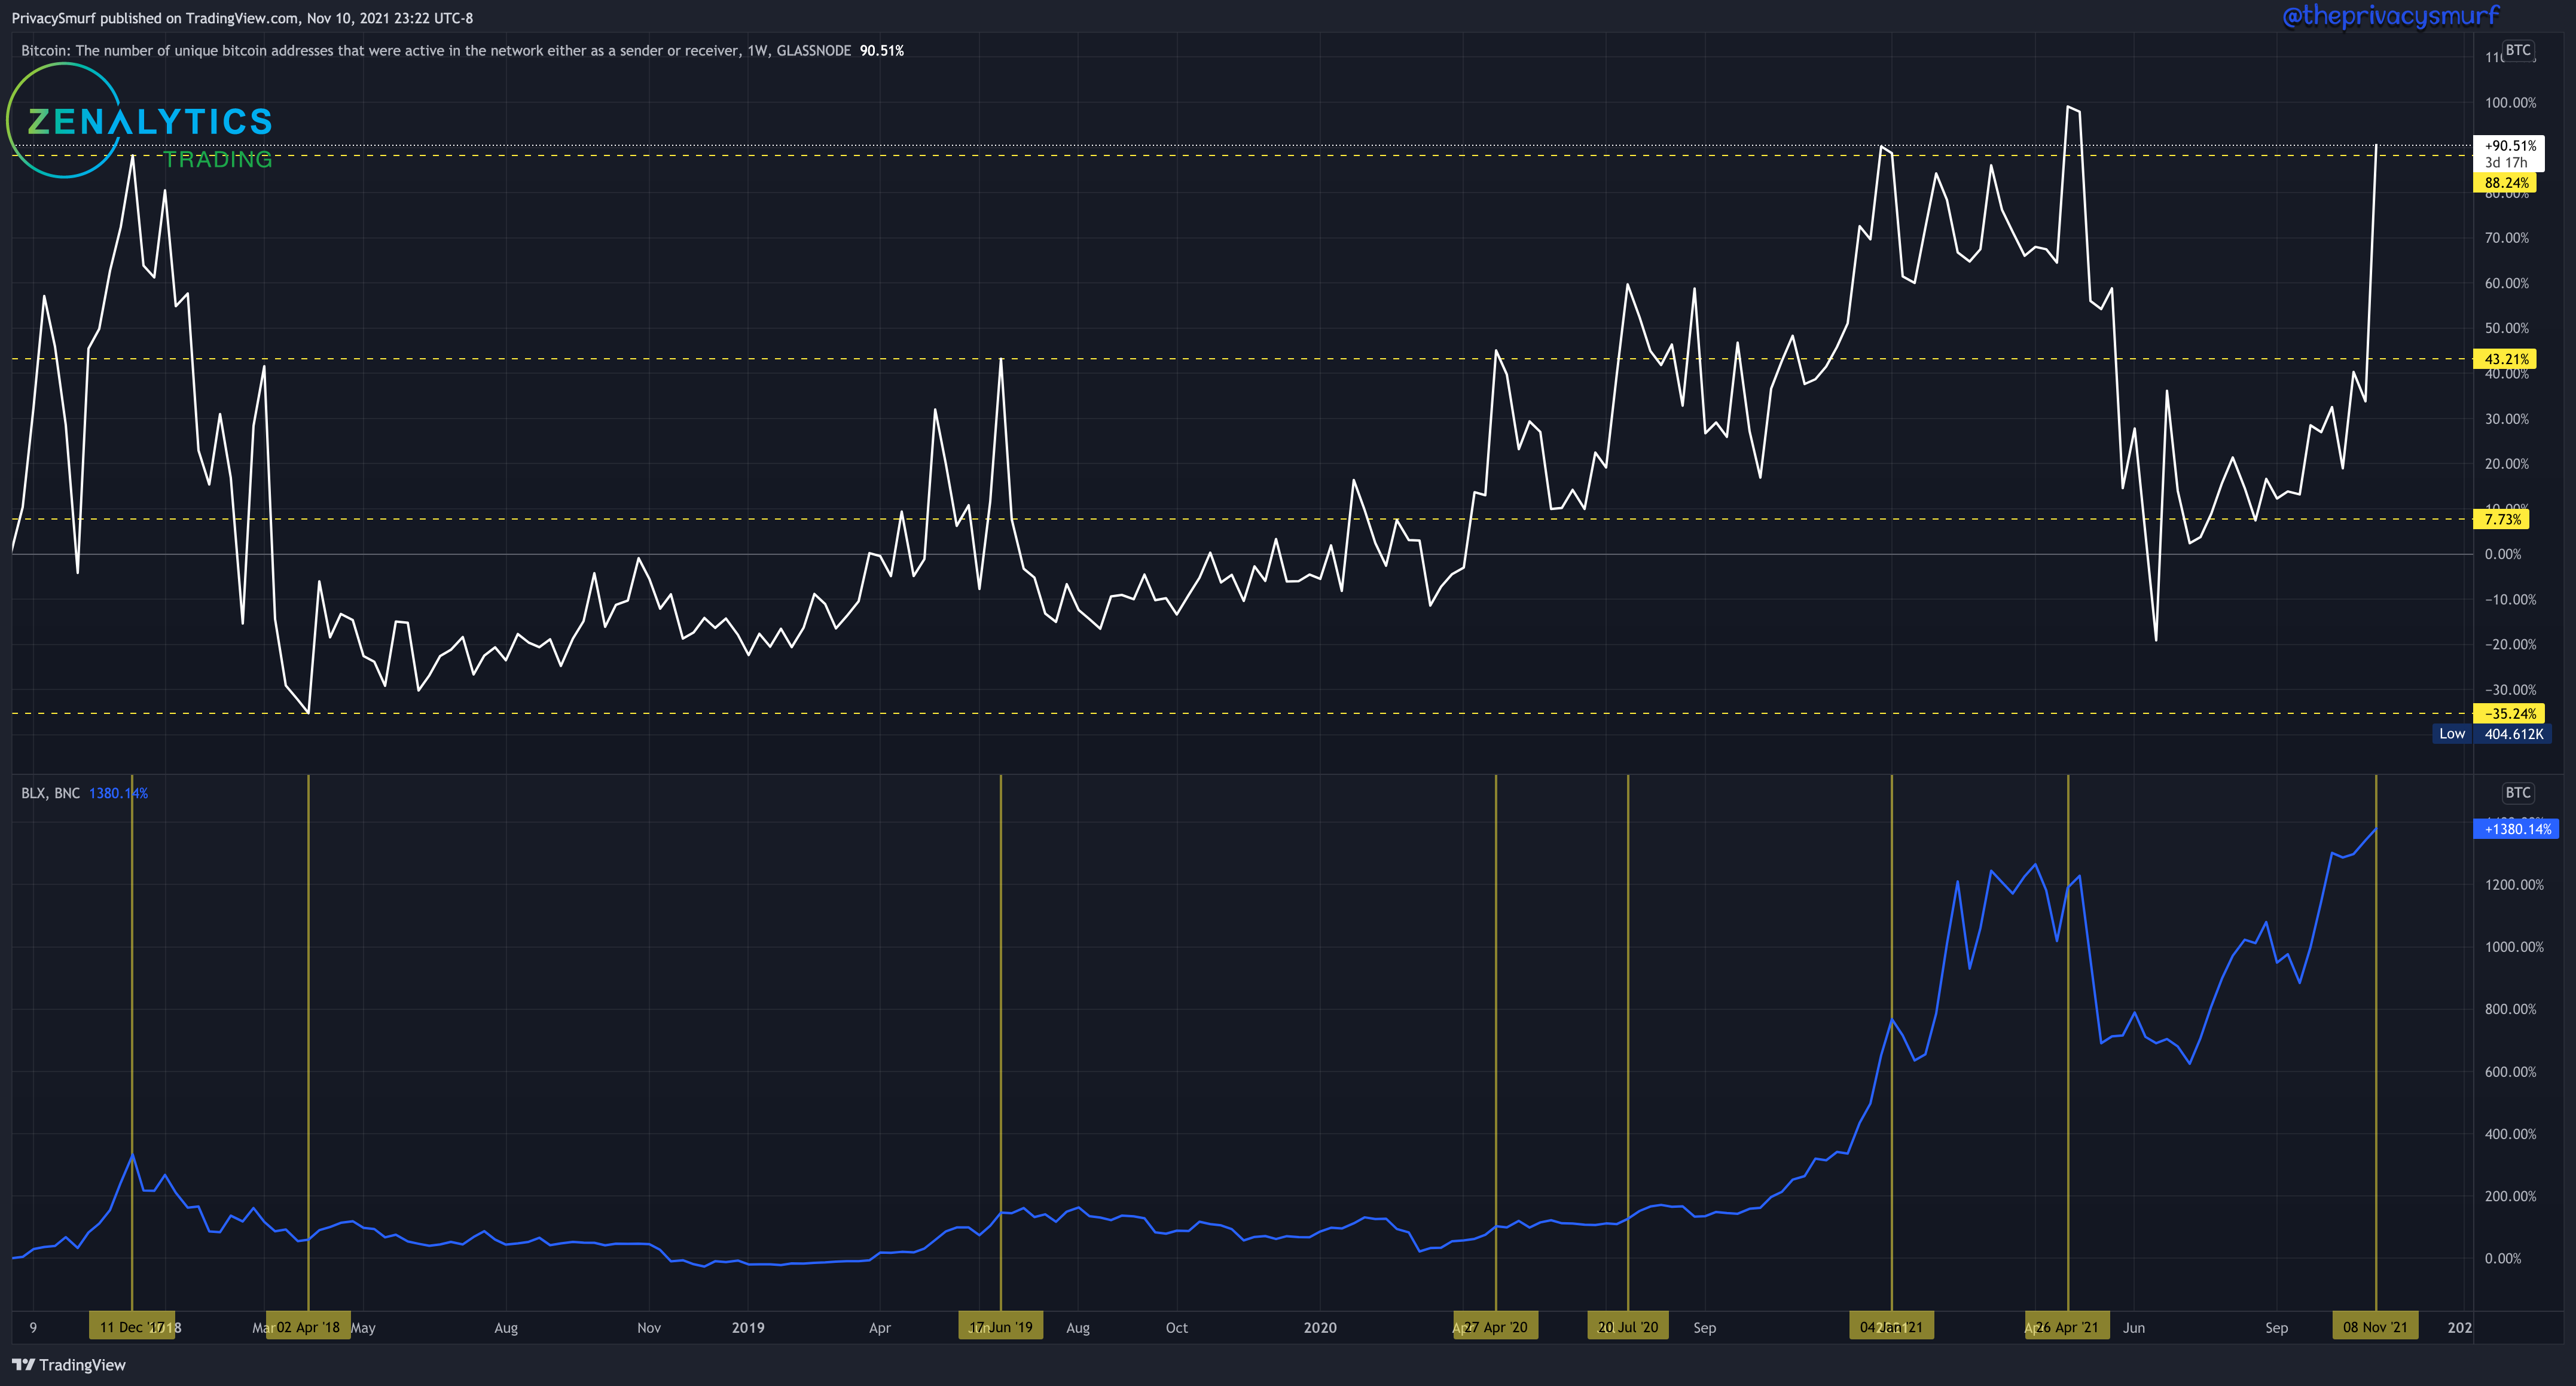
BTC Active Addresses
This one is pretty neat and I’ve got a couple of products I’m working up with it. Glassnode, a company that provides an extremely exhaustive amount of on-chain data, has some free charts for tradingview. This one is also pretty straightforward. It’s the number of unique addresses that were active in the network either as a sender or receiver. The top chart is the active addresses on the weekly chart. The bottom chart is BTC the weekly price line. I plotted horizontal (support and resistance) lines on the top chart. Then I plotted vertical lines on the BTC chart to correspond with lows or highs of active addresses or times they reversed from support/resistance. These moments mostly correspond with major market turns or continuations. It makes sense, the more unique people doing stuff on the network, the more likely something big is going to happen. Note we are at the top resistance. Is this moment a break and fantastic runup or a top? This is why multiple forms of data analysis are necessary. Just one indicator is not a full enough picture to make the right choice.
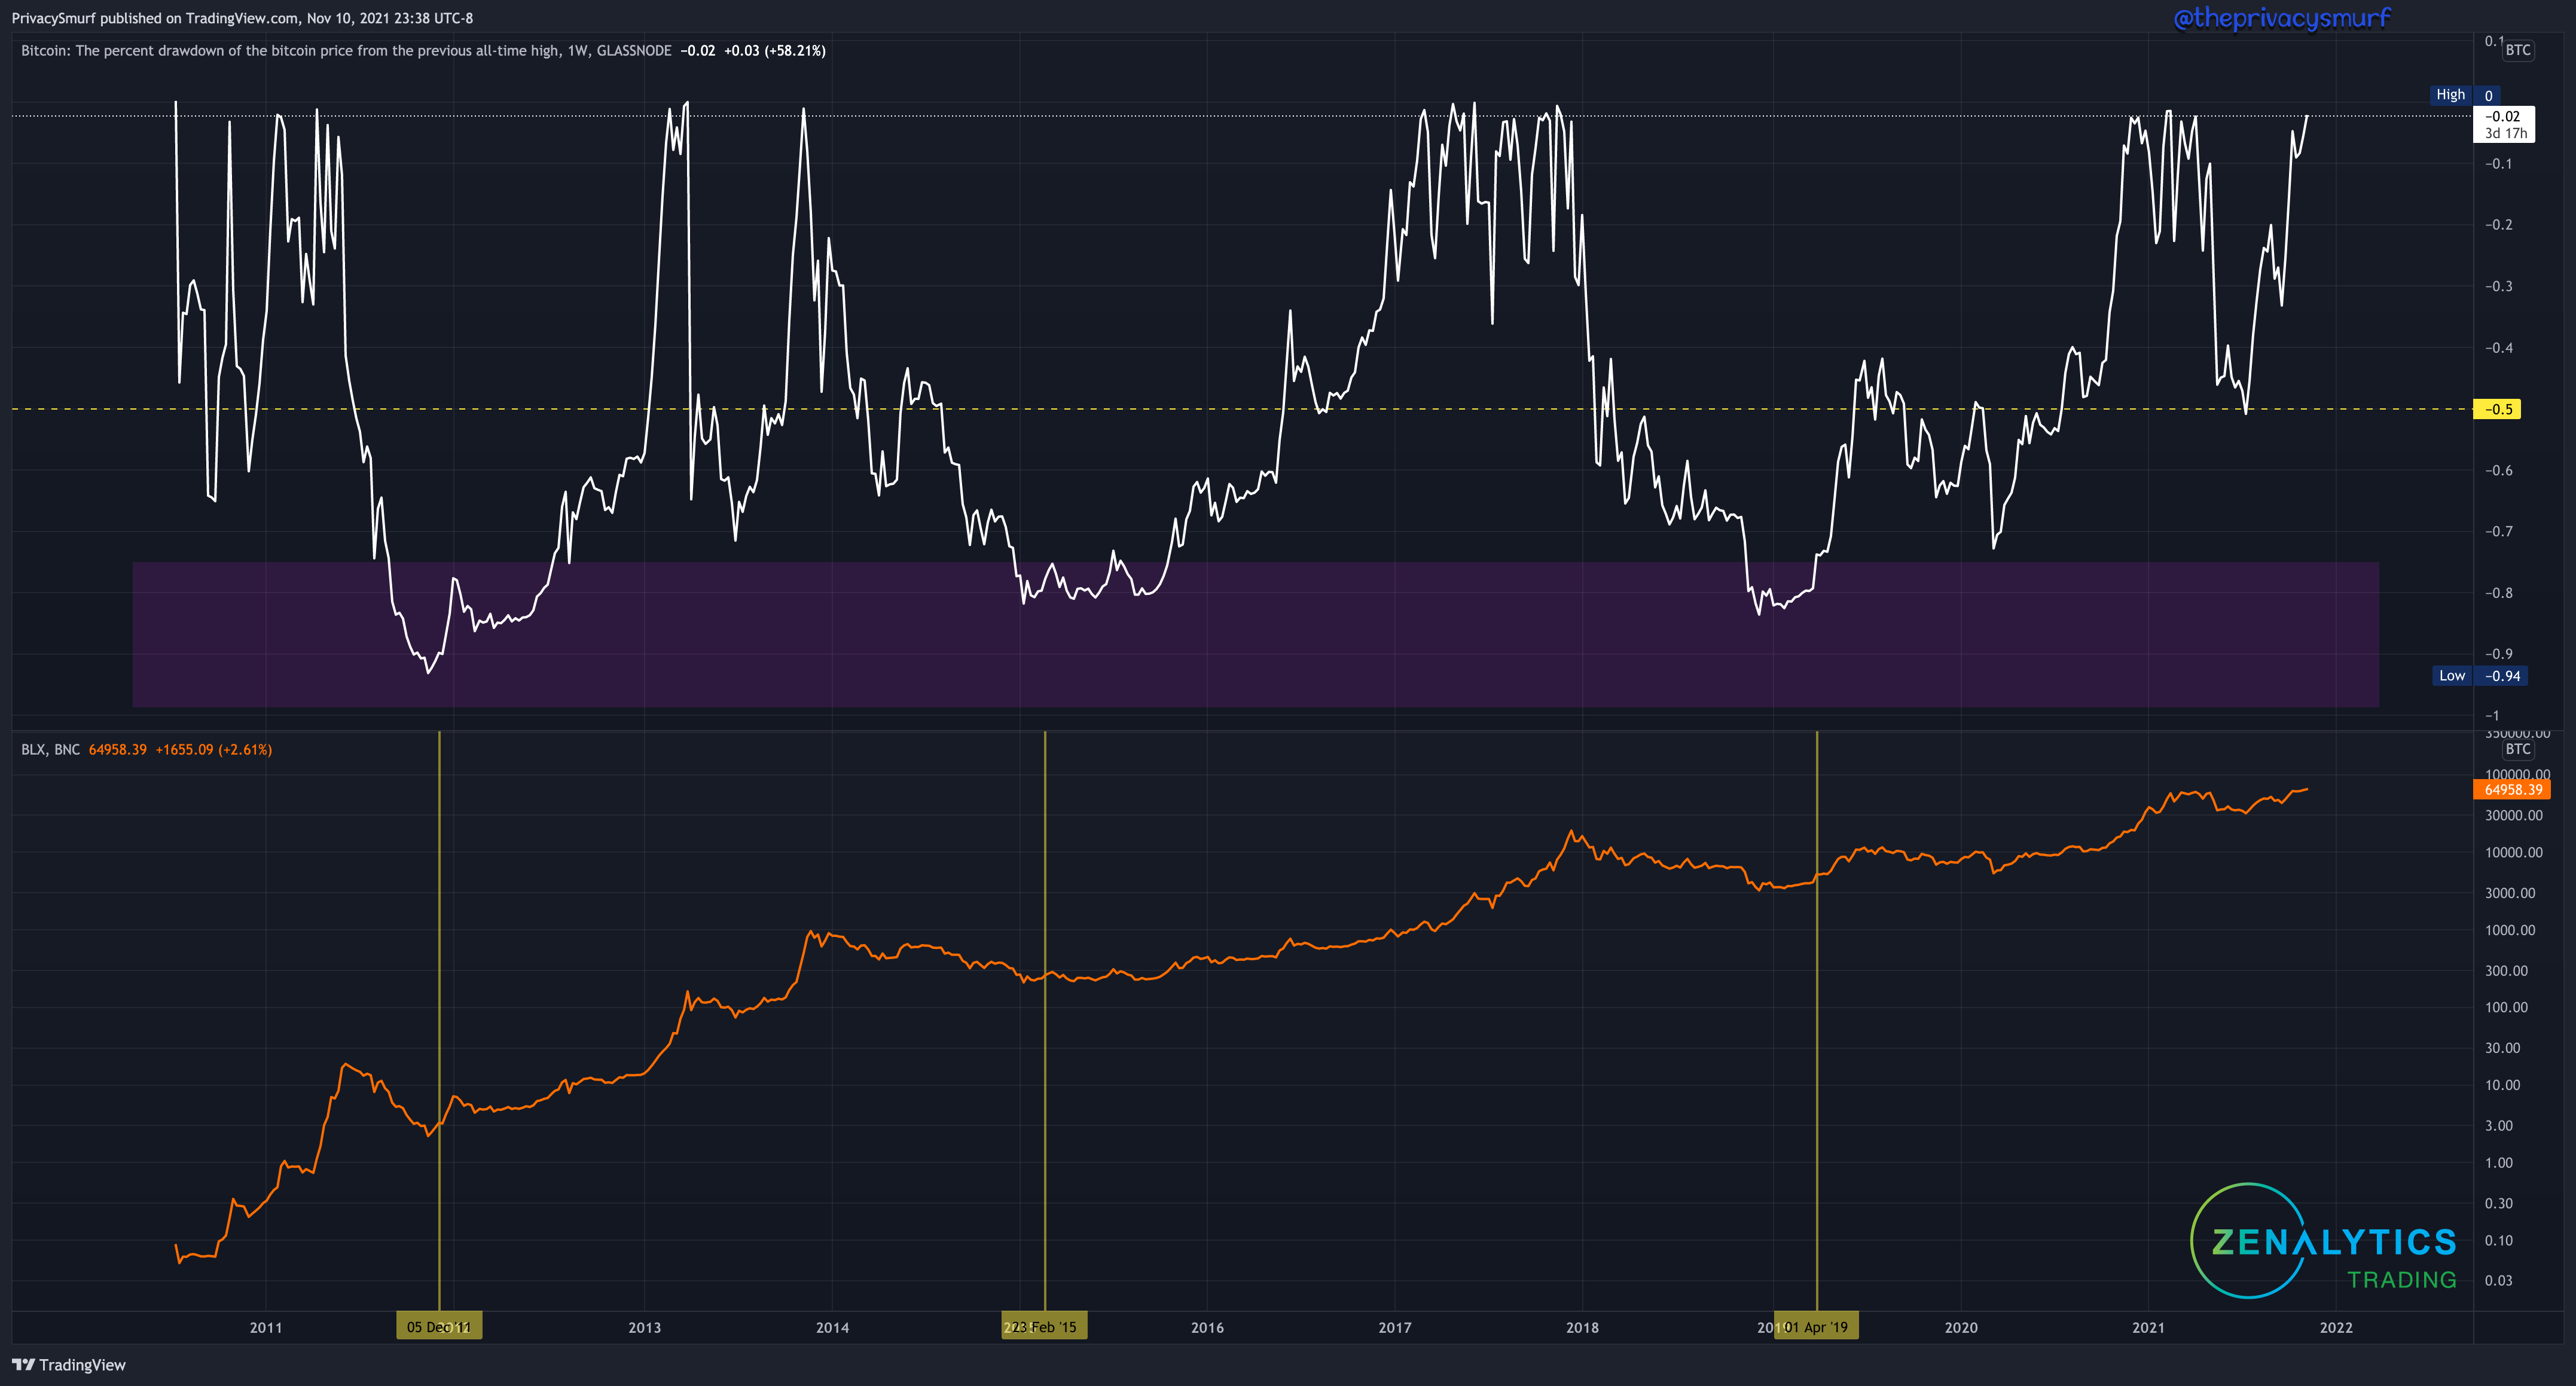
BTC Drawdown from previous All-Time High
This is another free Glassnode chart on tradingview. This is probably the most TA hands-off investment buying strategy for loading up on bitcoin, aside from no TA and just buying bitcoin. The top chart is the retracement from the all-time high. The bottom chart is BTC weekly price line. Basically, when the top chart plotted line is at a peak BTC is setting a new ATH. I added in a zone at the bottom and a horizontal midline making it an oscillator of sorts. One could easily just wait for the retracement to encroach into the bottom zone, wait until there’s a market structure reversal and load up on some bitcoin. Each of those occurrences (vertical lines) would be very profitable endeavors and buying near the bottom of long-term bearish trends. Even the horizontal midline I plotted acts as a form of support/resistance and could be used for buy points when it’s held up.
I’ve got some more comprehensive stuff I hope to have to share soon but in the meantime, these are great readily available macro indications to add to your considerations. See the paid folks tomorrow in the Topical Thursday post. Friday will be free for everyone again. Then Saturday will be a big altcoin post for paid subscribers. Don’t forget to comment with your suggestions for me.
Also, subscribe and share anywhere and everywhere! If you keep up with me you’ll have plenty of reason not to freak out about market moves and be on the right side of them more often than not.
Cheers,
@theprivacysmurf
You really hit the nail there!!! Another thing mom drilled in EARLY that has helped me more than I realize in trading, I’m SURE!!! WHY is irrelevant. Not ALWAYS, but largely….
Just read again, third time comin tomorrow morning. Thanks for this! Can you comment on MIR as well?