

Position Playbook #77
Position Playbook #77
Crypto Checkpoint Trade Management

Today, I’m excited to announce the separation of the position management sections from the Market Update post. The new format will feature four subsections for each asset, providing more detailed insights into managing open trade positions or searching for exposure.
These subsections will be titled as follows:
"I'm in longs..."
"I'm not in longs..."
"I'm in shorts..."
"I'm not in shorts..."
Each subsection will provide a comprehensive overview of managing open trade positions or searching for exposure, depending on a hypothetical status.
The post will continue management and suggestions from the prior week/post each week.
The goal is to improve the clarity on utilizing the (now Crypto Checkpoint) market update posts to ensure you have access to the information you need to make informed decisions. Managing positions can be challenging, and I want to ensure that these posts provide you with the thought process I’d have if I were in your shoes to navigate the markets effectively. It’s not specifically designed to be read from top to bottom but approached from where you are. Find the subsection that applies to your current status in the market and go from there. Then read through other sections to understand what has happened in retrospect.
I hope this new format proves useful to you and I look forward to your feedback as we continue improving the posts. Thank you for your continued support, and I look forward to providing you with more valuable insights in the future.
Each section will include the chart link and the weekly Crypto Checkpoint chart for reference.
Given the week's current technicals:
Unfortunately, I could not complete this before volatility came into play so it’s not up to date and will be hypothetically taking place Tuesday afternoon. This post mostly introduces the format and creates the setup for continuity in follow-on posts.
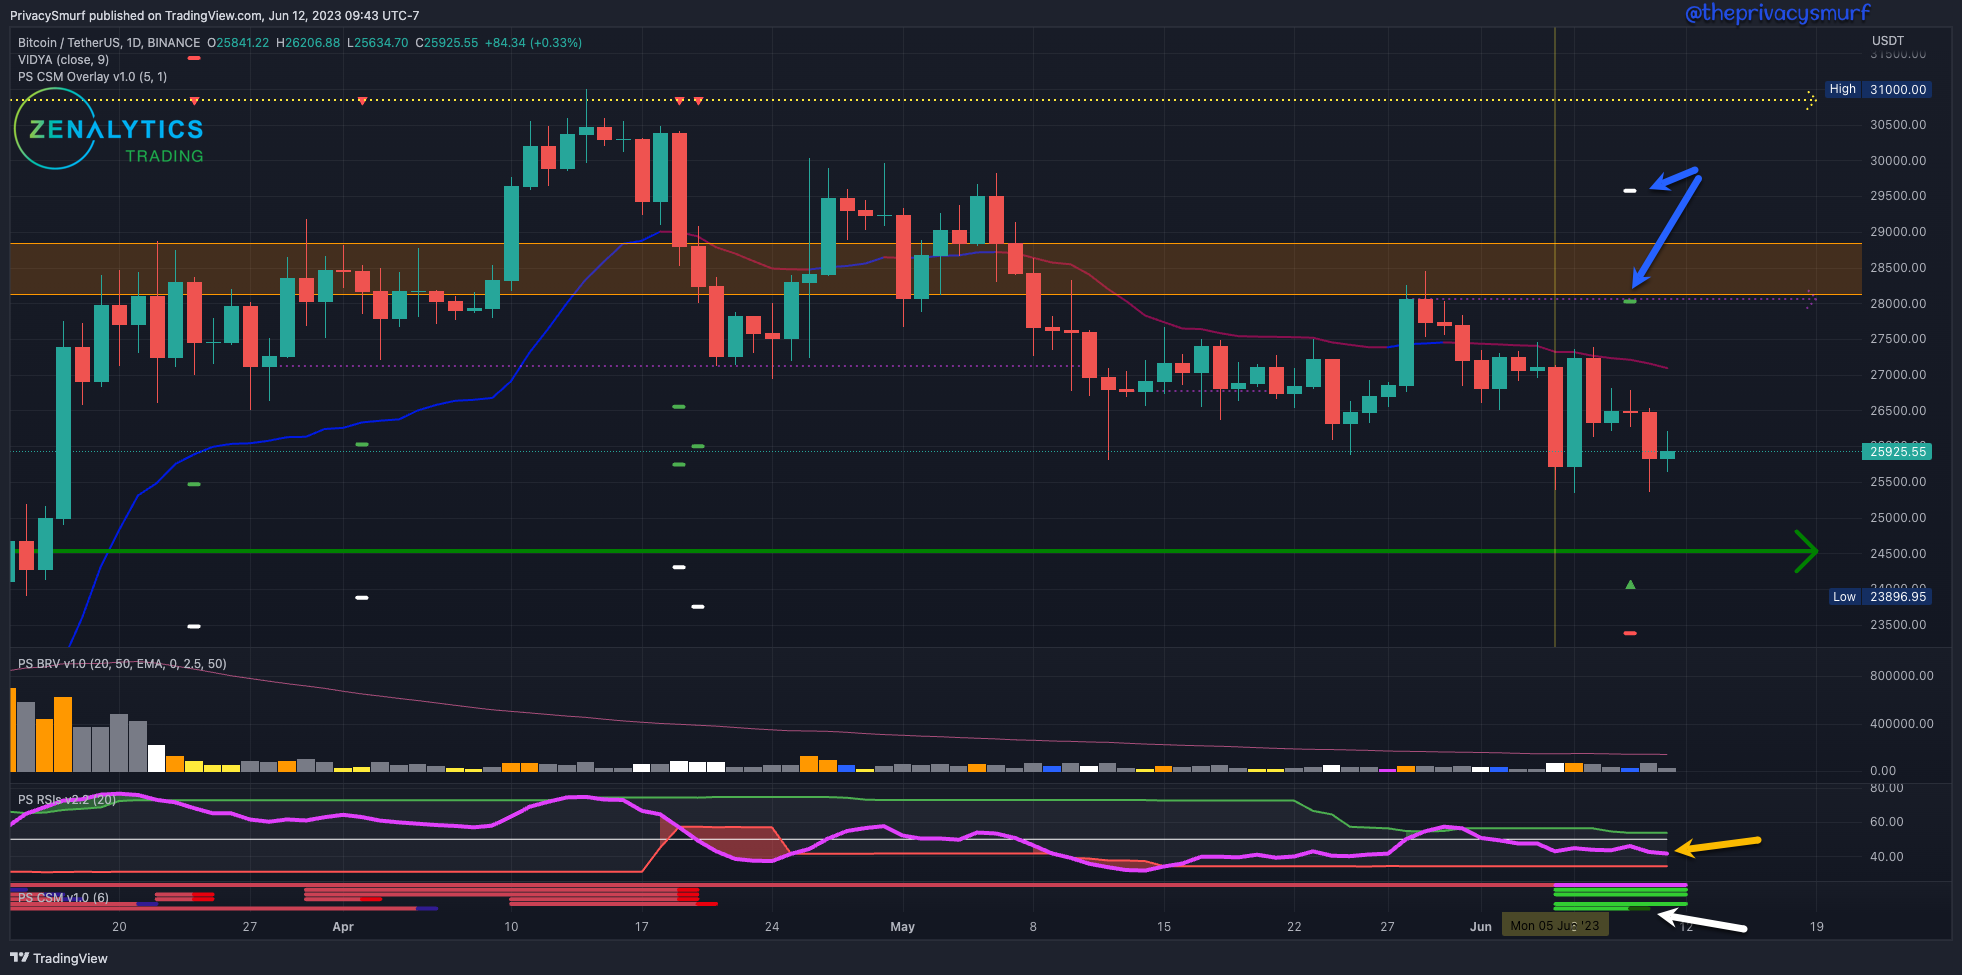
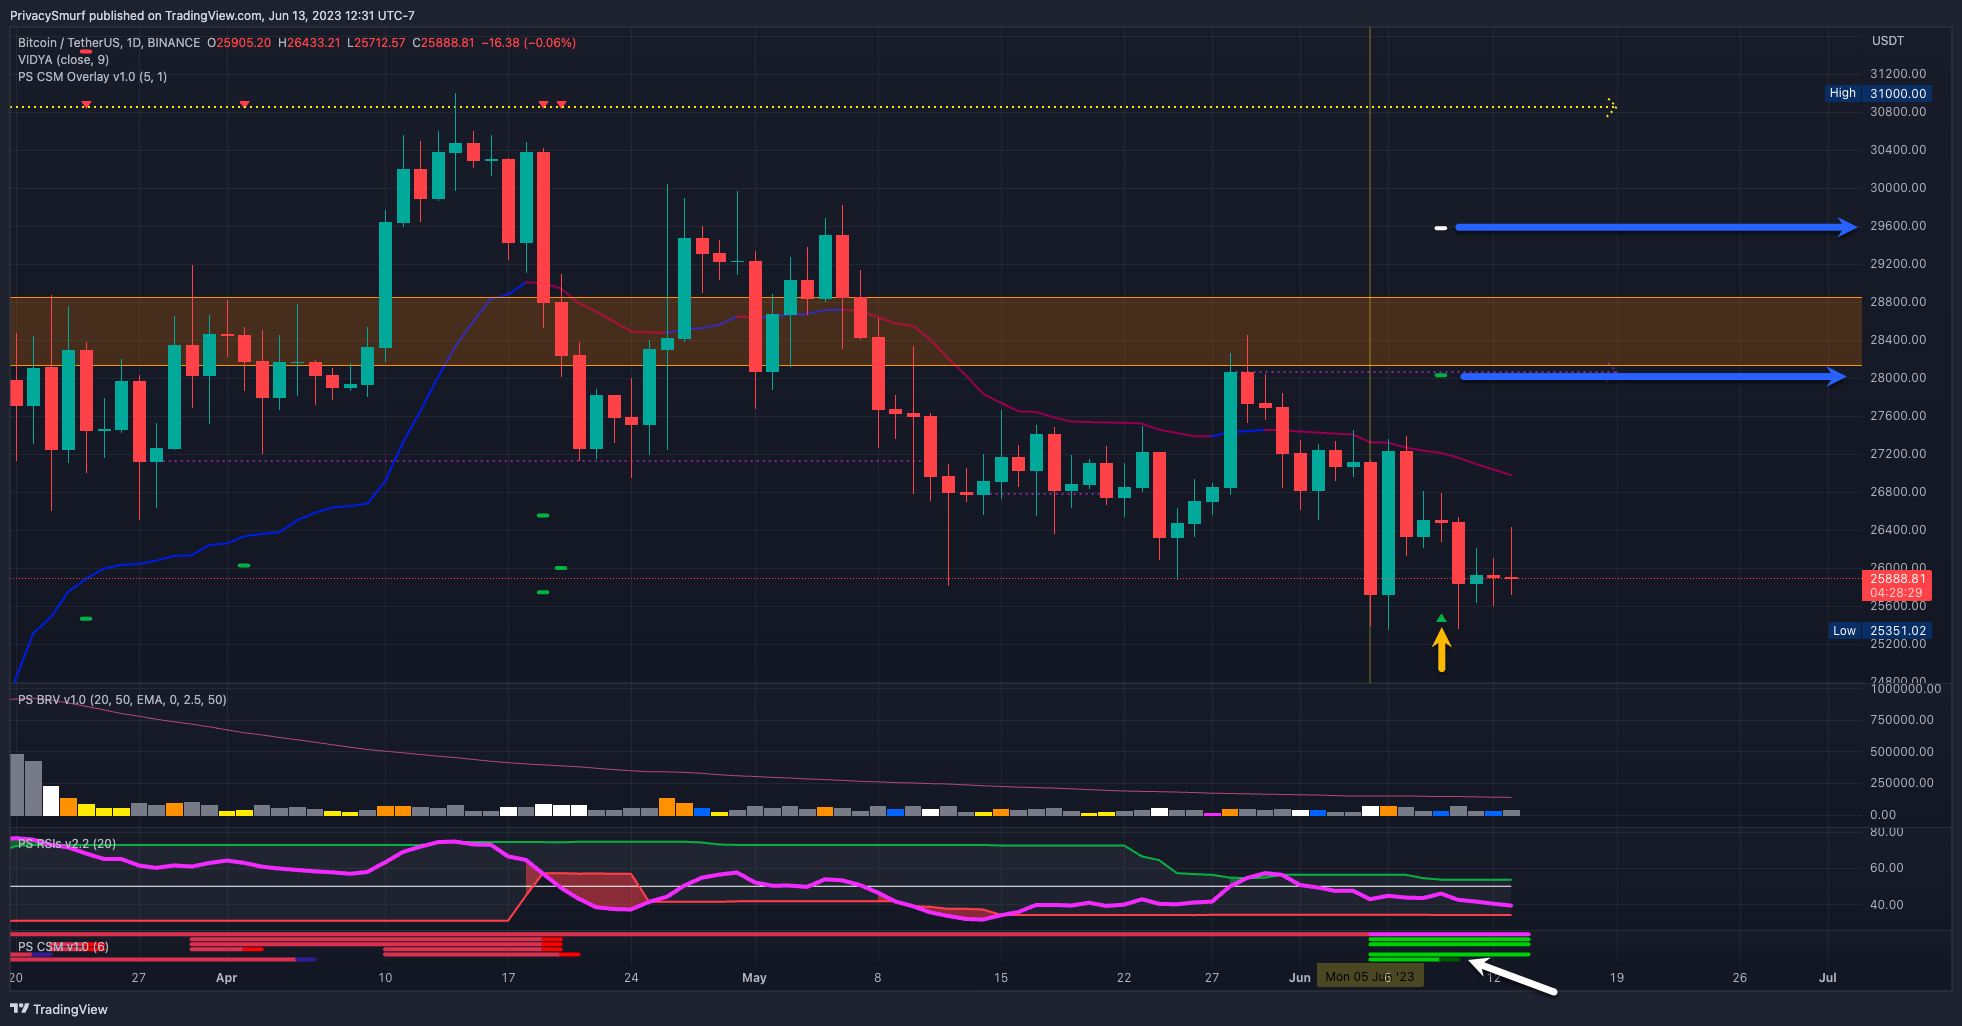
BTC/USDT Daily Chart
https://www.tradingview.com/chart/jjSdFW4b/
If I'm not in daily chart BTC Longs:
(Conservative Approach) I'm not opening new longs at this level since the structure remains bearish (lower low and lower high pivot points). There is a bullish reversal trade trigger on the CSM that occurred on market close on June 9 but entering immediately on that signal due to the market’s structure would be risky. I'm waiting for one of three conditions to enter a new long position. The entry will determine the profit target location, regardless of whenever, wherever, or whichever occurs. Future commentary will be made as entries present themselves.
A change in structure to bullish, which may look like a daily close over $26.5k, a lower daily close on a red day yet above 25.8k, followed by a daily close than the first mentioned close. This would create a low close (on June 10), high close, higher low close, and higher high close which is the textbook bullish trend definition.
A confluence of signals, which may look like the RSI crossing above the midline on a green day and/or adaptive top band with higher relative volume (ideally two times the recent volume levels). There's no particular price level this needs to be or where I am expecting this to occur.
Outside of technical factors, I'd consider a buy bid at the green support line at $24.6k.
(Risky Approach) Since the last post, no risky entry presented itself. Now I would open new longs under three conditions. All would be targeting 28K at a minimum for initial profit taking.
(one that has since passed) Entry on the market close June 9 at the daily chart CSM bullish trade trigger (targets at the blue arrows).

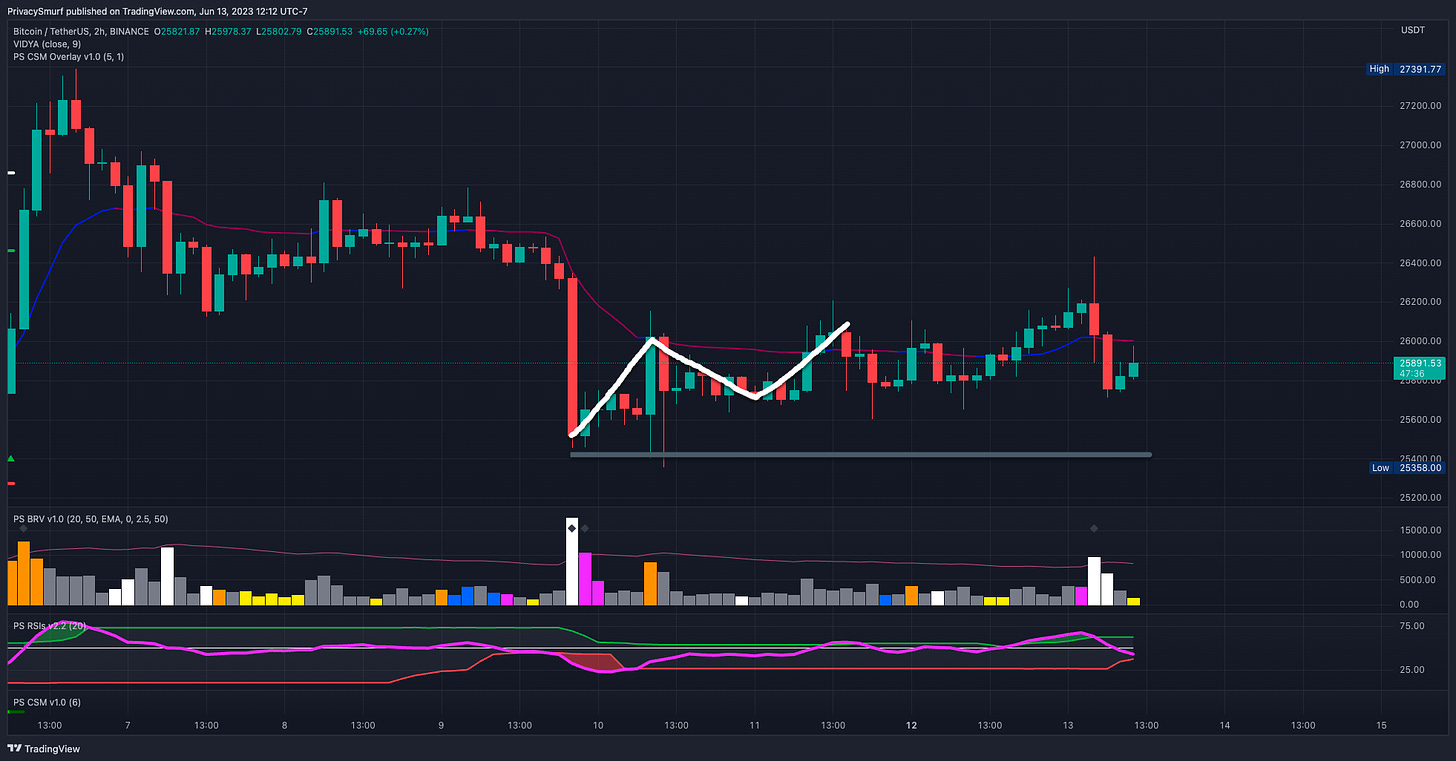
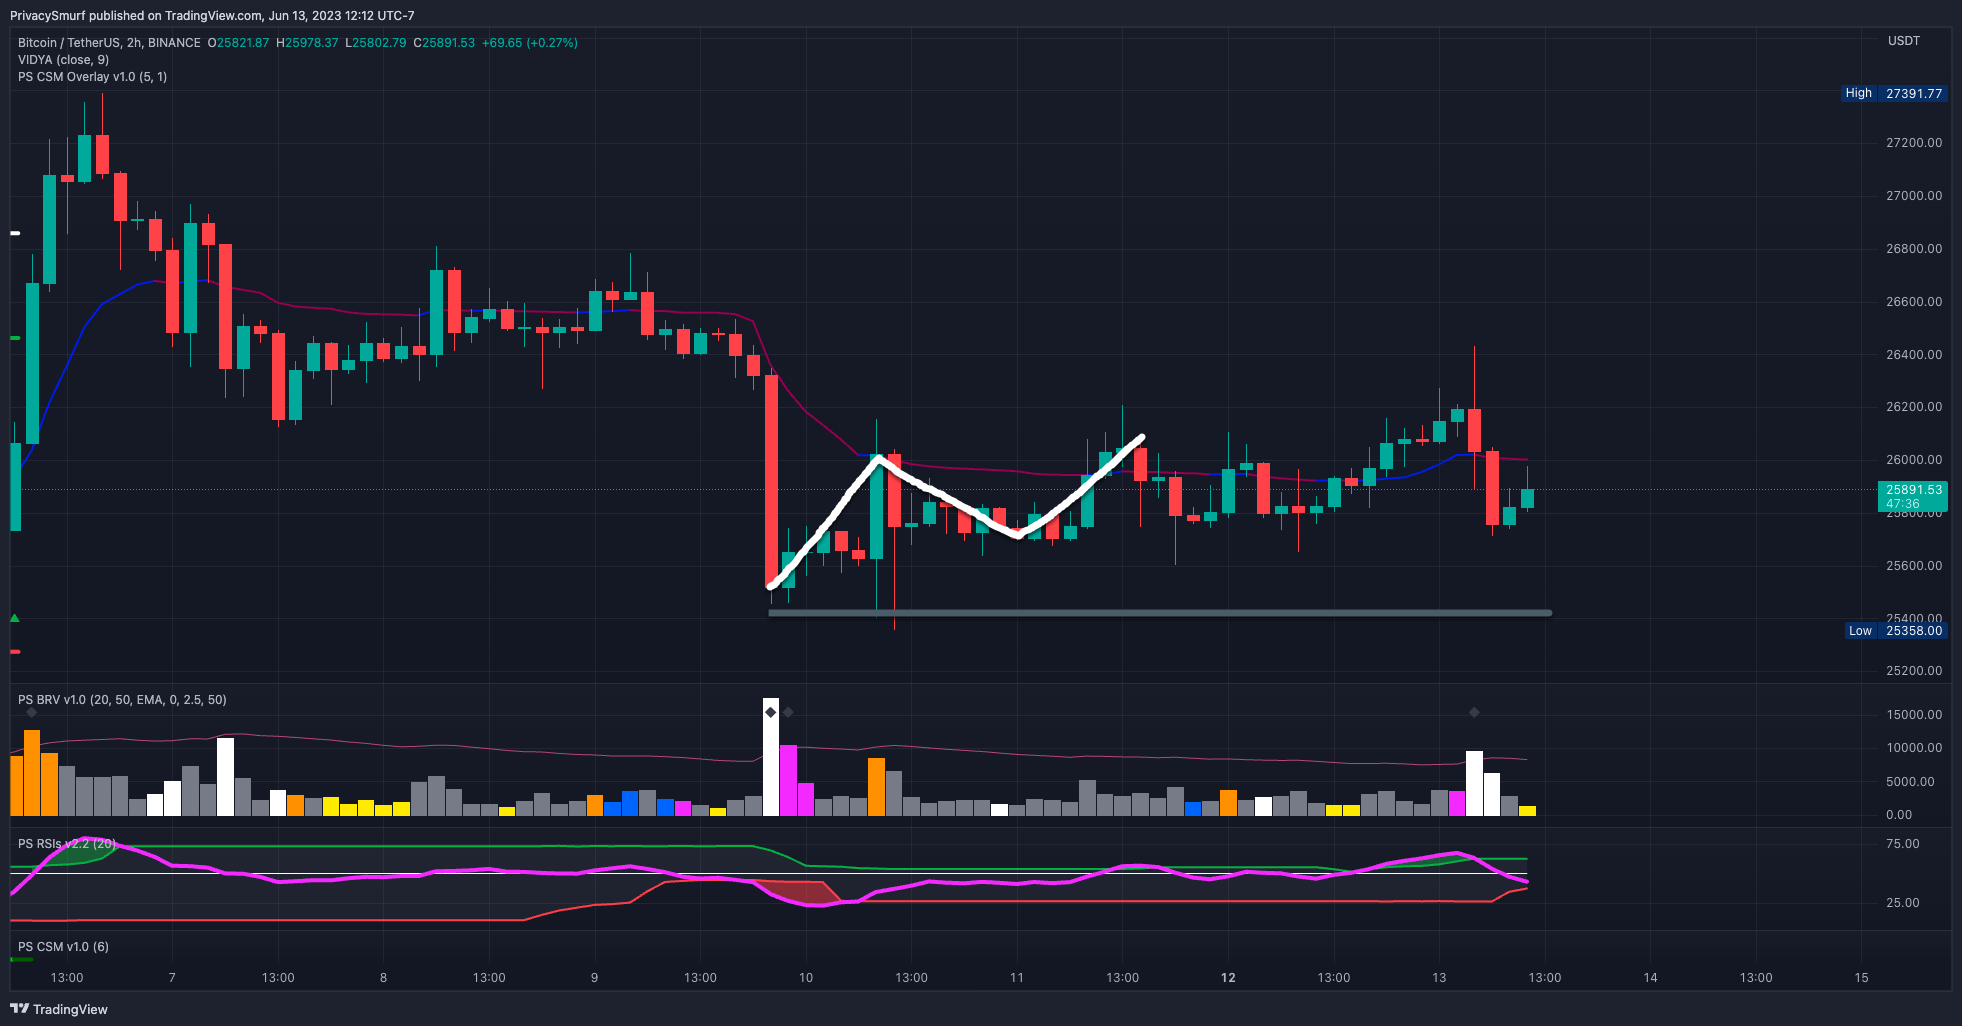
(one that has since passed) Entry on a 2HR chart structure shift to a bullish profile (higher low and higher high pivot points connected by white line). This entry at around $26K is a risky front-running of a daily chart bullish trend shift.
Entry on the RSI closing above the midline and top band on the daily chart.
If I'm in daily chart BTC Longs:
(Conservative Approach) With continuous lower low closes on May 11, 12, 13, 21, 24, and Jun 5, if I'd not exited longs there's no point in acting now. The opportune window to exit has since passed, and I'd hold my positions open unless a daily close comes in under the June 5 close at $25.7K. As bullish divergences are starting to appear, lower lows are less likely than they were a few days ago. ‘Risky Approach’ entries above could be cues to add to the existing long position and bring down the average entry price. In the event of a rally, ideally, I’d be targeting $28K for initial profit taking.
(Risky Approach) Two risky entry conditions occurred since the last posting. All would be targeting 28K at a minimum for initial profit taking.
If I entered on the June 9 daily chart CSM bullish trade trigger, I’d be using invalidation of a daily close under 25.3K to exit the position to reestablish later from hopefully a lower point.
If I entered from the 2HR bullish trend shift on June 11 around $26K, I'd abandon this position at a loss of the initializing structure at $25.4K (grey line) on the 2HR chart because the prevailing daily trend is still down and I don’t want to ride the wave down.
If I jumped in randomly somewhere, I'd take the same conservative exit of a daily close under $25.3K.
If I'm not in daily chart BTC Shorts:
(Conservative Approach) Being near the bottom of the range ($24K-$28K), short is not the bias to have. Also, bullish divergences exist between price and momentum-based oscillators, suggesting the potential for bullish reversals. There are no conservative short-entry options at this time. I’d consider a short position if prices rally with daily closes no higher than $27K then fall and close under the lowest lows at $25.3K. In that event I’d look for a precision entry for the short on the 2HR timeframe, looking for prices to rally and test the $25.3K - $25.8K level with bearish reversal trade signals on the CSM.
(Risky Approach) Similarly to the conservative approach shorts are becoming less ideal. One possible entry would be a rally towards $26.8K - $27.2K on the 2HR chart with bearish divergences on most of the oscillators and a bearish trade trigger on the CSM would be a risky entry, but I'd keep a stop loss at closes above $28K.
If I'm in daily chart BTC Shorts:
(Conservative Approach) Being in a short position from anywhere above $27K should have some de-risking and partial profits would be taken at the lowest daily close of $25.7K as it is the bottom of the range, and the risk of bouncing back up is always possible. After partial profits, I’d not allow the position to become negative. A second position to consider trimming profits again on the position is the low support line at $24.5K. ‘Risky Approach’ entries above could be cues to add to the existing short position.
(Risky Approach) Similar to the ‘Conservative Approach’ above a short position anywhere above $27K should have some de-risking and partial profits would be taken at the lowest daily close of $25.7K as it is the bottom of the range, and the risk of bouncing back up is always possible. A breakdown and daily close from $25.7K presents a risky opportunity to add to the position and front-run a further decline. This is a less-than-ideal entry as the risk-to-reward ratio is pretty slanted to the risk side. As mentioned above, I’d target the low support line at $24.5K for partial profits, not allowing the position to become negative.
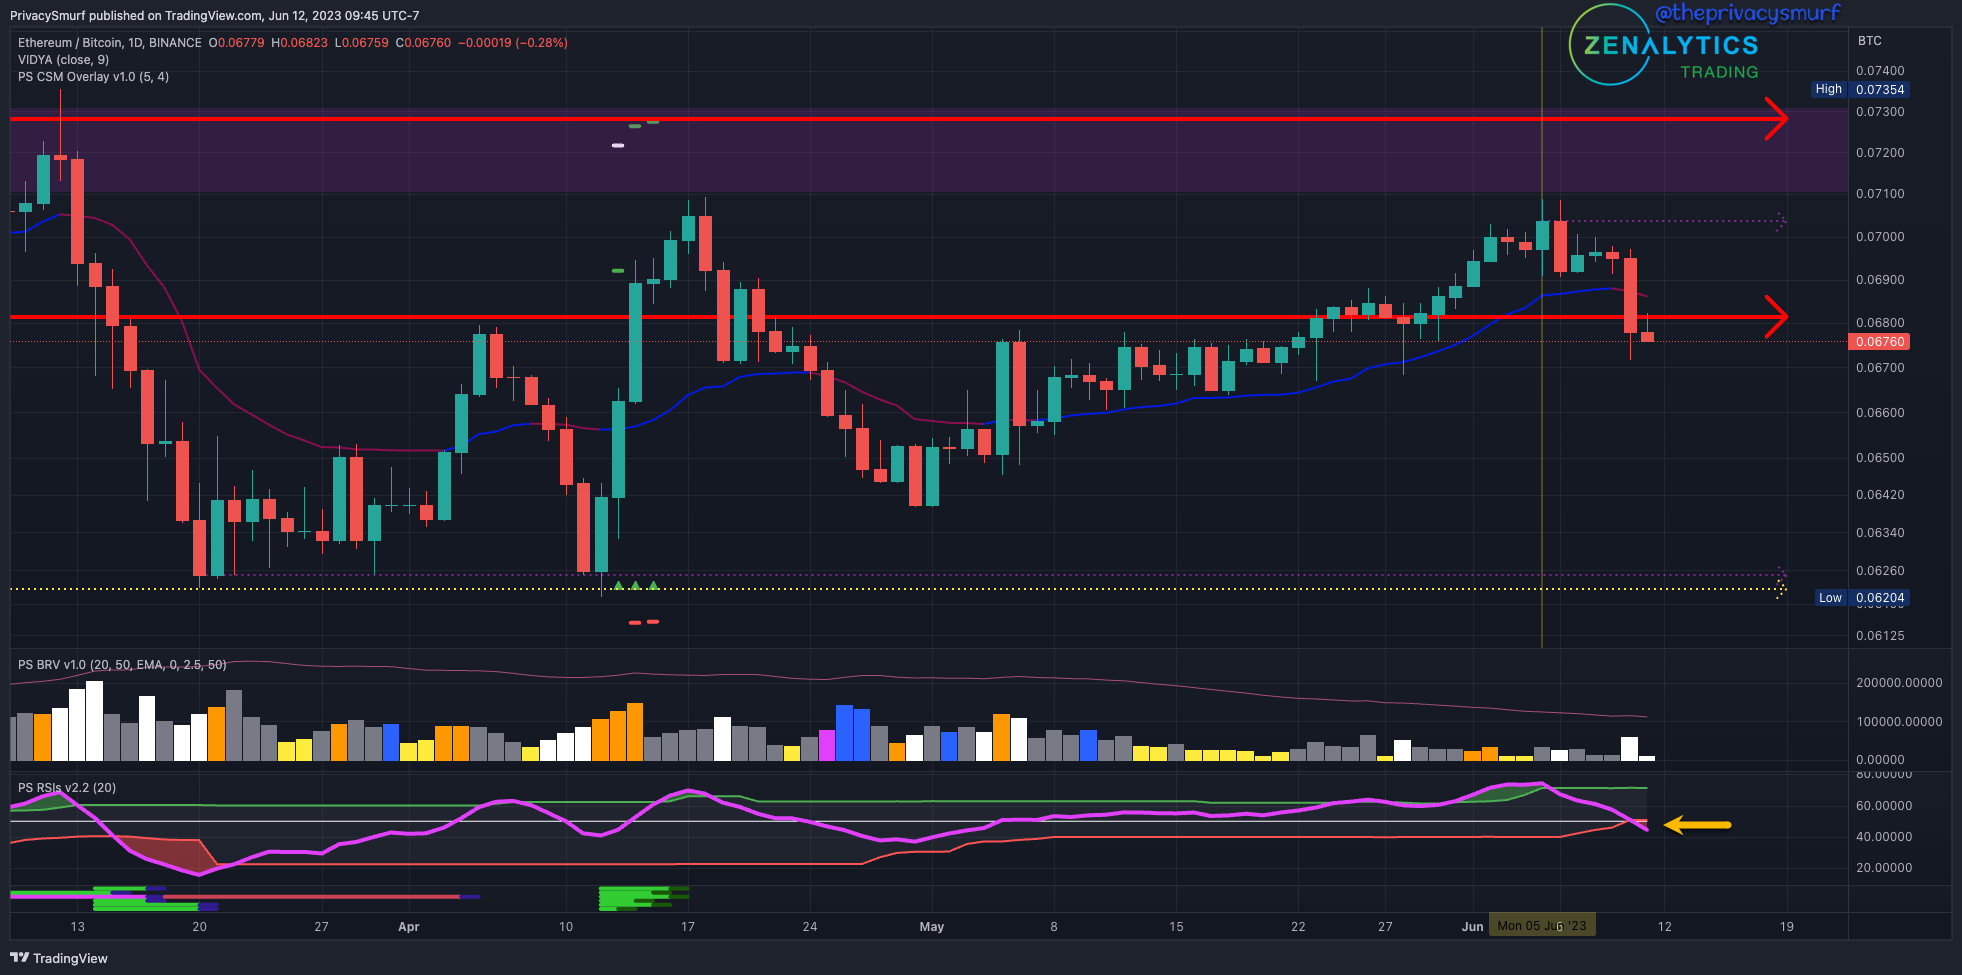
ETH/BTC Daily Chart
https://www.tradingview.com/chart/gTkSjkj6/
To execute these entries:
For longs, I’m:
rotating (selling) BTC into ETH or
buying ETH with USDT to sell in profit into BTC or
buying ALT (that presents with a similar ALT/BTC chart) to sell in profit into BTC.
For Shorts, I’m:
selling ETH or ALT (that presents with a similar ALT/BTC chart) into BTC or USDT.
If I'm not in daily chart ETH/BTC (or ALT) Longs:
(Conservative Approach) I'm not opening new longs at this level as prices are likely under resistance or notable prior highs. At a minimum, a daily close must come in above 0.068. At that point, a retracement to test that level on the 2HR timeframe leading to a bullish reversal trade trigger on the CSM would be a precision entry for the daily chart support test of the 0.068 level. I'd use the 2HR CSM stop-loss to negate the trade idea, as this is a conservative approach, and I'm not willing to take on a full stop as prices plummet from the failed support. Outside of technical factors, I'd consider a buy bid around the 0.062 - 0.064 level.
(Risky Approach) I'd consider opening new longs for the potential floor creation by monitoring the RSI. Waiting for a daily close with the RSI between the adaptive top and bottom bands would suggest the downside impulsive price action may be ceased. The 2HR timeframe would be important to monitor after this entry. If the lows of the daily chart AFTER the RSI is back in the bands are tested on the 2HR, and bullish divergences on the CSM are invalidated, I’d abandon the position as this would suggest a bearish price continuation.
If I'm in daily chart ETH/BTC (or ALT) Longs:
(Conservative Approach) The opportune time for bullish positions created while ETH/BTC was over 0.68 was to be closed out at the daily close on Jun 10 when the support level was broken. If positions weren’t exited at that time now, I’d be holding the position which is not ideal. ‘Risky Approach’ entries above could be cues to add to the existing long position and bring down the average entry price targeting the 0.068 resistance test to take initial profits.
(Risky Approach) Like the ‘Conservative Approach’ above a long position, anywhere above 0.068 should have been exited as the daily close at 0.06779 came under support. A bounce from a historical level at 0.065 presents a risky opportunity to add to the position and front-run a floor being set. This is a less-than-ideal entry as the risk-to-reward ratio is pretty slanted to the risk side since this level is in the middle of the trading range at 0.062 - 0.068. However, the 20min chart with bullish signals on the CSM (with no invalidations) and ideally the RSI curling back above the adaptive bottom band would be a cue to consider adding to the negative position.
If I'm not in daily chart ETH/BTC (or ALT) Shorts:
(Conservative Approach) If the conservative short entry condition after the support structure at 0.068 failed was missed, it became a waiting game for a better setup. An ideal cue for a rotation out of ETH and ALTs will likely not appear due to the current conditions. Ideal setups likely won’t appear until the lower regions are hit. A less-than-ideal condition would be at the 0.068 level resistance test. Intraday bearish signals on the CSM on the 2HR chart would be a cue to enter new short positions or rotate out of ETH and/or ALTs. However, if the RSI on the daily chart is moving up between the bands, this would potentially diminish the bearish possibilities.
(Risky Approach) Risky short entries or rotations back to BTC proposed last post of a daily close on the RSI measuring between the adaptive bands and bearish divergence triggers on intraday timeframes between 2HR - 6HRs came into play Tuesday in the early afternoon at around the 0.0695 level. If that entry was missed a less-than-ideal opportunity would be to watch intraday timeframes on the 2HR - 6HR charts. Invalidation of bullish divergences on the CSM around the 0.0645 to 0.065 level could signal the middle of the range won’t hold and may lead to wicking down to the 0.062 level. The daily chart’s RSI is critical for this option though. If it measures above the bottom band during this event, the rotation would be invalidated as downside price action in the daily context would be less likely.
If I'm in daily chart ETH/BTC (or ALT) Shorts:
(Conservative Approach) The option of entering shorts or rotating out of ETH & ALT positions on the daily close of 0.068 came into play on June 10 at the market close. Points to consider initial profit taking would be around the 0.064 - 0.065 region, ultimately targeting the floor at 0.062. ‘Risky Approach’ entries above could be cues to add to the existing short positions after initial profit taking, and the position should not be allowed to go negative if adding is executed.
(Risky Approach) Both options of entering shorts or rotating out of ETH & ALT positions occurred near the market close on Jun 06. The daily chart RSI measured back under the top adaptive band suggesting a ceiling had been formed, and the 2HR chart presented bearish reversal trade triggers on the CSM. This would be putting a short position (or being flat and not exposed to ETH and ALTs) on from around the 0.069 level. The same initial profit-taking levels on shorts would exist around the 0.064 - 0.065 level. ‘Risky Approach’ entries above could be cues to add to the existing short positions after initial profit taking, and the position should not be allowed to go negative if adding is executed.
ETH/USDT Daily Chart
https://www.tradingview.com/chart/xbB6lkZu/
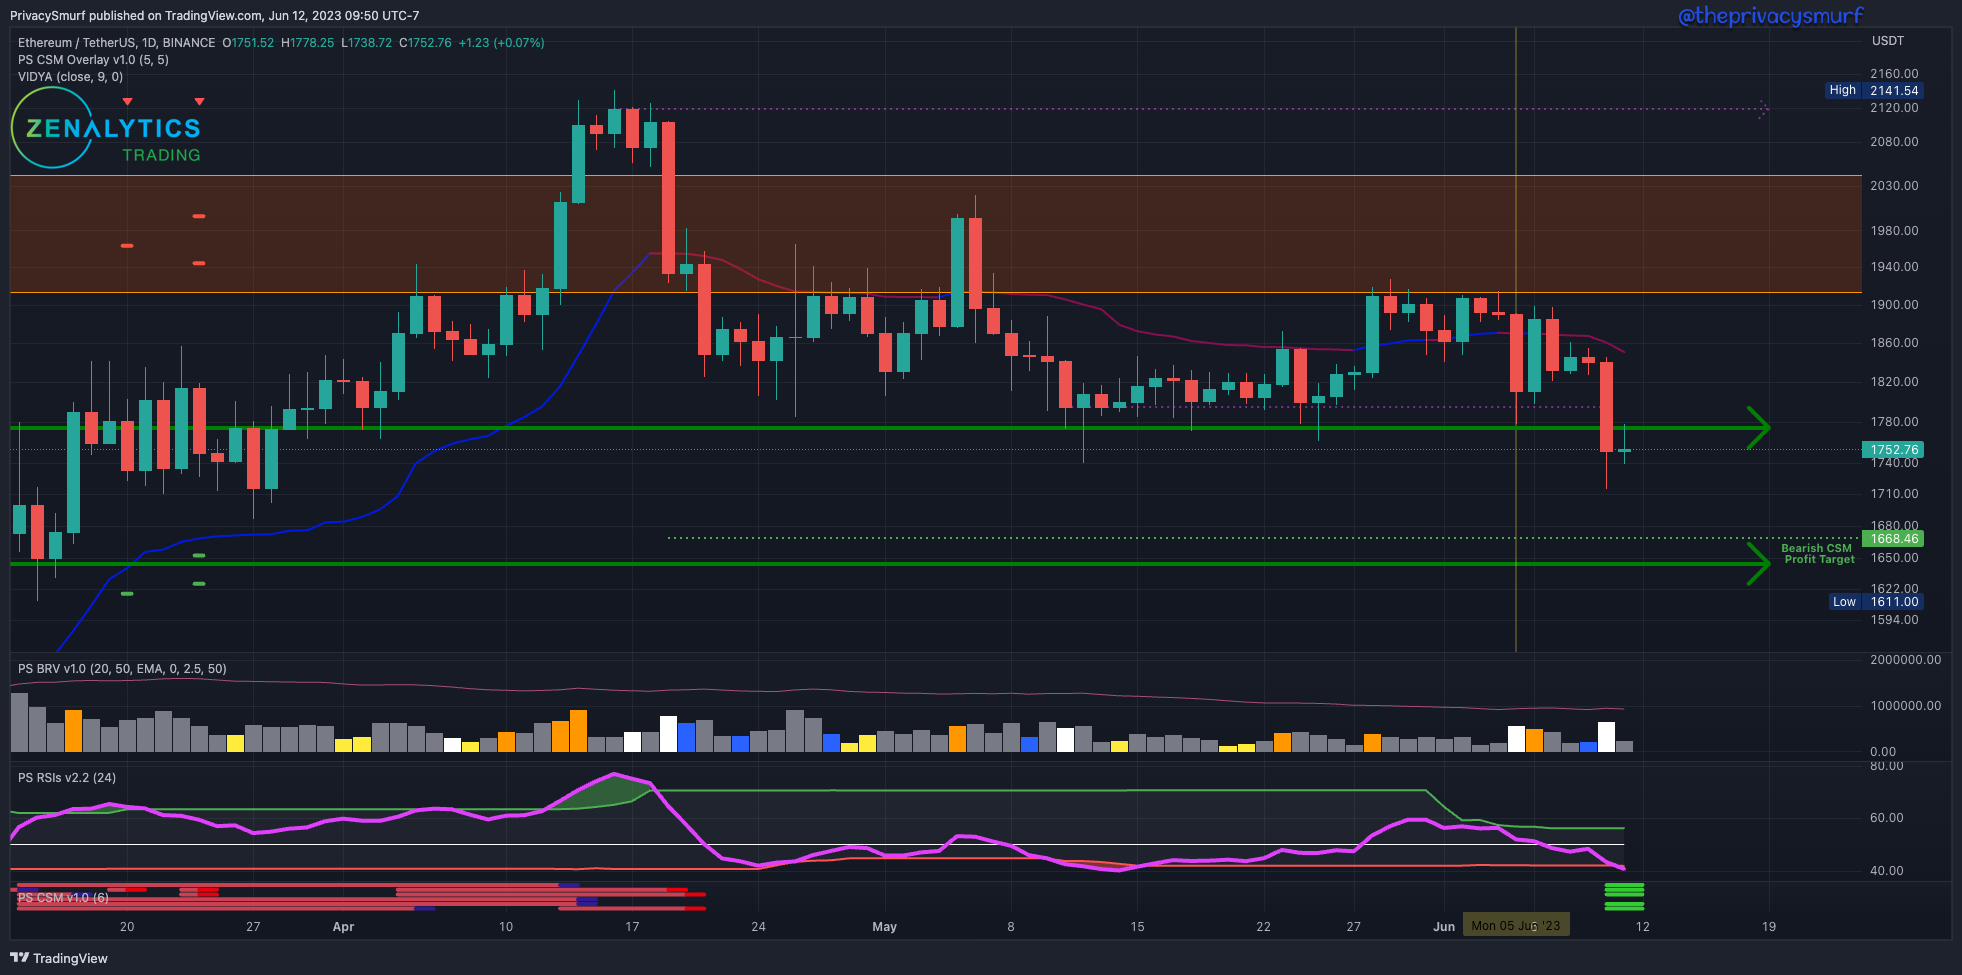
If I'm not in daily chart ETH/BTC (or ALT) Longs:
(Conservative Approach) I'm not opening new longs at this level since the structure remains bearish (lower low and lower high pivot points). A bullish reversal setup on the CSM has appeared since the lower low on June 10, but it is not a trade signal, just an alert to the bullish divergences. I'm waiting for one of three conditions to enter a new long position. The entry will determine the profit target location, regardless of whenever, wherever, or whichever occurs. Future commentary will be made as entries present themselves.
A change in structure to bullish, which may look like a daily close over $1845, a lower daily close on a red day yet above $1750, followed by a daily close than the first mentioned close. This would create a low close (on June 10), high close, higher low close, and higher high close which is the textbook bullish trend definition.
A confluence of signals, which may look like the RSI crossing above the midline on a green day and/or adaptive top band with higher relative volume (ideally two times the recent volume levels). There's no particular price level this needs to be or where I am expecting this to occur.
Outside of technical factors, I'd consider a buy bid at the green support line at $1644.
(Risky Approach) Since the last post, no risky entry presented itself. Now I would open new longs under three conditions. All would be targeting 28K at a minimum for initial profit taking.
Entry on the market close when/if the daily chart CSM bullish trade setup triggers
Entry on a 2HR chart structure shift to a bullish profile (higher low and higher high pivot points).
Entry on a 2HR chart CSM bullish trade trigger with RSI in ideal set up to cross the midline and adaptive top band
Entry on the RSI closing above the midline and top band on the daily chart.
These entries would target the $1780 level that broke down for initial profit-taking and use a daily close under $1644 to invalidate the idea and exit as the daily trend is still down.
If I'm in daily chart ETH Longs:
(Conservative Approach) With lower low closes and the breakdown of the support structure at 1780, if I'd not exited longs, there's no point in acting now. The opportune window to exit has since passed, and I'd hold my positions open unless a daily close comes in under the support level from March at $1668. As bullish divergences are starting to appear, lower lows are less likely than they were a few days ago. ‘Risky Approach’ entries above could be cues to add to the existing long position and bring down the average entry price. In the event of a rally, ideally, I’d target $1780 for initial profit taking.
(Risky Approach) Like the ‘Conservative Approach’ above a long position, anywhere above $1780 should have been exited as the daily close at $1751 came under support. A bounce from a historical level at $1668 presents a risky opportunity to add to the position and front-run a floor being set. However, the 20min chart with bullish signals on the CSM (with no invalidations) and ideally the RSI curling back above the adaptive bottom band would be a cue to consider adding to the negative position.
If I'm not in daily chart ETH Shorts:
(Conservative Approach) With the daily close under $1774, short exposure is warranted. Any rally on timeframes under 2HR to the recently lost support at $1774 showing a breakdown into bearish structure or bearish trade signals on the CSM could be executed ideally targeting the lower support at $1644 for initial profit-taking. A secondary entry could be considered if daily closes also appear under $1644. Although, the daily chart RSI would need to be below the adaptive bottom band and 2HR timeframes must not be in bullish reversal setups on the CSM.
(Risky Approach) Like the ‘Conservative Approach,’ a short position should be on as long as entry prices exceed $1730. Beyond that level, the risk-to-reward ratio becomes not ideal. If prices reach the low support level at $1664 if bullish divergences on the 20min and 2HR chart become invalidated that presents an opportunity to front-run more potential downside. This would target around $1530 for initial profits and ultimately around $1425.
If I'm in daily chart ETH Shorts:
(Conservative Approach) Being in a short position from anywhere above $1730 should have some de-risking and partial profits would be taken at the $1644 support as it is the bottom of the range, and the risk of bouncing back up is always possible. After partial profits, I’d not allow the position to become negative. ‘Risky Approach’ entries above could be cues to add to the existing short position.
(Risky Approach) Similar to the ‘Conservative Approach’ above a short position anywhere above $1730 should have some de-risking and partial profits would be taken at the $1644 support as it is the bottom of the range, and the risk of bouncing back up is always possible. A breakdown and daily close under $1644 presents a risky opportunity to add to the position and front-run a further decline. As mentioned above, this would target around $1530 for initial profits and ultimately around $1425.
If you are having difficulty processing this first issue, I understand, and I’m sorry. It’s tough reading about hypothetical scenarios that have played out already. But it’ll be less confusing next week and then on.
@theprivaysmurf