

Position Playbook #78
Position Playbook #78
Crypto Checkppoint Trade Management

This is the position management portion of the Crypto Checkpoint. The revamped format includes four detailed subsections for each asset, aiming to deliver more comprehensive insights into, a) managing open trade positions or b) seeking market exposure.
These subsections will be titled as follows:
"I'm in longs..."
"I'm not in longs..."
"I'm in shorts..."
"I'm not in shorts..."
Each of these subsections will offer a thorough overview of managing open trade positions or seeking market exposure, depending on the existing hypothetical market status.
I will maintain continuity by carrying forward the proposed management and expectations from the previous week's post.
The objective is to enhance clarity in using the market update posts (now renamed as Crypto Checkpoint) to ensure you have all the necessary information to approach the market in the same manner that I would. Managing positions can be complex, and I aim to equip you with the thought processes I use to navigate the markets efficiently. The posts are designed not to be read sequentially, but to be approached based on a current market status. Find the subsection that corresponds to your current position and start with that. Then, delve into other sections to understand past potential market movements.
I hope you find this new format beneficial, and I eagerly await your feedback as I strive to continually improve my posts. Thank you for your support, and I look forward to delivering more valuable insights in the future.
Each section will include the chart link and the weekly Crypto Checkpoint chart for reference.
Given the week's current technicals:
BTC/USDT Daily Chart
https://www.tradingview.com/chart/jjSdFW4b/

If I'm not in daily chart BTC Longs:
(Conservative Approach) Last week the second option of three presented itself on the 19th A green day closing above recent highs and resistance levels, while also seeing the RSI close above the midline and top adaptive band. Also earlier in the week, proposed ‘Risky Approach’ entries to bring down the average cost while decreasing risk to avoid closing out at a loss occurred. Conservative exposure was warranted. (On a side note, I said as much in the Monday morning post, including the choice of the song title.)

Jumping in now, after BTC has breached $28K and is at resistance near the top of the range, would not be a good choice if I had missed that entry. I'm waiting for one of two conditions to enter a new long position. In both of these scenarios, I would utilize a precision entry on the 2HR timeframe after the daily chart closes fulfilling one of the conditions. Both entries would be targeting the higher resistance around $29.5K for initial profit taking.
A change in structure to bullish, which may look like today’s daily close, a lower daily close on a red day yet above $25.8K, followed by a daily close greater than today's (June 20).
A daily close above the most recent highest close at $28065 while the RSI is still above the top adaptive band.
(Risky Approach) Currently, all three risky entry options have been presented and hit initial targets at $28K. If those entries had been missed I would be waiting for three conditions. Both entries would be targeting the higher resistance around $29.5K for initial profit taking.
A daily close above the most recent highest close at $28065 while the RSI is still above the top adaptive band. This would be exited with a daily close under $26.3K
The 2HR chart trading above the most recent highest close at $28065 entering when all the bearish divergences are invalidated on the Correction Strength Meter. This would be exited with a 2HR close under $26.7K.
A 2HR retracement, bullish trade signals on the CSM that come in above a 2HR or daily chart support with the RSI positioned to break above the midline and top adaptive band. This would be exited on the 2HR chart CSM stop loss.

If I'm in daily chart BTC Longs:
(Conservative Approach) For any entries under $27K, I’d be trimming some profits out of the position at $28K and moving the stop loss to break even to not allow the position to go negative. I’d be targeting $29.5K for additional profit taking. ‘Risky Approach’ entries above could be cues to add to the existing long position. For any entries above $27K, I’d be waiting for higher targets around $29.5K while considering exiting positions with a daily close or two under $26.3K or using the ‘Risky Approach’ entries above as cues to add to the existing long position.
(Risky Approach) Similar to the ‘Conservative Approach’ above, for any entries under $27K, I’d be trimming some profits out of the position at $28K and moving the stop loss to break even to not allow the position to go negative. I’d be targeting $29.5K for additional profit taking. ‘Risky Approach’ entries above could be cues to add to the existing long position.
If I'm not in daily chart BTC Shorts:
(Conservative Approach) Being near the top of the range ($24K-$28K), short is the bias to consider but not from a conservative standpoint as most daily chart technical factors are currently suggesting bullishness. There are no conservative short-entry options at this time. I’d consider a short position if prices rally with daily closes in the $29K - $30K range and the daily chart RSI is back under the adaptive top band. This would suggest the forming of a local ceiling. In that event I’d look for a precision entry for the short on the 2HR timeframe, looking for bearish trade signals on the CSM.
(Risky Approach) Similar to the ‘Conservative Approach’ above shorts are becoming less ideal. One possible entry would be a full bearish trade signal on the 2HR - 6HR timeframe, but I'd keep a stop loss closer than the full stop, exiting with a close above the most recent corresponding resistance on the corresponding timeframe. (For a 2HR chart bearish trade signal use a close above the highest 2HR resistance on the 2HR timeframe chart, etc.)
If I'm in daily chart BTC Shorts:
(Conservative Approach) With the daily chart technically presenting a lot of bullish cases a short position is becoming less and less ideal. I’d be considering exiting positions for a loss with a daily close above $28K. ‘Risky Approach’ entries above could be cues to add to the existing short position.
(Risky Approach) For any entries above $26.5K, this is not as bad a place to be in, but it’s still seemingly fighting against the market. I’d be considering exiting positions for a loss with a daily close above $28K or alternatively, use the ‘Risky Approach’ entries above as cues to add to the existing short position. I’d be taking initial profits out of the position at $26.5K and moving the stop loss to break even to not allow the position to go negative. I’d be targeting $25K for additional profit-taking if the move continued down.
I must stress again that being short the market in the daily chart context (or even really anything over the 4HR timeframe right now) is swimming upstream.
ETH/BTC Daily Chart
https://www.tradingview.com/chart/gTkSjkj6/

To execute these entries:
For longs, I’m:
rotating (selling) BTC into ETH or
buying ETH with USDT to sell in profit into BTC or
buying ALT (that presents with a similar ALT/BTC chart) to sell in profit into BTC.
For Shorts, I’m:
selling ETH or ALT (that presents with a similar ALT/BTC chart) into BTC or USDT.
If I'm not in daily chart ETH/BTC (or ALT) Longs:
(Conservative Approach) The CSM as of the June 20 close is showing 2 oscillators in bullish divergence setups but that alone is not a signal for rotation but does show momentum to the downside is starting to slow. However, I'm not opening new longs at this level just yet based on technical factors as the chart has been in free fall. Outside of technical factors, I'd consider a buy bid around the 0.062 - 0.064 level.
(Risky Approach) I'd consider opening new longs for the potential floor creation by monitoring the RSI. Waiting for a daily close with the RSI between the adaptive top and bottom bands would suggest the downside impulsive price action may be ceased. The 2HR timeframe would be important to monitor after this entry. If the lows of the daily chart AFTER the RSI is back in the bands are tested on the 2HR, and bullish divergences on the CSM are invalidated, I’d abandon the position as this would suggest a bearish price continuation.
If I'm in daily chart ETH/BTC (or ALT) Longs:
(Conservative Approach) The opportune time for exiting bullish positions created while ETH/BTC was over 0.68 was to be closed out at the daily close on Jun 10 when the support level was broken. If positions weren’t exited at that time, now, I’d be holding the position which is not ideal. ‘Risky Approach’ entries above could be cues to add to the existing long position and bring down the average entry price targeting the 0.068 resistance test to take initial profits.
(Risky Approach) Like the ‘Conservative Approach’ above a long position, anywhere above 0.068 should have been exited as the daily close on June 10 at 0.06779 came under support.
From the last post:
”A bounce from a historical level at 0.065 presents a risky opportunity to add to the position and front-run a floor being set. This is a less-than-ideal entry as the risk-to-reward ratio is pretty slanted to the risk side since this level is in the middle of the trading range at 0.062 - 0.068. However, the 20min chart with bullish signals on the CSM (with no invalidations) and ideally the RSI curling back above the adaptive bottom band would be a cue to consider adding to the negative position.”
This situation sort of presented itself intraday on June 18. The 20min CSM did give a full trade signal with no invalidations at the 0.065 level however the daily chart RSI was still well below the adaptive bottom band making an already risky proposition much less than ideal and worth skipping. If that was used however to average down the initial profit targets would remain at the 0.068 resistance level. A repeat of this process of adding to a negative position would also be something I’d consider in the 0.062 - 0.064 level under the same conditions as last week.
If I'm not in daily chart ETH/BTC (or ALT) Shorts:
(Conservative Approach) Being near the bottom of the range (0.062 - 0.068), being short is not a bias to have if not already exposed. Also, bullish divergences exist between price and momentum-based oscillators, suggesting the potential for bullish reversals. There are no conservative short-entry options at this time. Invalidation of bullish divergences on the daily timeframe along with a close under the 0.062 support level and I would consider a precision short entry from a 2HR chart rally that leads to bearish trade signals on the CSM. However, I’d be targeting the 0.058 level for initial profit taking and keep the stop loss close to not let the trade go negative beyond a daily close of 0.066 especially if RSI also crosses back above the adaptive bottom band because that would suggest a limiting of the potential downside.
(Risky Approach) Similar to the ‘Conservative Approach’ above shorts are becoming less ideal. There are two possible entries I’d consider. Both would be targeting the 0.058 level for initial profit taking and keep the stop loss close to not let the trade go negative beyond a daily close of 0.065 especially if RSI also crosses back above the adaptive bottom band because that would suggest a limiting of the potential downside.
The complete invalidations of bearish trade setups on the CSM on the 2HR - 6HR timeframe while prices are in the 0.062 - 0.064 region exiting on the stop loss from the giving timeframe of the taken signal.
The daily chart closing below the 0.062 level to possibly front-run the breakdown of the historic support.
If I'm in daily chart ETH/BTC (or ALT) Shorts:
(Conservative Approach) For any entries above 0.065, I’d be trimming some profits out of the position in the 0.062 - 0.064 level and moving the stop loss to break even to not allow the position to go negative. I’d be targeting 0.058 for additional profit taking. ‘Risky Approach’ entries above could be cues to add to the existing short position. For any entries below 0.065, I’d be waiting for lower targets at least under 0.062 (ideally 0.058) while considering exiting positions with a daily close above 0.065 or using the ‘Risky Approach’ entries above as cues to add to the existing short position.
(Risky Approach) Similar to the ‘Conservative Approach’ above, for any entries above 0.065, I’d be trimming some profits out of the position at the 0.062 - 0.064 level and moving the stop loss to break even to not allow the position to go negative. I’d be targeting 0.058 for additional profit taking. ‘Risky Approach’ entries above could be cues to add to the existing short position.
Being short now in the daily context at the bottom of this range is less than ideal and rotations into ETH and ALTs may soon start outperforming BTC if/when the bullish reversal on ETH/BTC triggers.
ETH/USDT Daily Chart
https://www.tradingview.com/chart/xbB6lkZu/
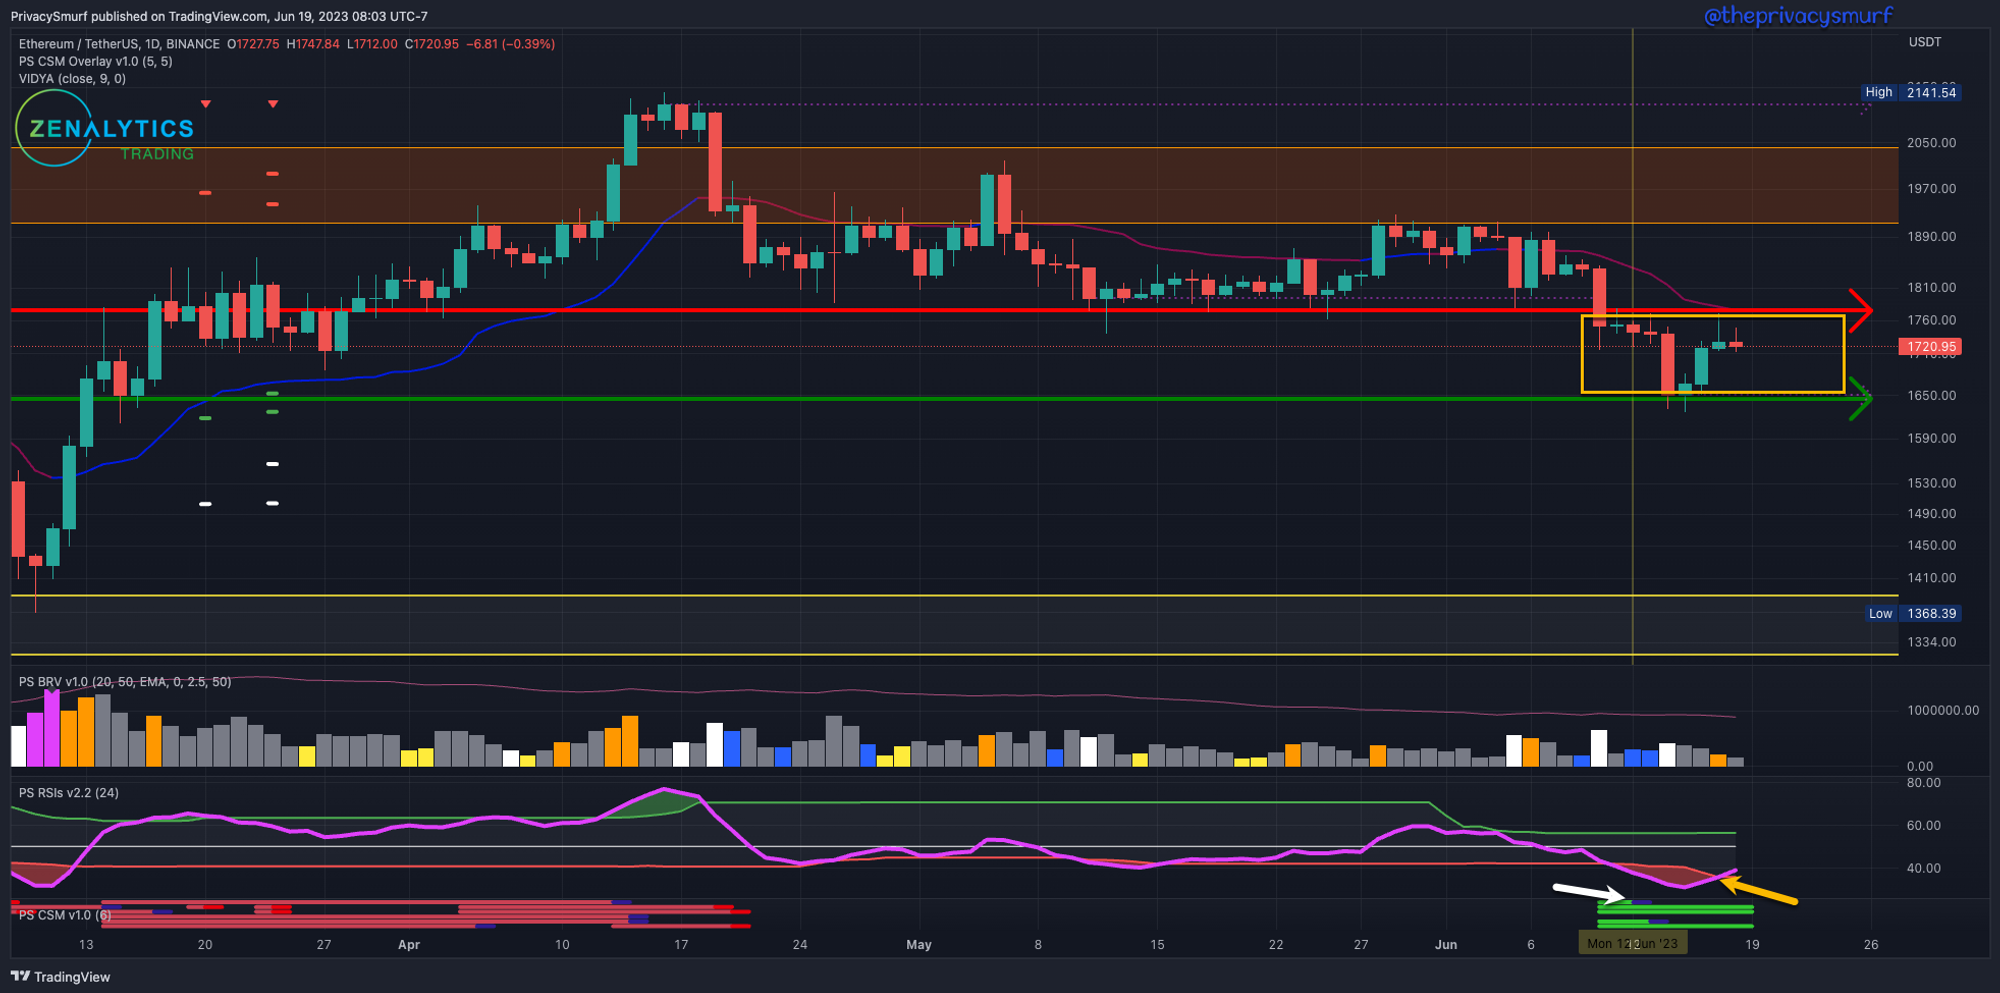
If I'm not in daily chart ETH Longs:
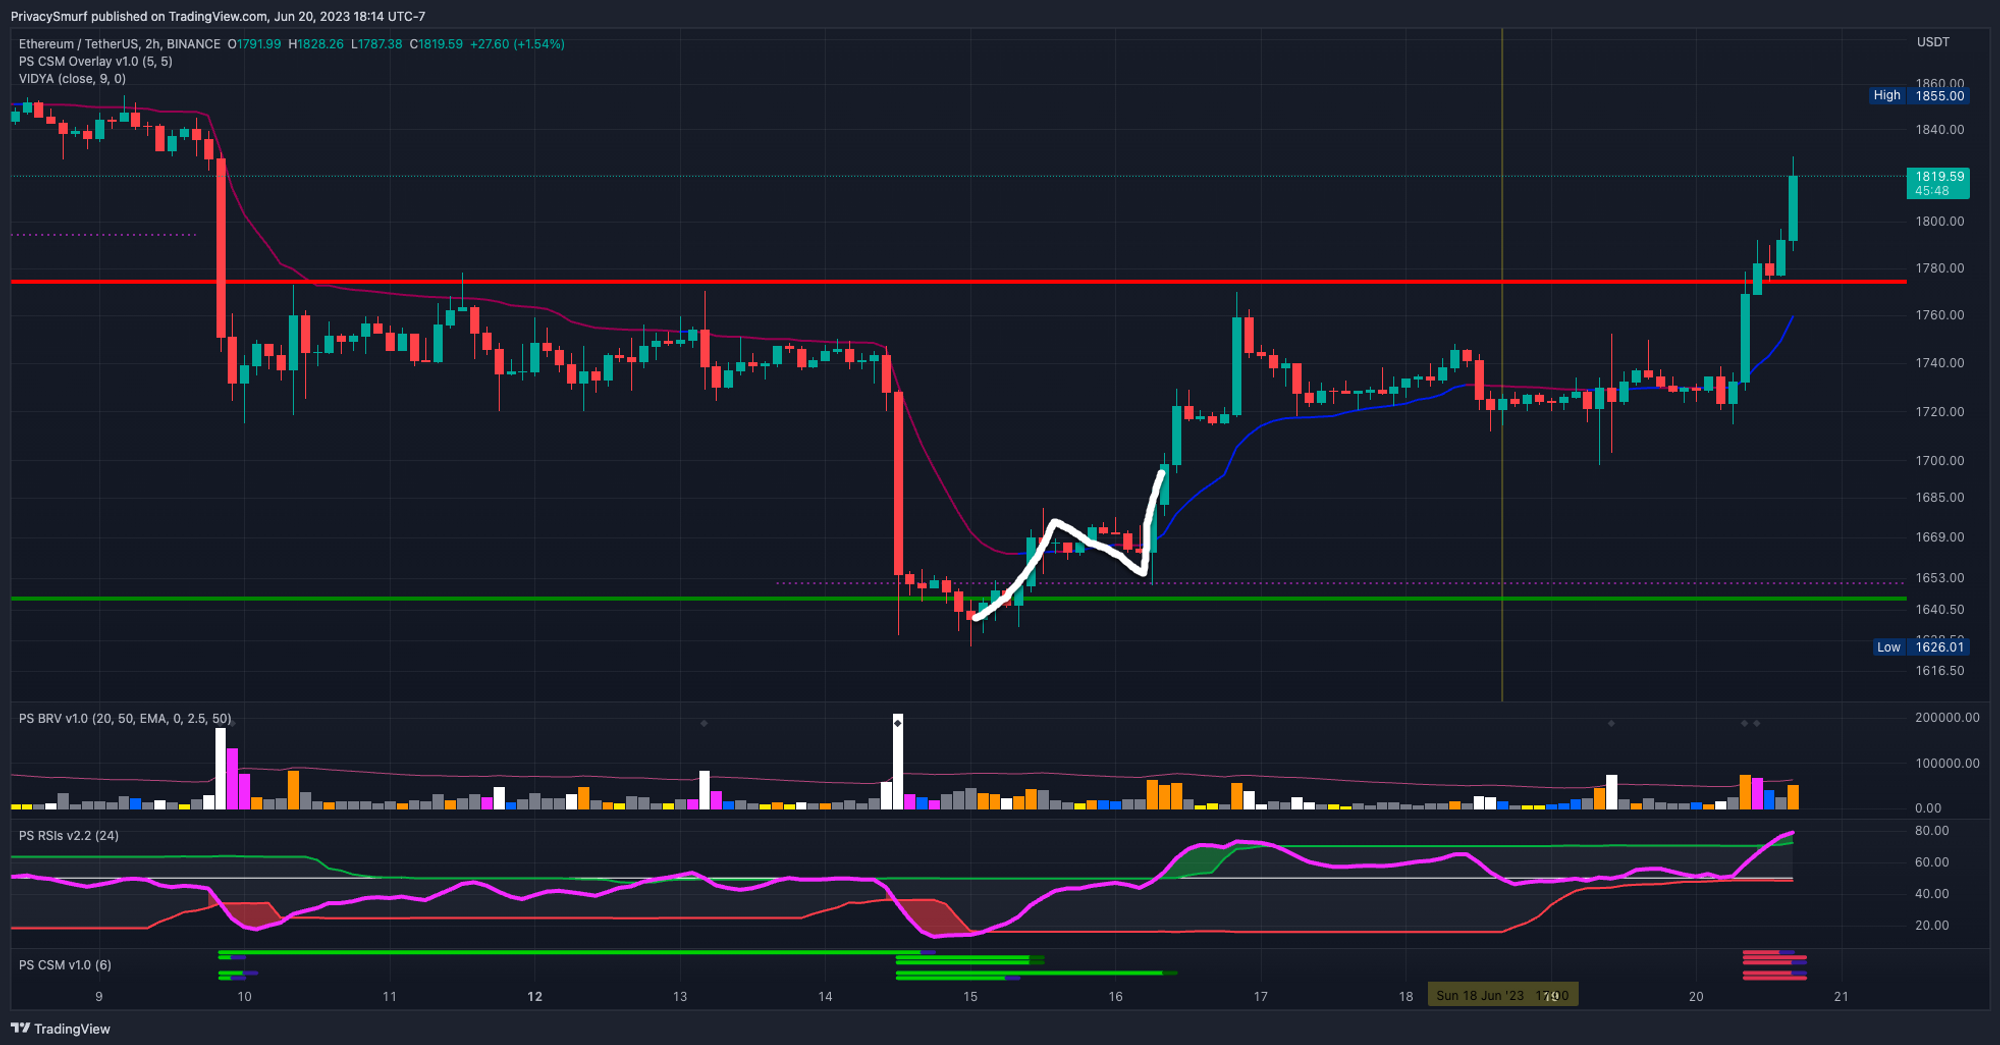
(Conservative Approach) Last week the third option of three presented itself on the 19th. A buy bid at the green support line at $1644. Also earlier in the week, the proposed ‘Risky Approach’ entry a 2HR bearish to bullish trend shift occurred depicted by the white drawn line below. Conservative exposure was warranted.

Jumping in now, after ETH has breached $1774, is not a good ‘conservative’ choice if I had missed the above entries. I'm waiting for one of two conditions to enter a new long position. In both of these scenarios, I would utilize a precision entry on the 2HR timeframe after the daily chart closes fulfilling with prices trading above $1774 and the RSI closing above the midline and adaptive top band while targeting at least the higher resistance around $1900 for initial profit taking.
(Risky Approach) Currently, only one of the risky entry options has been presented. If that entry had been missed I would be waiting for one of the other conditions.
Entry on the market close when/if the daily chart CSM bullish trade setup triggers targeting the indicated initial target for profit taking.
Entry on the RSI closing above the midline and top band on the daily chart targeting at least the higher resistance around $1900 for initial profit taking.
If I'm in daily chart ETH Longs:
(Conservative Approach) For any entries under $1700, I’d be trimming some profits out of the position after $1780 and moving the stop loss to break even to not allow the position to go negative. I’d be targeting $1900 for additional profit-taking. ‘Risky Approach’ entries above could be cues to add to the existing long position. For any entries above $1700, I’d be waiting for higher targets around $1900 while considering exiting positions with a daily close under $1650 or using the ‘Risky Approach’ entries above as cues to add to the existing long position.
(Risky Approach) Similar to the ‘Conservative Approach’ above, for any entries under $1700, I’d be trimming some profits out of the position at least above $1780 and moving the stop loss to break even to not allow the position to go negative. I’d be targeting $1900 for additional profit-taking. ‘Risky Approach’ entries above could be cues to add to the existing long position.
If I'm not in daily chart ETH Shorts:
(Conservative Approach) The short exposure proposed last week hit initial targets and would have been closed out afterward. Now, with ETH closing above the 1774 resistance, short is not the bias to consider. Along with this structure break, daily chart technical factors are currently suggesting bullishness. There are no conservative short-entry options at this time. I’d consider a short position if prices rally with daily closes in the $1950 - $2050 range and the daily chart RSI is back under the adaptive top band after a break above. This would suggest the forming of a local ceiling. In that event I’d look for a precision entry for the short on the 2HR timeframe, looking for bearish trade signals on the CSM targeting the $1774 level for initial profit taking and abandoning the position upon daily closes above $2075.
(Risky Approach) Similar to the ‘Conservative Approach’ above shorts are becoming less ideal and no risky entry conditions from last week occurred. One possible entry would be a full bearish trade signal on the 2HR - 6HR timeframe, but I'd keep a stop loss closer than the full stop, exiting with a close above the most recent corresponding resistance on the corresponding timeframe. (For a 2HR chart bearish trade signal use a close above the highest 2HR resistance on the 2HR timeframe chart, etc.)
If I'm in daily chart ETH Shorts:
(Conservative Approach) With the daily chart technically presenting a lot of bullish cases a short position is becoming less and less ideal. For any entry below $1774, I’d be considering exiting positions for a loss with a daily close above $1900. ‘Risky Approach’ entries above could be cues to add to the existing short position.
(Risky Approach) For any entries above $1774, this is not as bad a place to be in, but it’s still seemingly fighting against the market. I’d be considering exiting positions for a loss with a daily close above $1900 or alternatively, use the ‘Risky Approach’ entries above as cues to add to the existing short position. I’d be taking initial profits out of the position at around $1730 and moving the stop loss to break even to not allow the position to go negative. I’d be targeting $1650 for additional profit-taking if the move continued down.
I must stress again that being short the market in the daily chart context (or even really anything over the 4HR timeframe right now) is swimming upstream.
Hope everyone took advantage of the green. Have a great week.
@theprivaysmurf