

Pre-Trip Data (and BTC?) Dump: Stomp Your Feet and Clap Your Hands.
Pre-Trip Data (and BTC?) Dump: Stomp Your Feet and Clap Your Hands.
To BTC: I know it's been a hard one baby. We're hanging on, we're getting by. You have my heart, my money, take it.

So I’ve been working hard to try and finish the educational site before my trip, but I just couldn't complete it in time. It will have to drop in 3 weeks. I hate leaving things on my to-do list while I’m away, but it is what it is. The market has been essentially unchanged since the last posting as we continue to range at support, but there are some upcoming things to be aware of. This post will attempt to bridge the gap between now and the last. Also, it is a precursor to the Q4 forecast post, which will be released on my return.
Let’s get to it.
Weekly Structure:
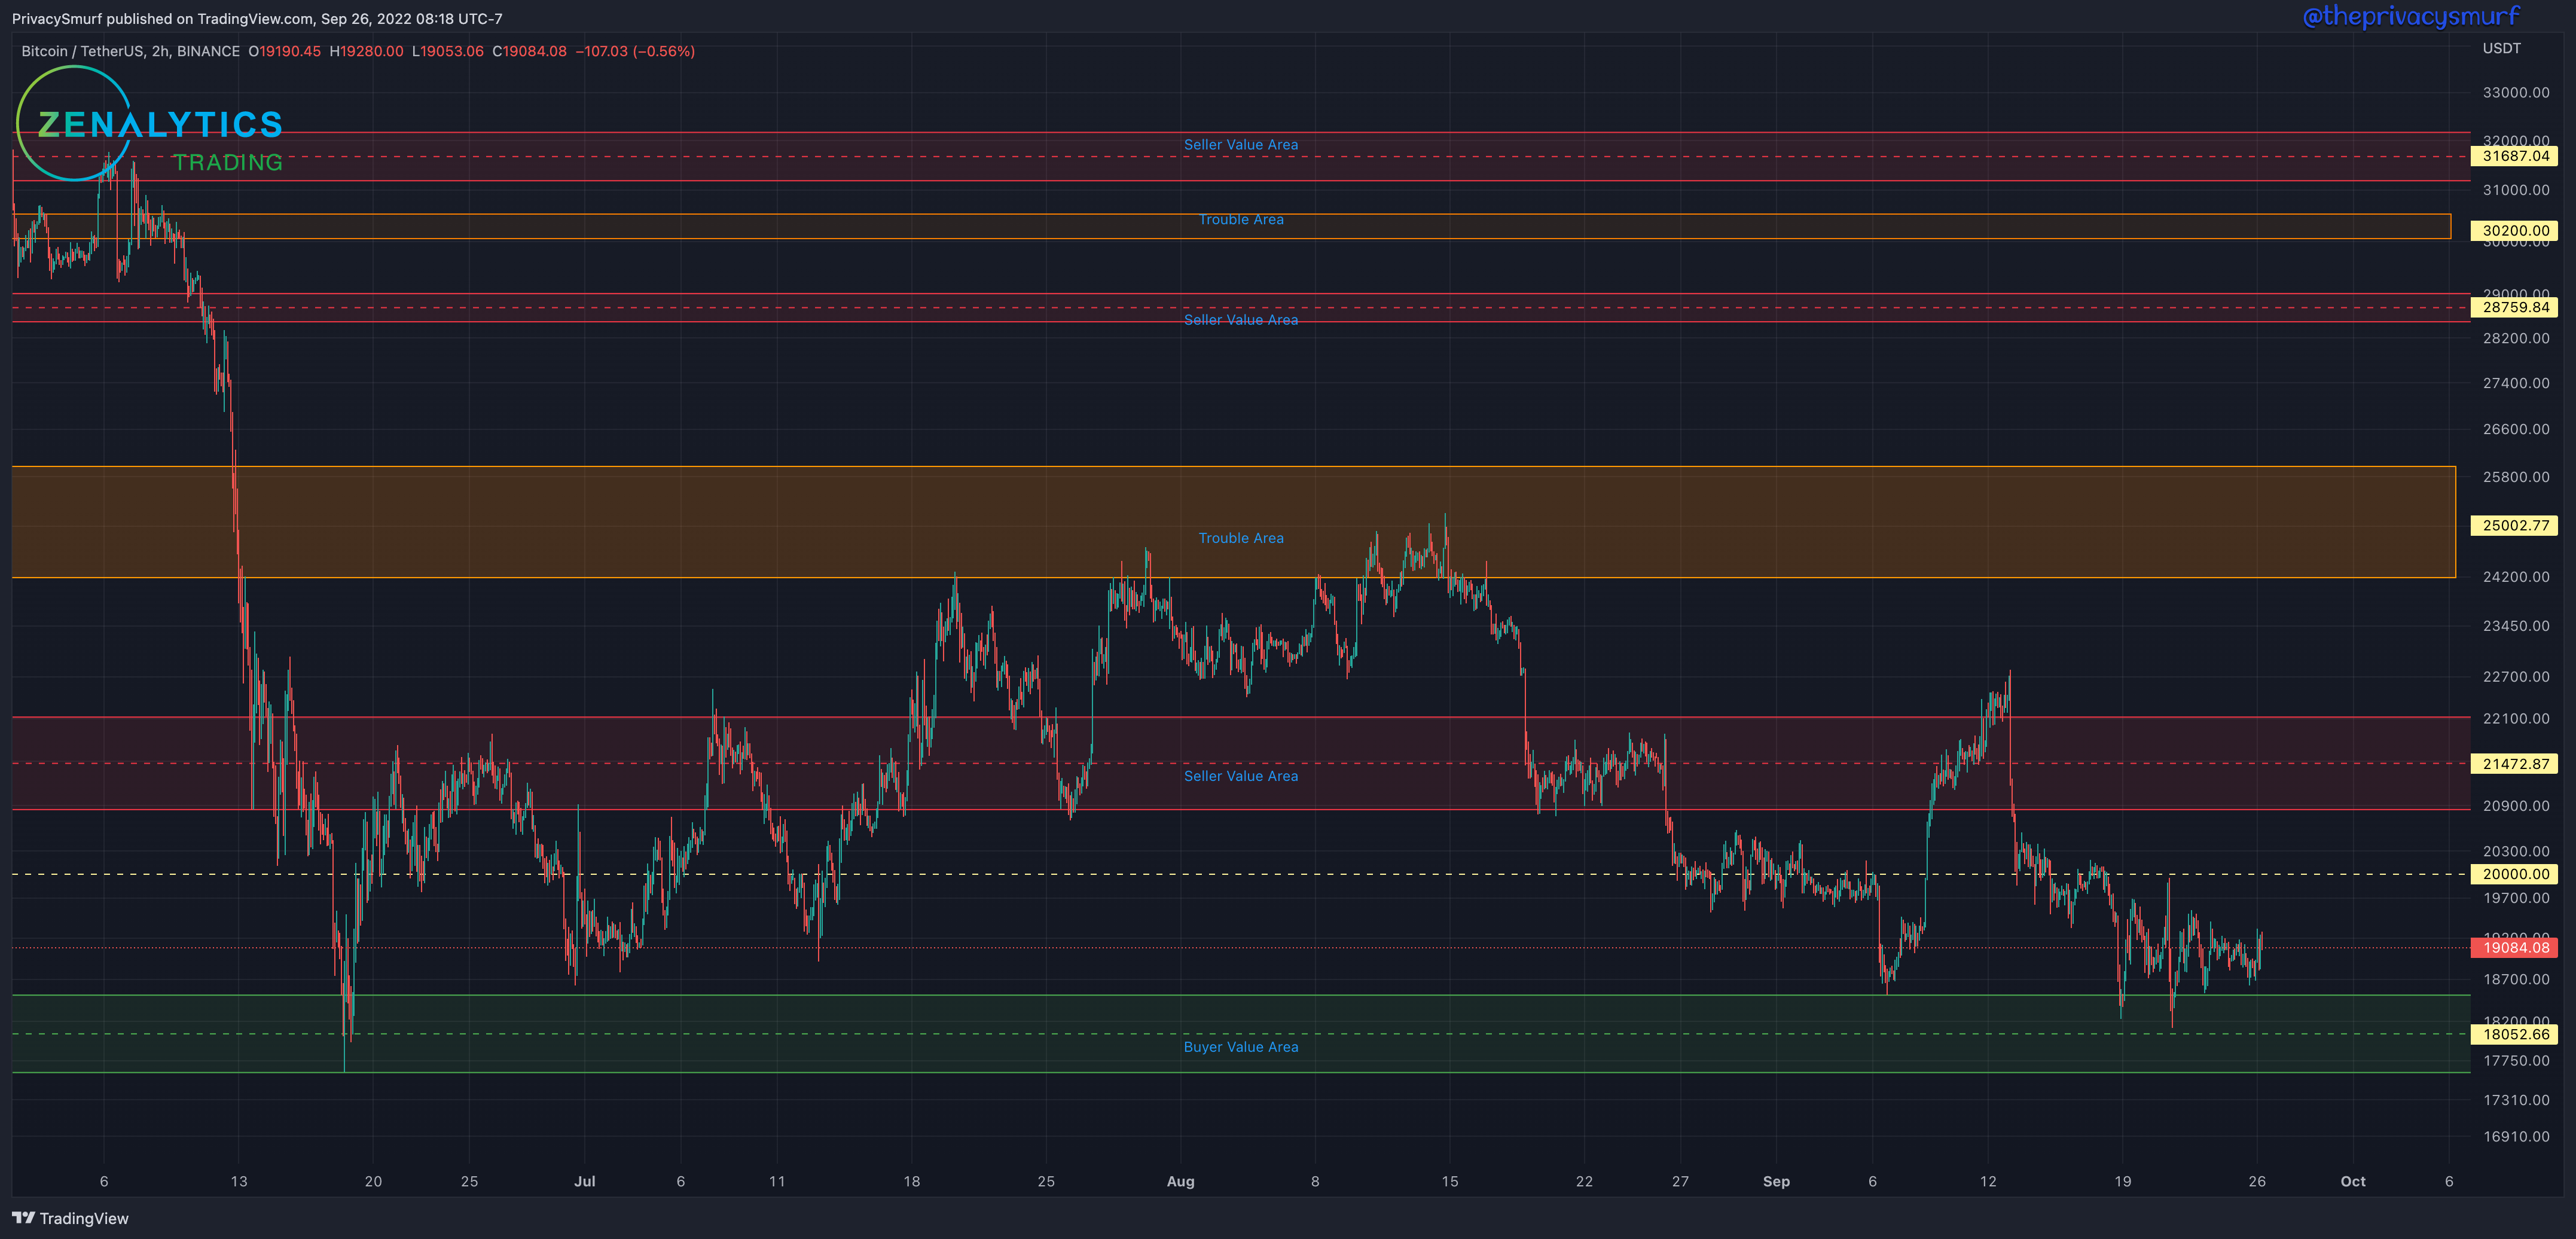
BTC/USDT

By my methods of determining market structure, BTC is still maintaining a bearish structure. Currently, $18184 is the only thing keeping BTC from potentially testing as low as $10k. Dollar-cost averaging at these two locations would be something to consider for long-term investing.
ETH/BTC
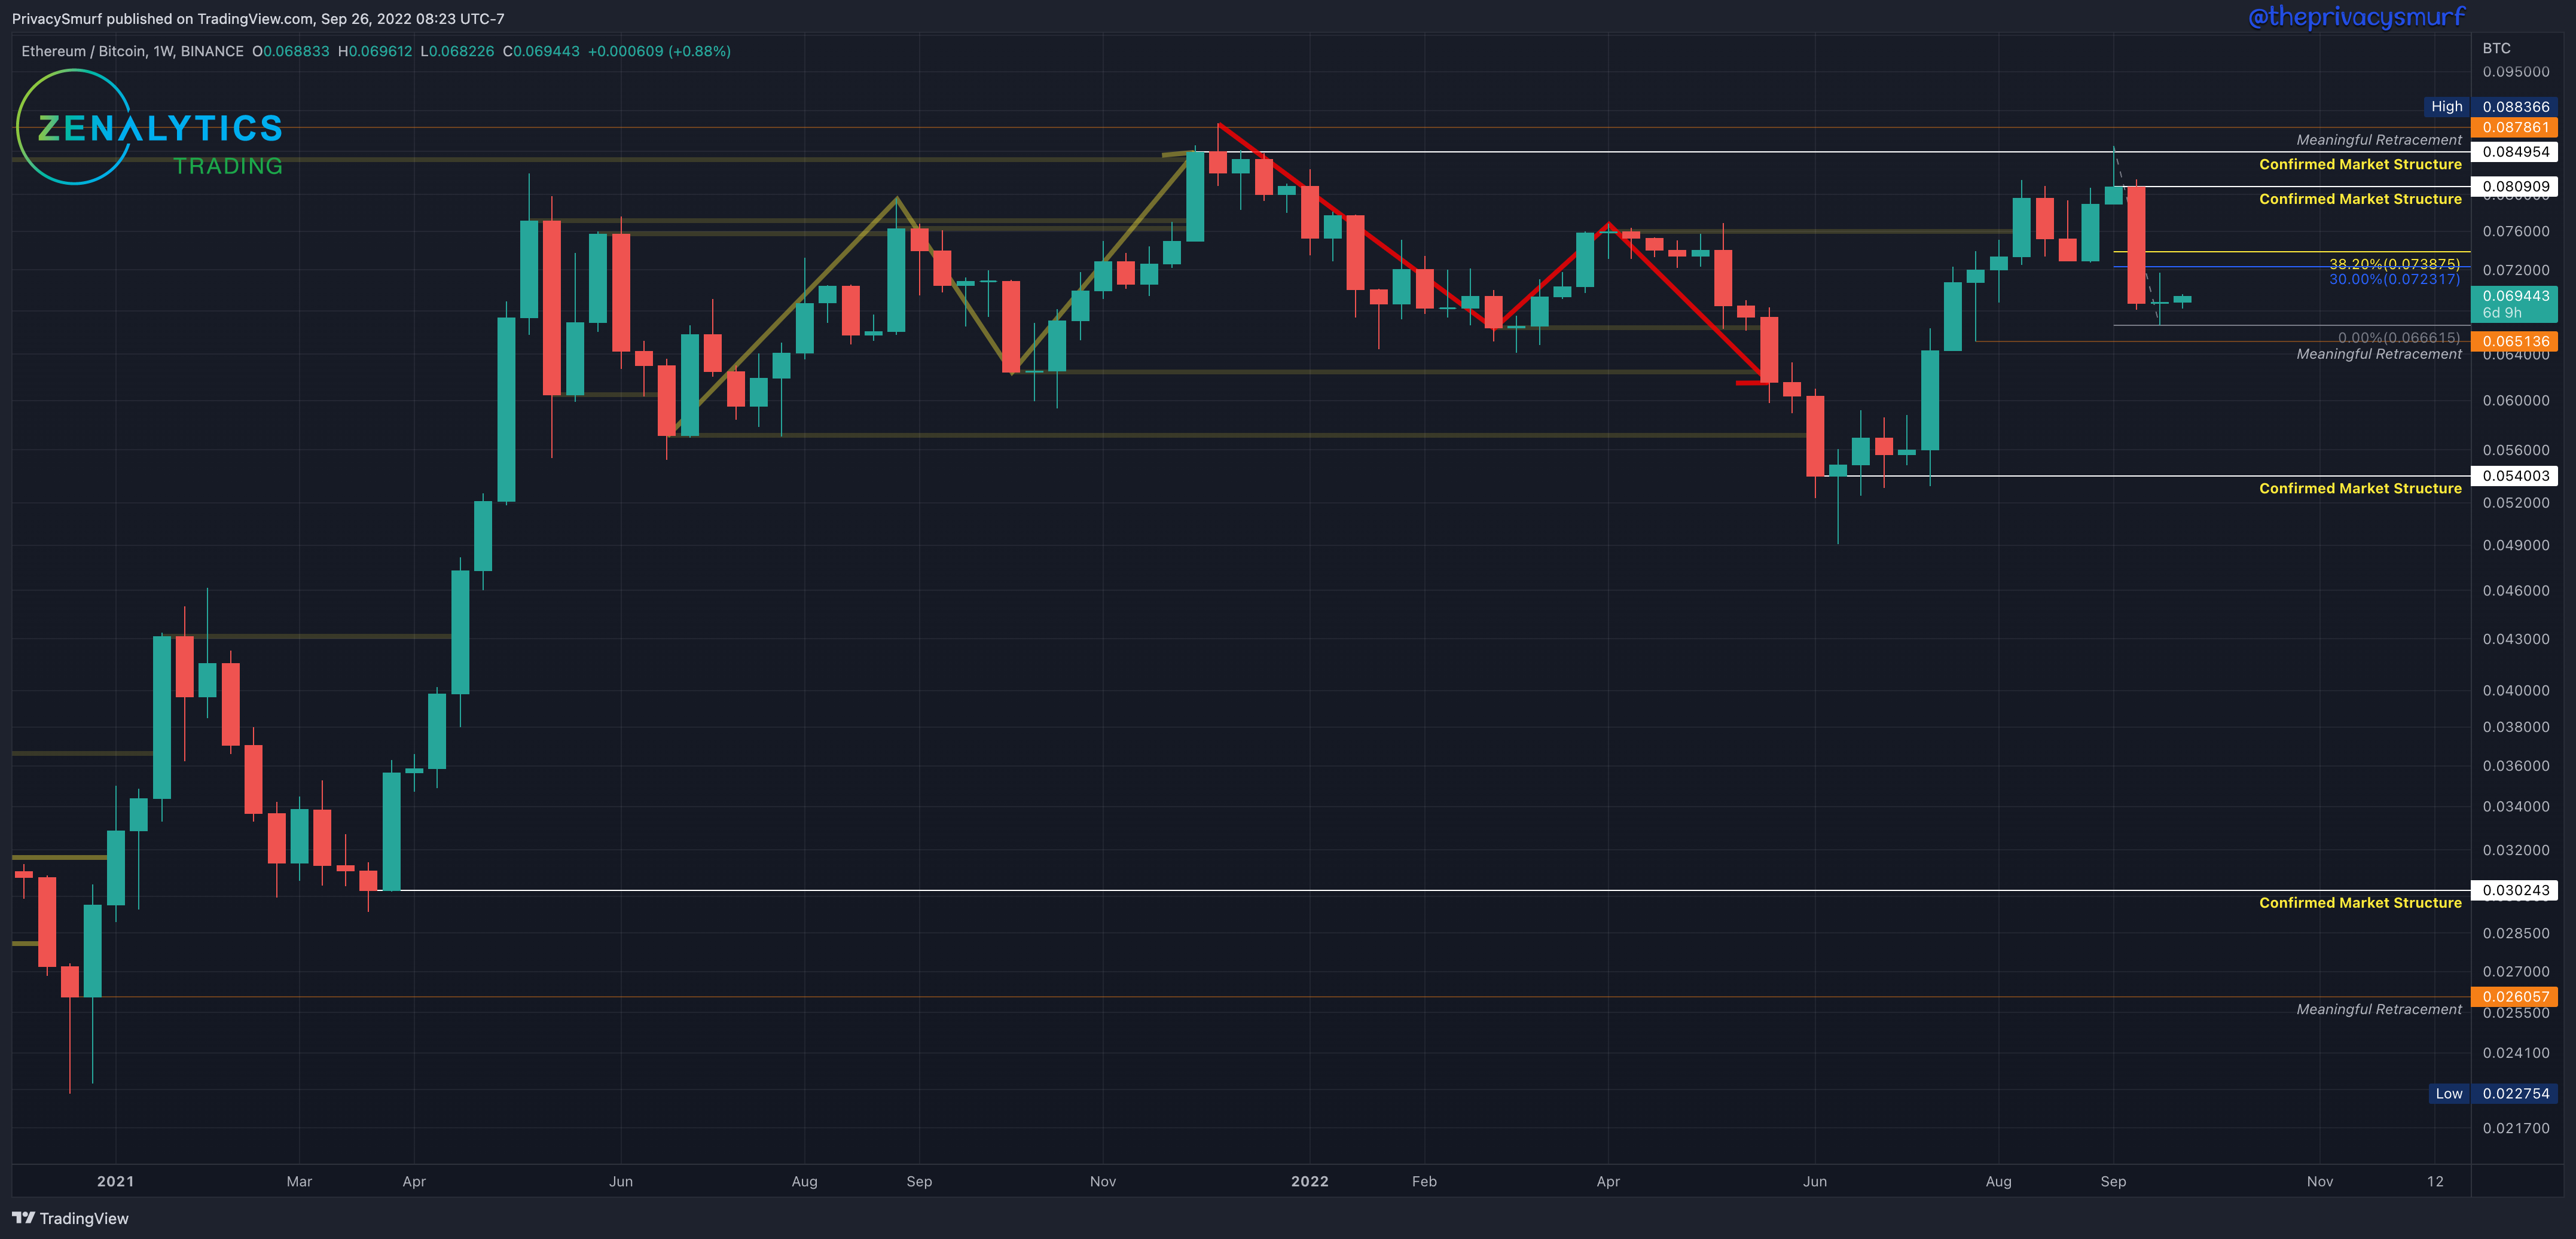
As of the last posting ETH/BTC while still in a bearish structure, has set a higher close that broke resistance at 0.076 AND confirmed a new market structure resistance at 0.0809. A rally from this point and a weekly close over 0.0738 will secure the lowest weekly close in this retracement over the last two weeks as a market structure support. If a following higher high close comes in over 0.0809, that will change the market structure trend to bullish. There is potential support at 0.651. Dollar-cost averaging at 0.0651 and 0.054 would be something to consider for long-term investing.
ETH/USDT

In the last two weeks, ETH has reaffirmed a bearish market structure trend by methods I employ since it broke structure support at just over $1400. There are not two structure resistances above the current price at $1935 and $1766. The last structure support level is at $1074. Beyond that, there is potential support at $352. I am extremely hesitant to suggest that the price will get that low. If the structure just below is broken, support will likely come in before that, but it’s not an impossibility. Regardless the low structure and $300s (which would be wild) are both locations to be considered for dollar-cost averaging for long-term investing.
I’m gonna stick with the long-term picture for a minute.
Q3 Forecast Updates:
If you’d like to review:

Adjusted SOPR
Here’s a quick link to what it is if you need a refresher.

Above, you can see Bitcoin history and the aSOPR on the bottom. I have a cycle overlay of aSPOR on the price chart. The green arrows mark the time when the aSOPR started to deviate from the cycle projections and showed the beginning of coins being sold for losses. If the pattern continues, we still have a period of heavier losses. Max pain may not have appeared yet. The deviation appears in the cycle post a price peak followed by a few cycles of price decline/capitulation. We have yet to see a cycle of post-deviation capitulation. That may be on the horizon for October and November.
BTC Drawdown from All-Time High

Cycles in drawdown from peaks would suggest a short-term peak right now with some slight drawdown into early October with another bear market rally (but I’d expect more consolidation and/or losing supports) through December.
ETH/BTC
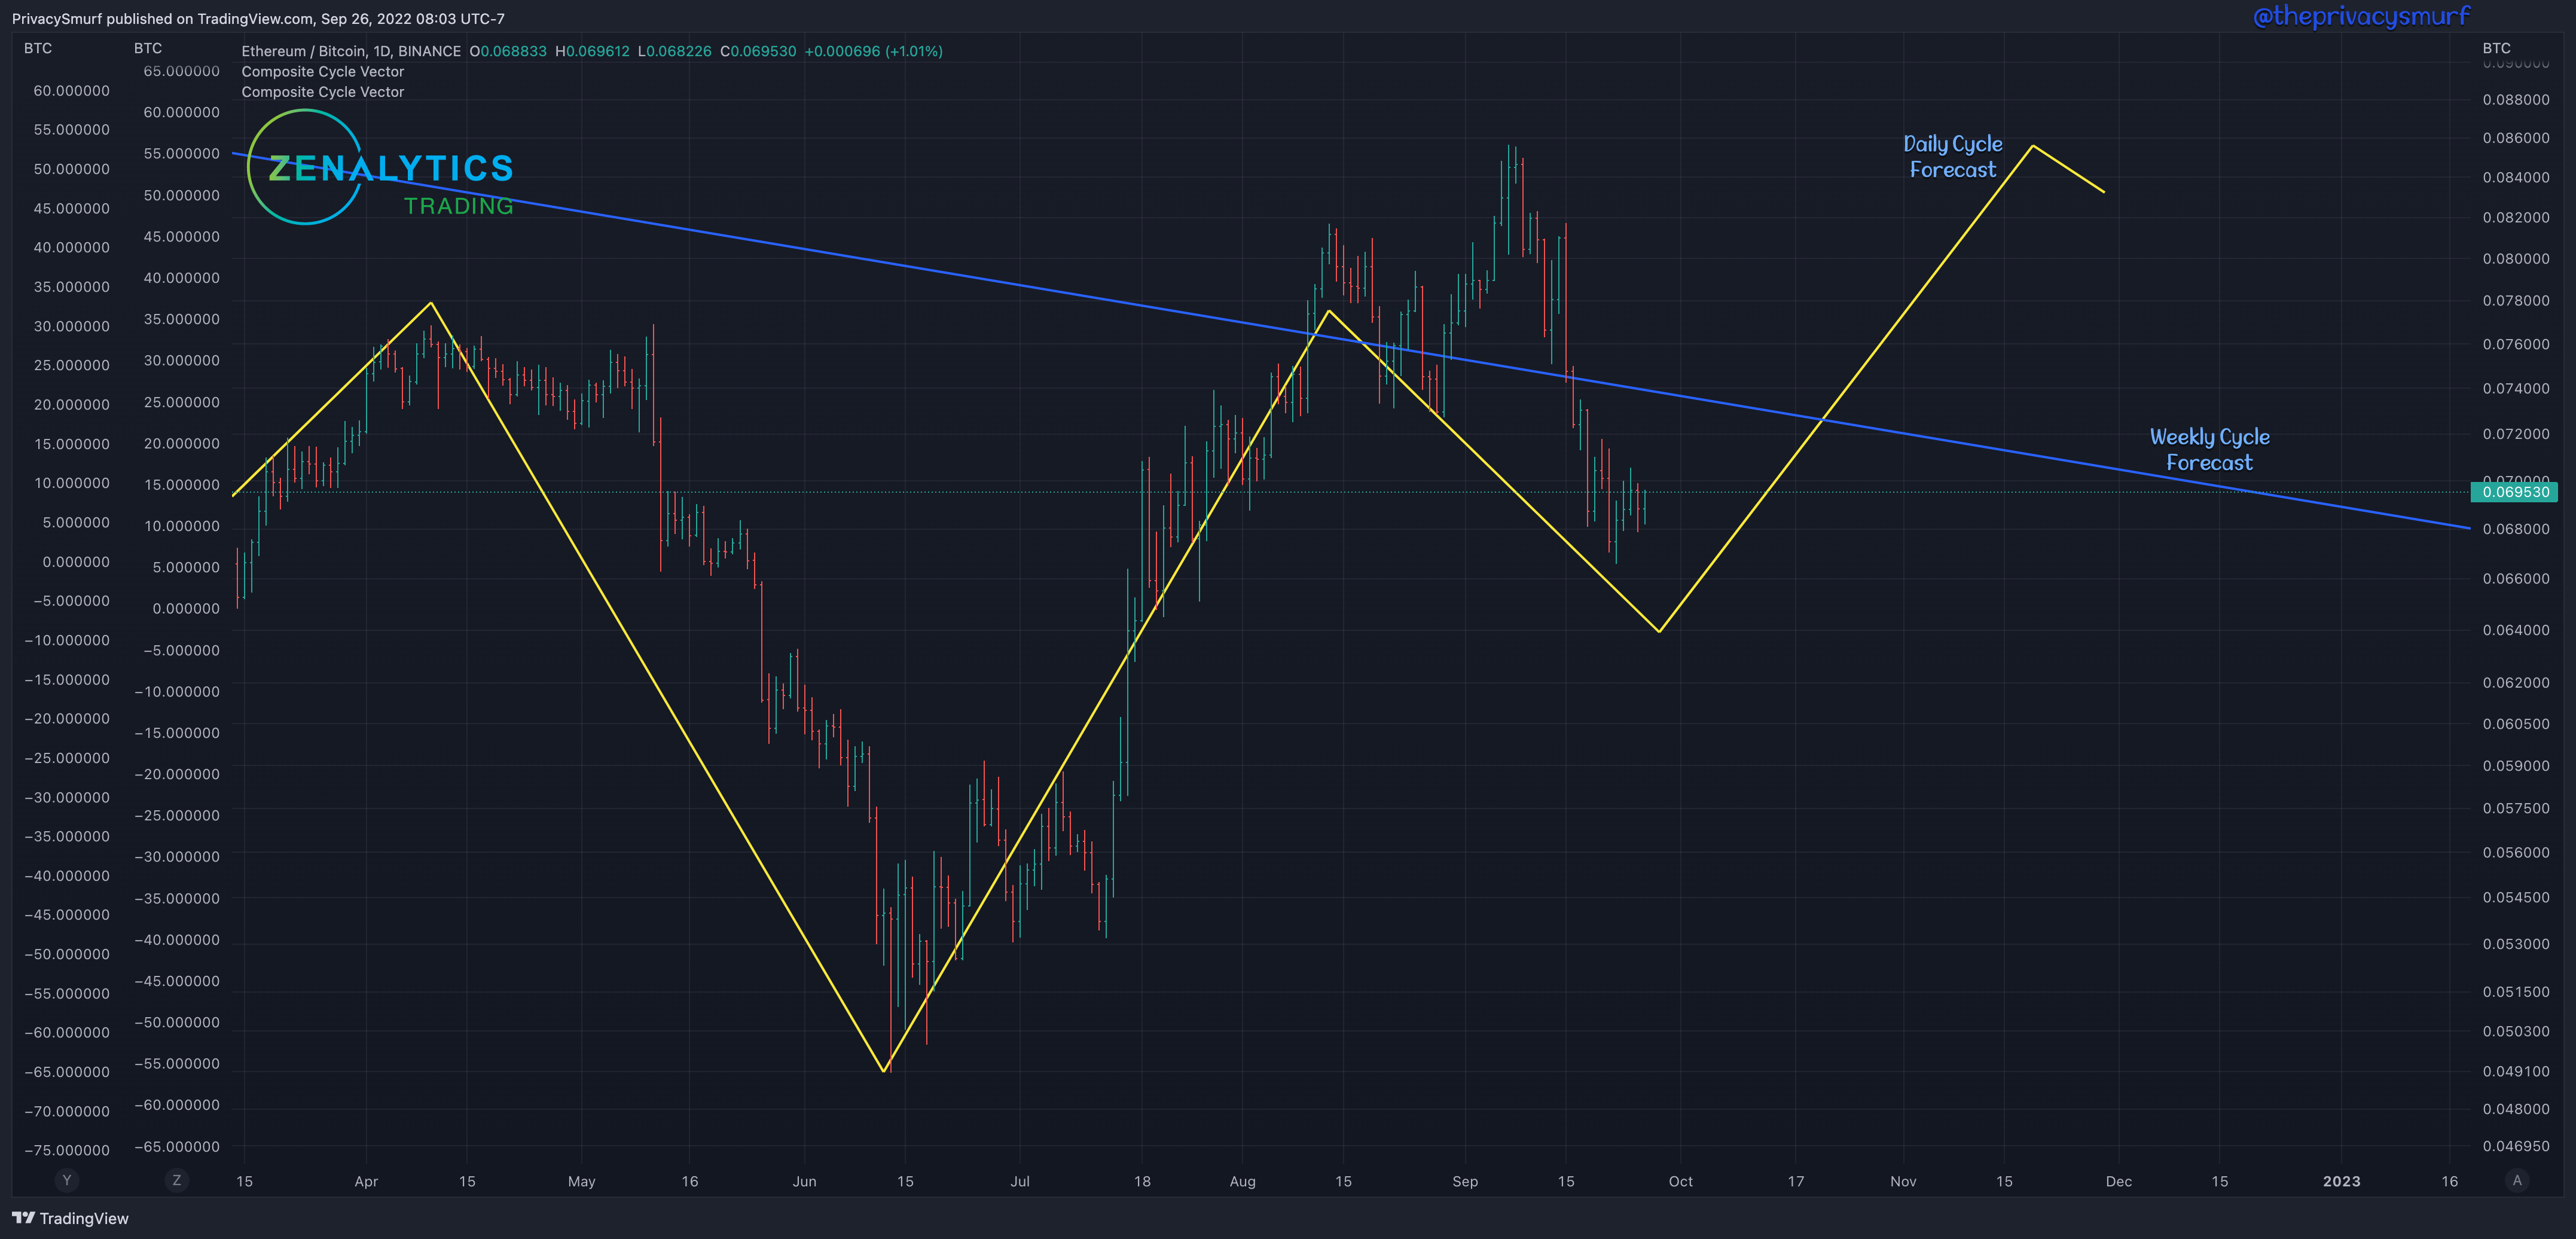
The ETH/BTC cycle has played out very well and would suggest some bottoming to occur soon in the value relationship of ETH to BTC. I’m not anticipating a big rally here, but BTC may not hold up as well as ETH does soon. Keep in mind the weekly cycle is still down here, so the overall move is working against the tide.
Total Crypto Marketcap
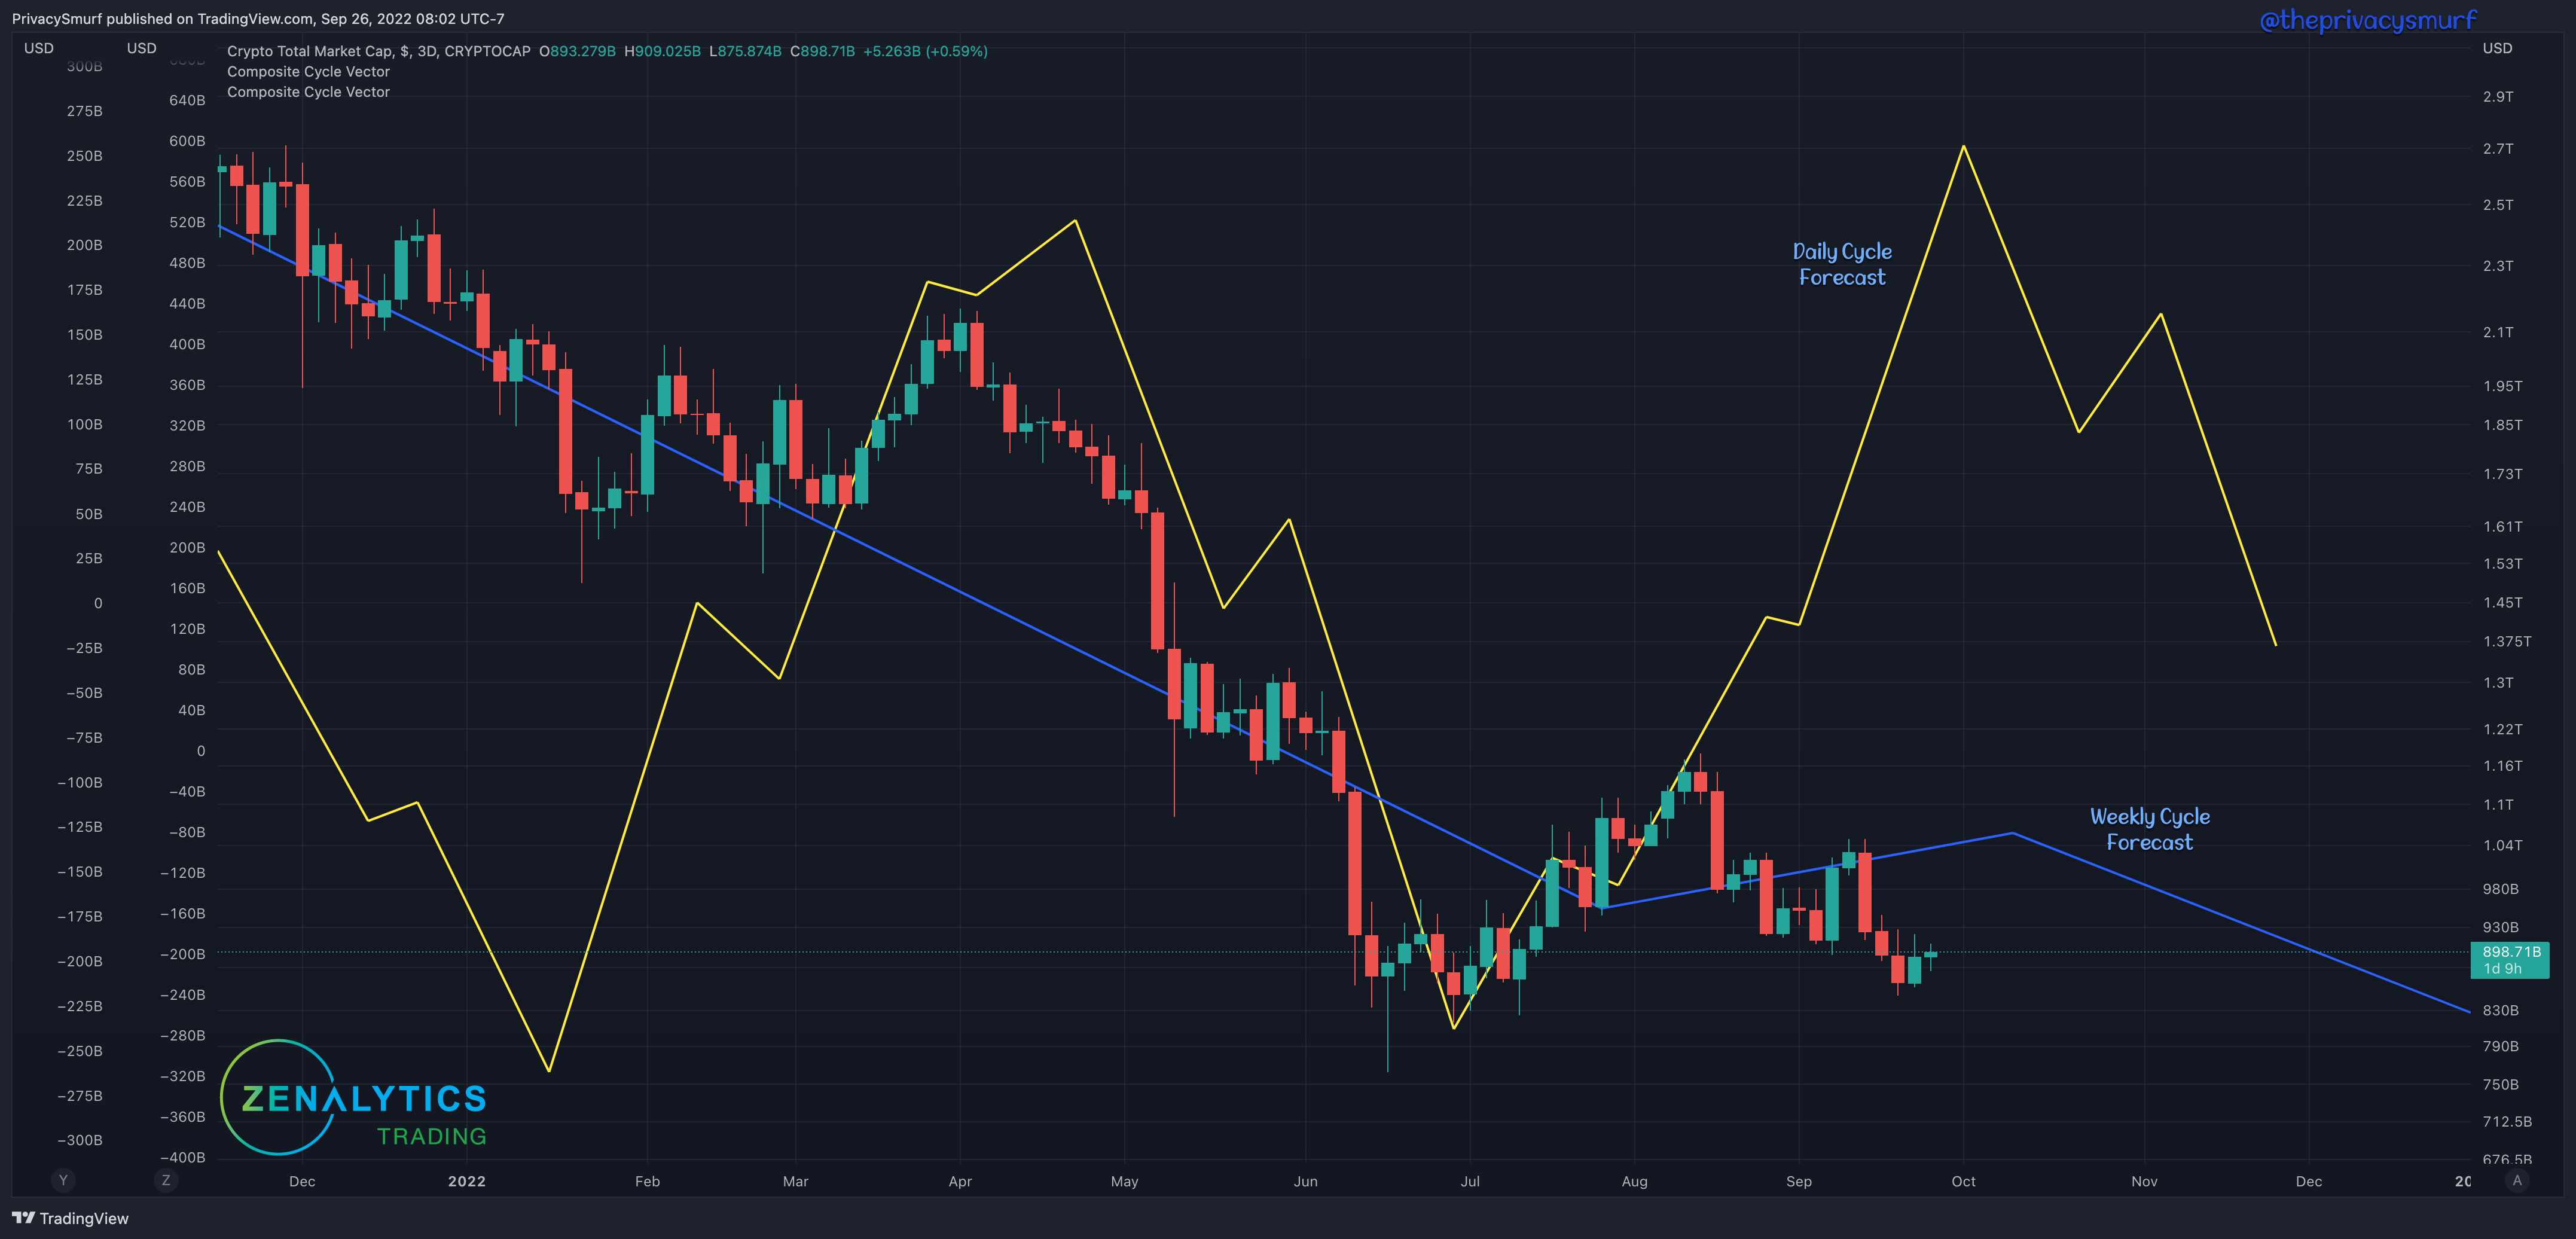
While technically not current, the daily and weekly projections from the Q3 forecast suggest the bear market rally and pause from the downtrend we’ve experienced since June would end soon. The ranging consolidation we’ve been experiencing may soon be in contention with bearish cyclical alignment on a higher timeframe scale.
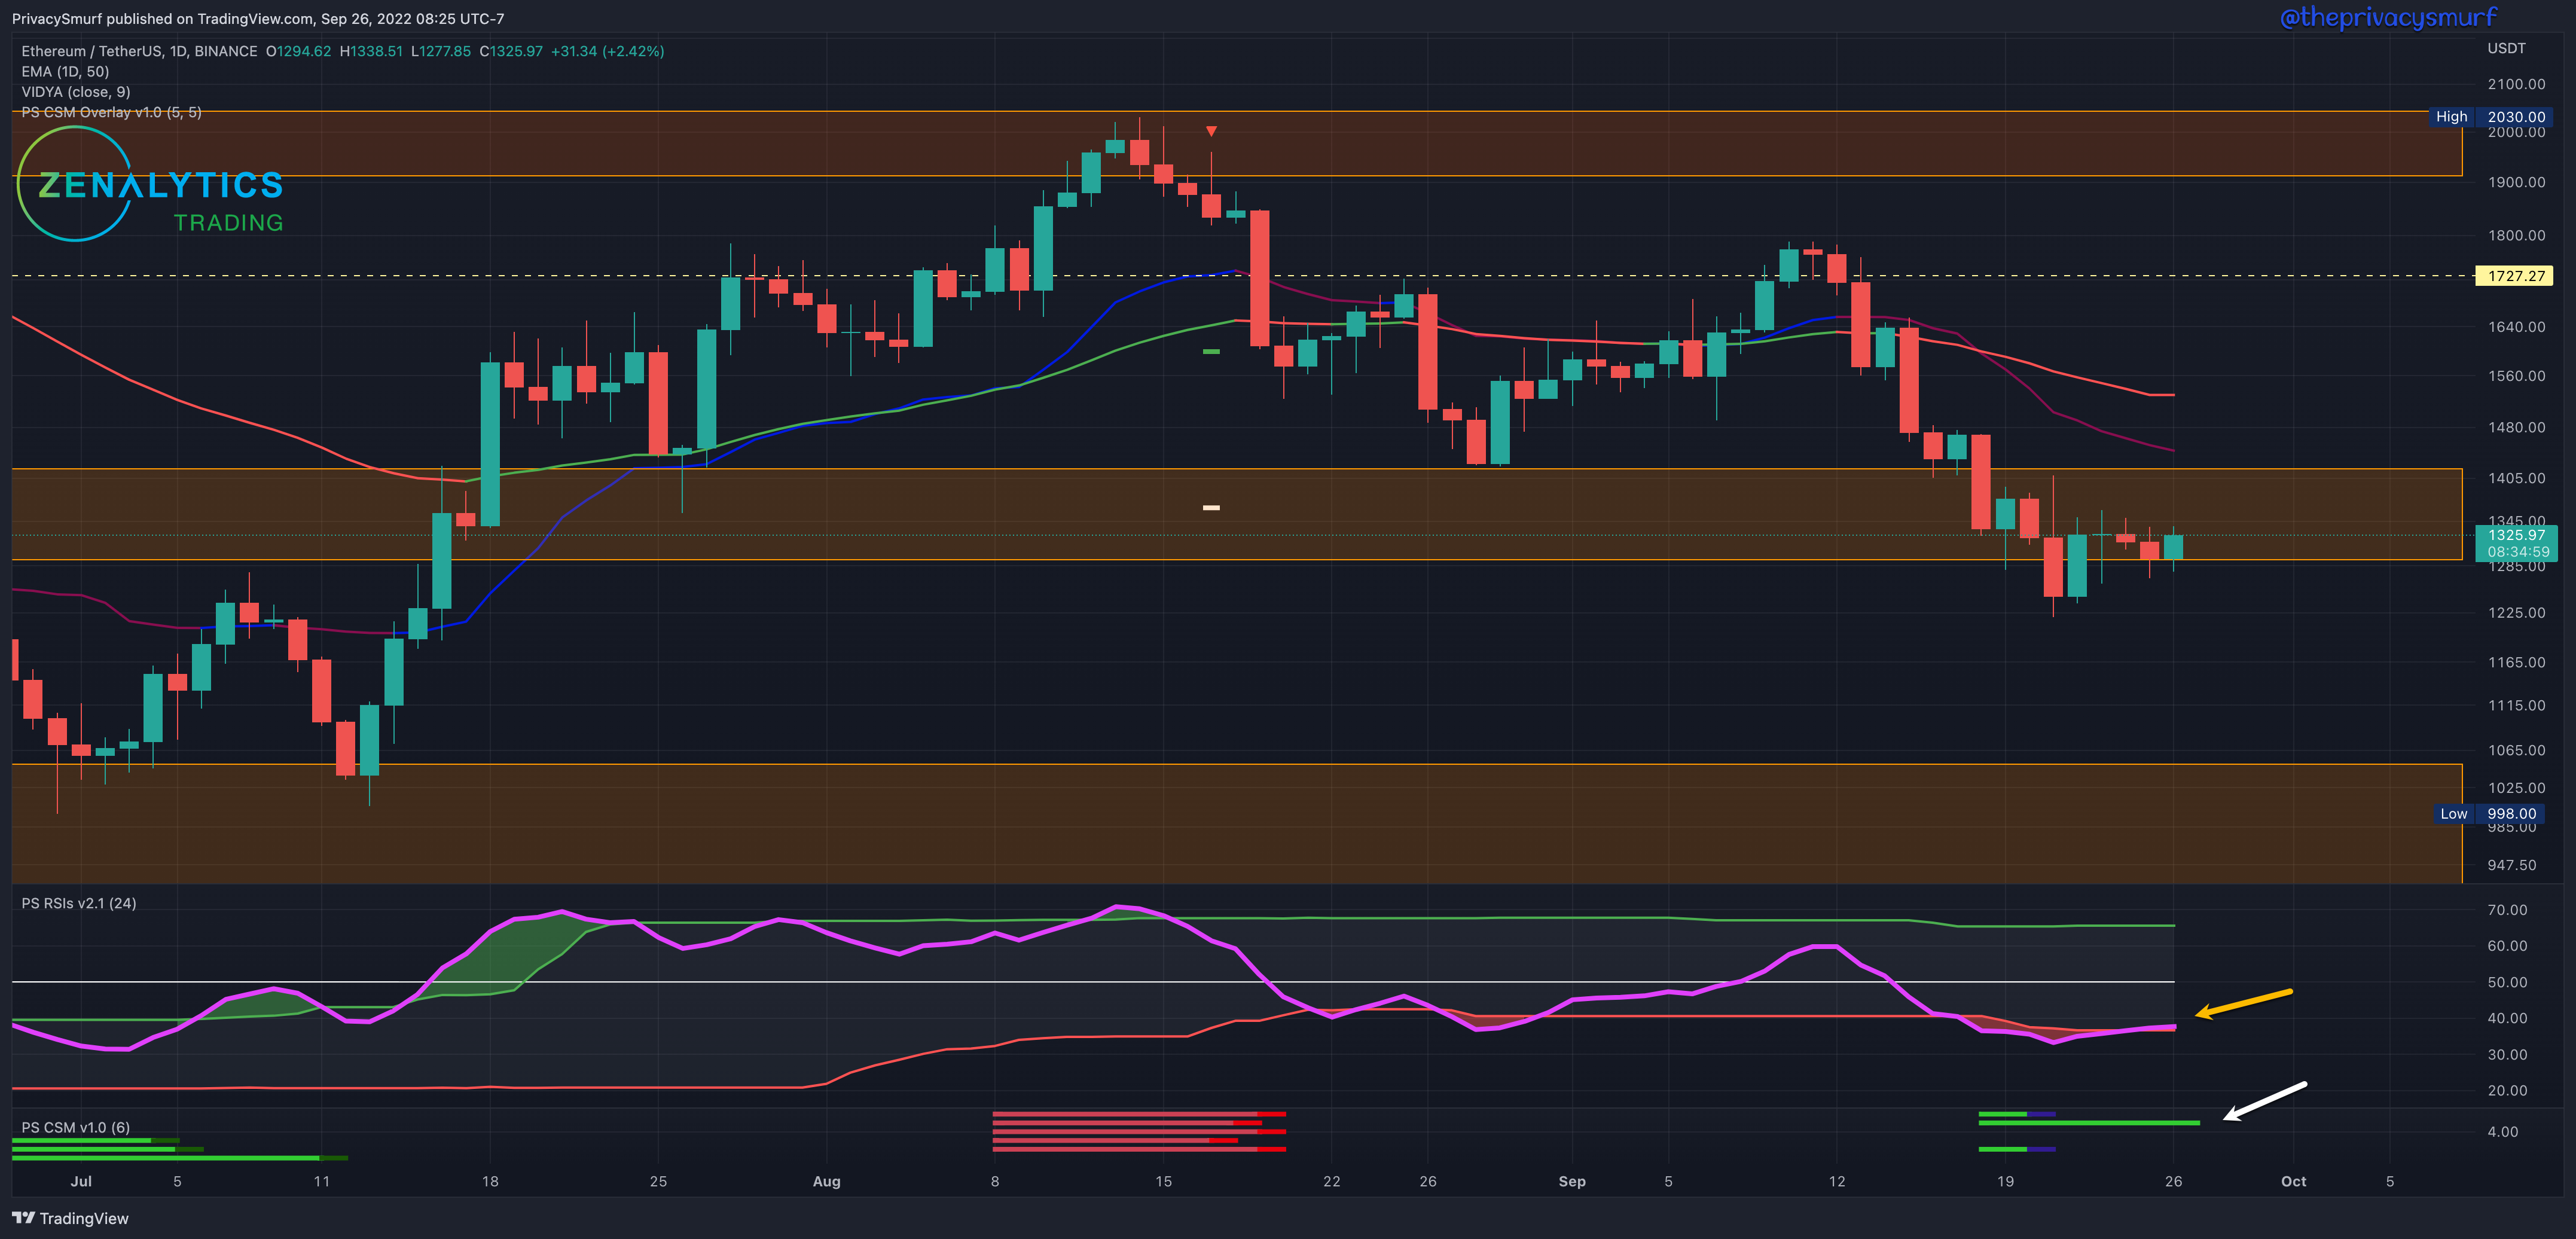
Daily Charts:
BTC/USDT

The downtrend over the past month is now reaching critical mass as we near the end of the wedging structure (red arrow and purple line segment). Volatility is on the horizon. The Correction Strength Indicator (white arrow) plotting green suggests the potential for a bullish reversal. The RSI (yellow arrow), while still under the midline, which suggests a bearish influence on price, shows a bullish divergence from price, and the adaptive top band is slightly lowering towards the midline. If this activity continues over the next few days and the RSI can break above the midline and the top band, this may lead to the bullish break out of the wedge. Given the technicals, I’m not anticipating much bullishness beyond $21k where the 50-Day EMA resides, but the CSM is plotting initial targets up to $21.8k. Note the trade signal on the 9th of September rallied right up to the initial targets in the following days before correcting back down.
ETH/BTC
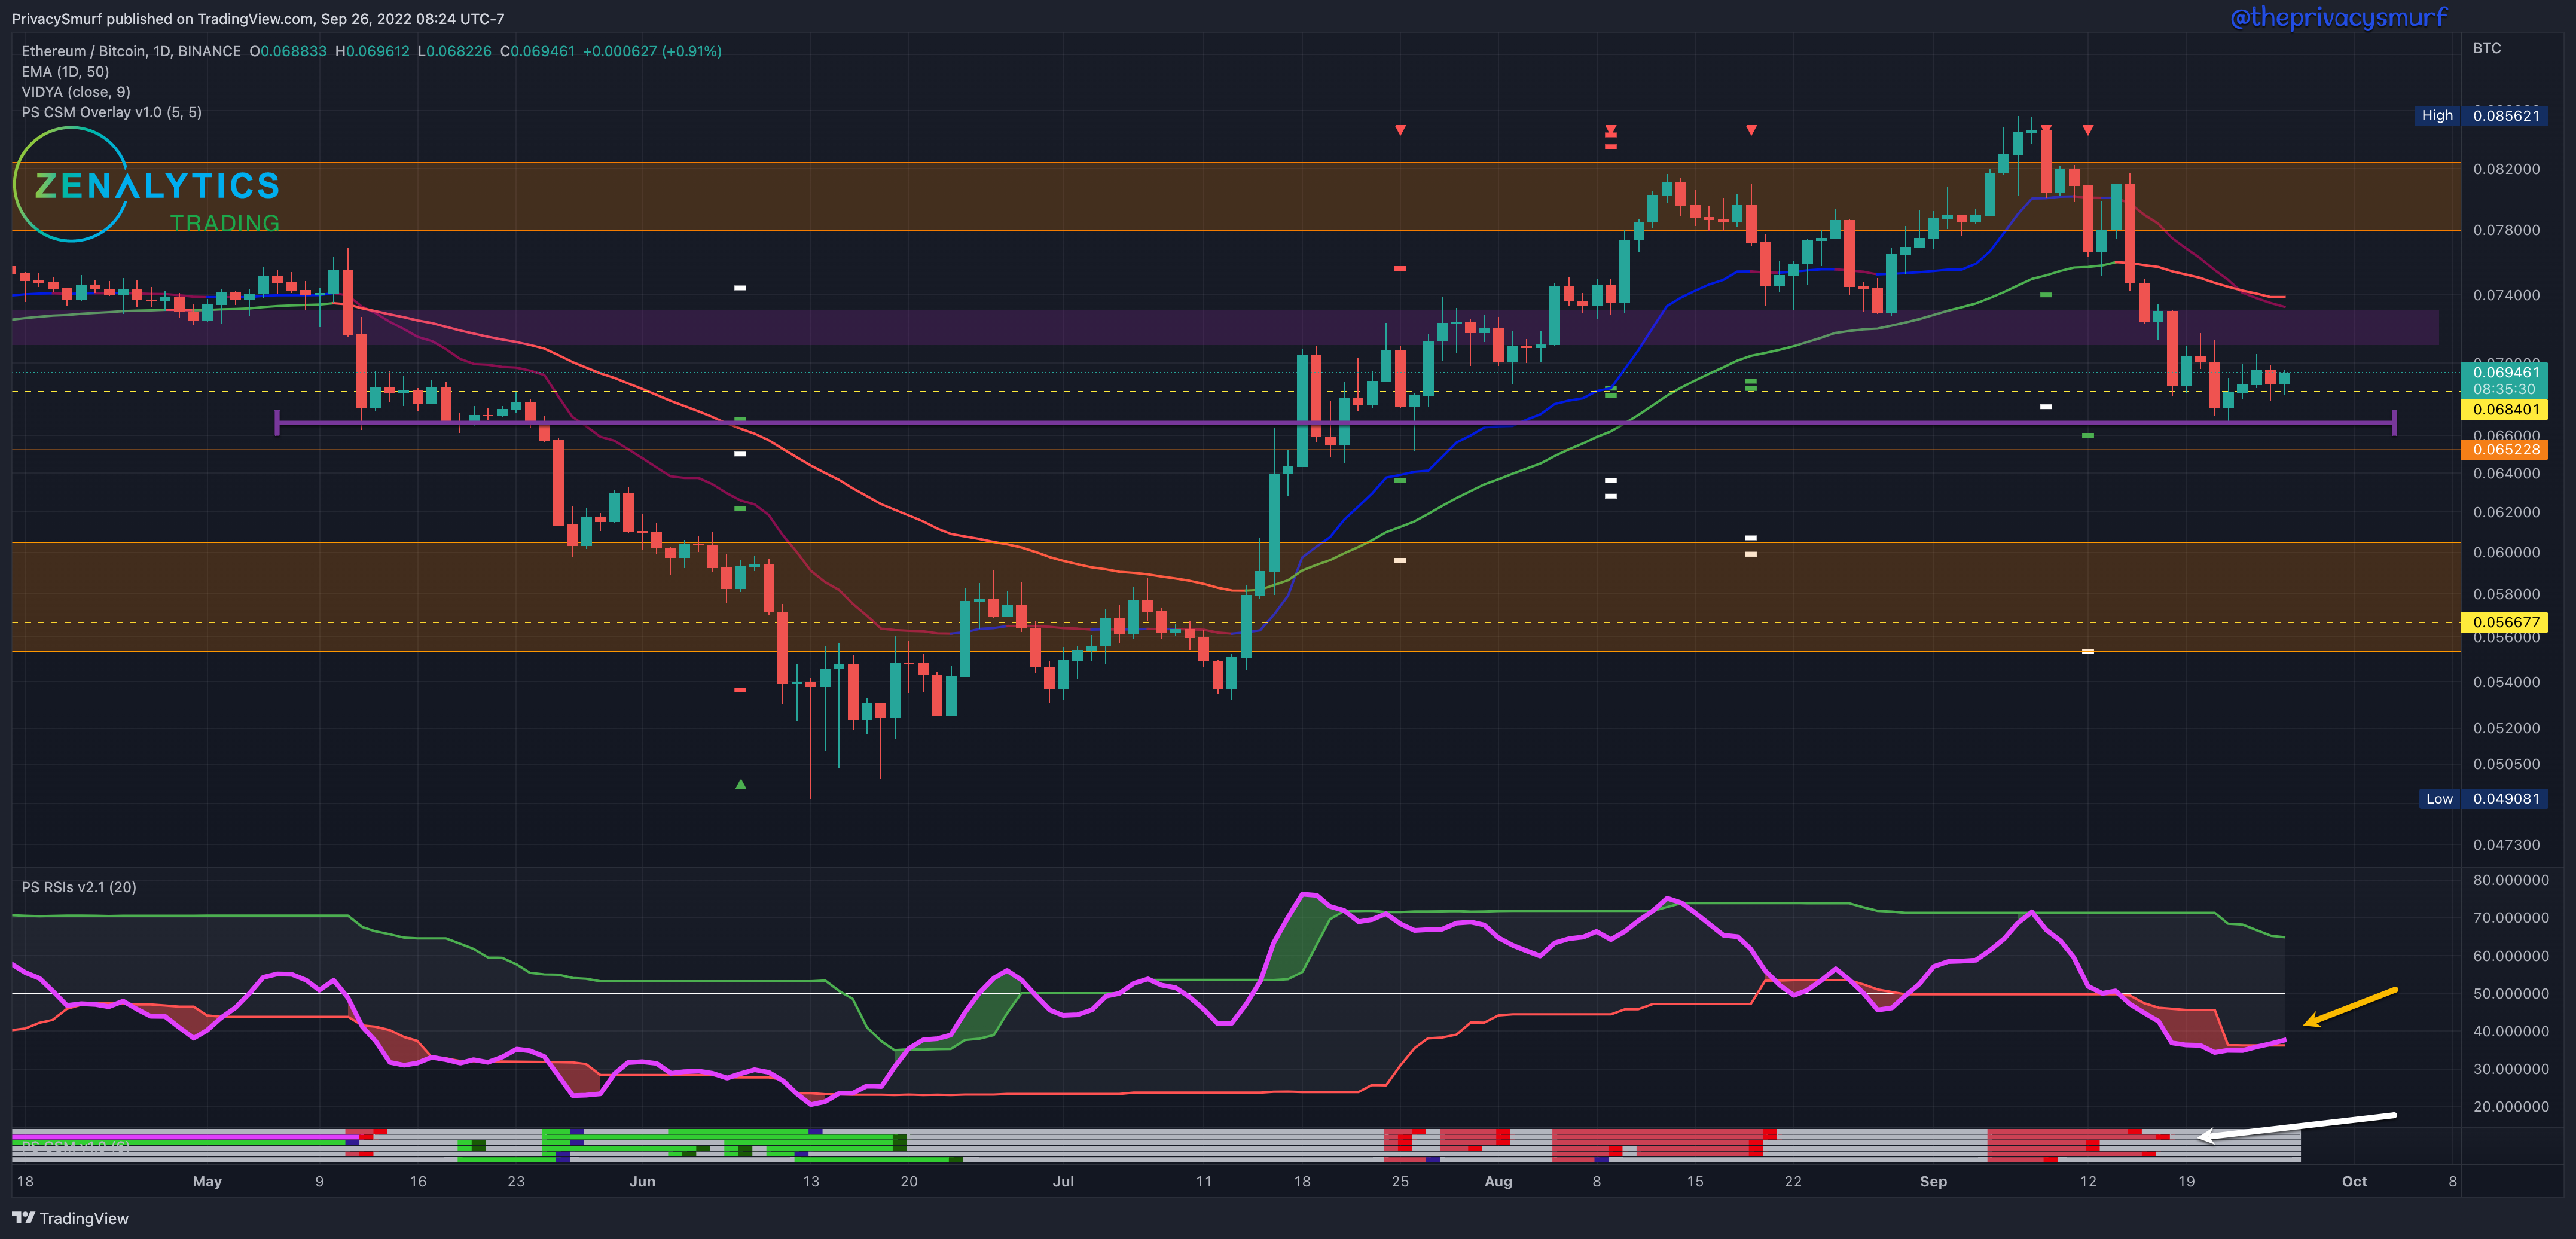
ETH relative to BTC is sitting at prior support (purple line segment). The bearish trades signaled by the Correction Strength Meter (white arrow) on the 9th have hit both targets. The RSI is in bearish territory under the midline but recently curled back over the bottom band. This would suggest that the bearish volatility has been exhausted for the time being. A further drop below, and I would anticipate testing the lower support and possibly breaking it down to test levels around 0.062. There’s no indications of a bottoming yet on this timeframe to trigger an entry for the weekly cycle forecasted bottom.
ETH/USD
The daily chart of ETH slightly agrees with the notion of ETH not being ready to gain on BTC. The Correction Strength Meter shows only 3 price action oscillators were showing the potential for correction, and two have since been invalidated, suggesting bearish continuation. The RSI (yellow arrow) has moved back up over the bottom band, suggesting the bearish volatility is exhausted. Another decline below the band, and I’d expect ETH to test the lower support zone again, starting at $1060. Any bullish price action, I’d expect resistance around $1560 at the 50-Day EMA.
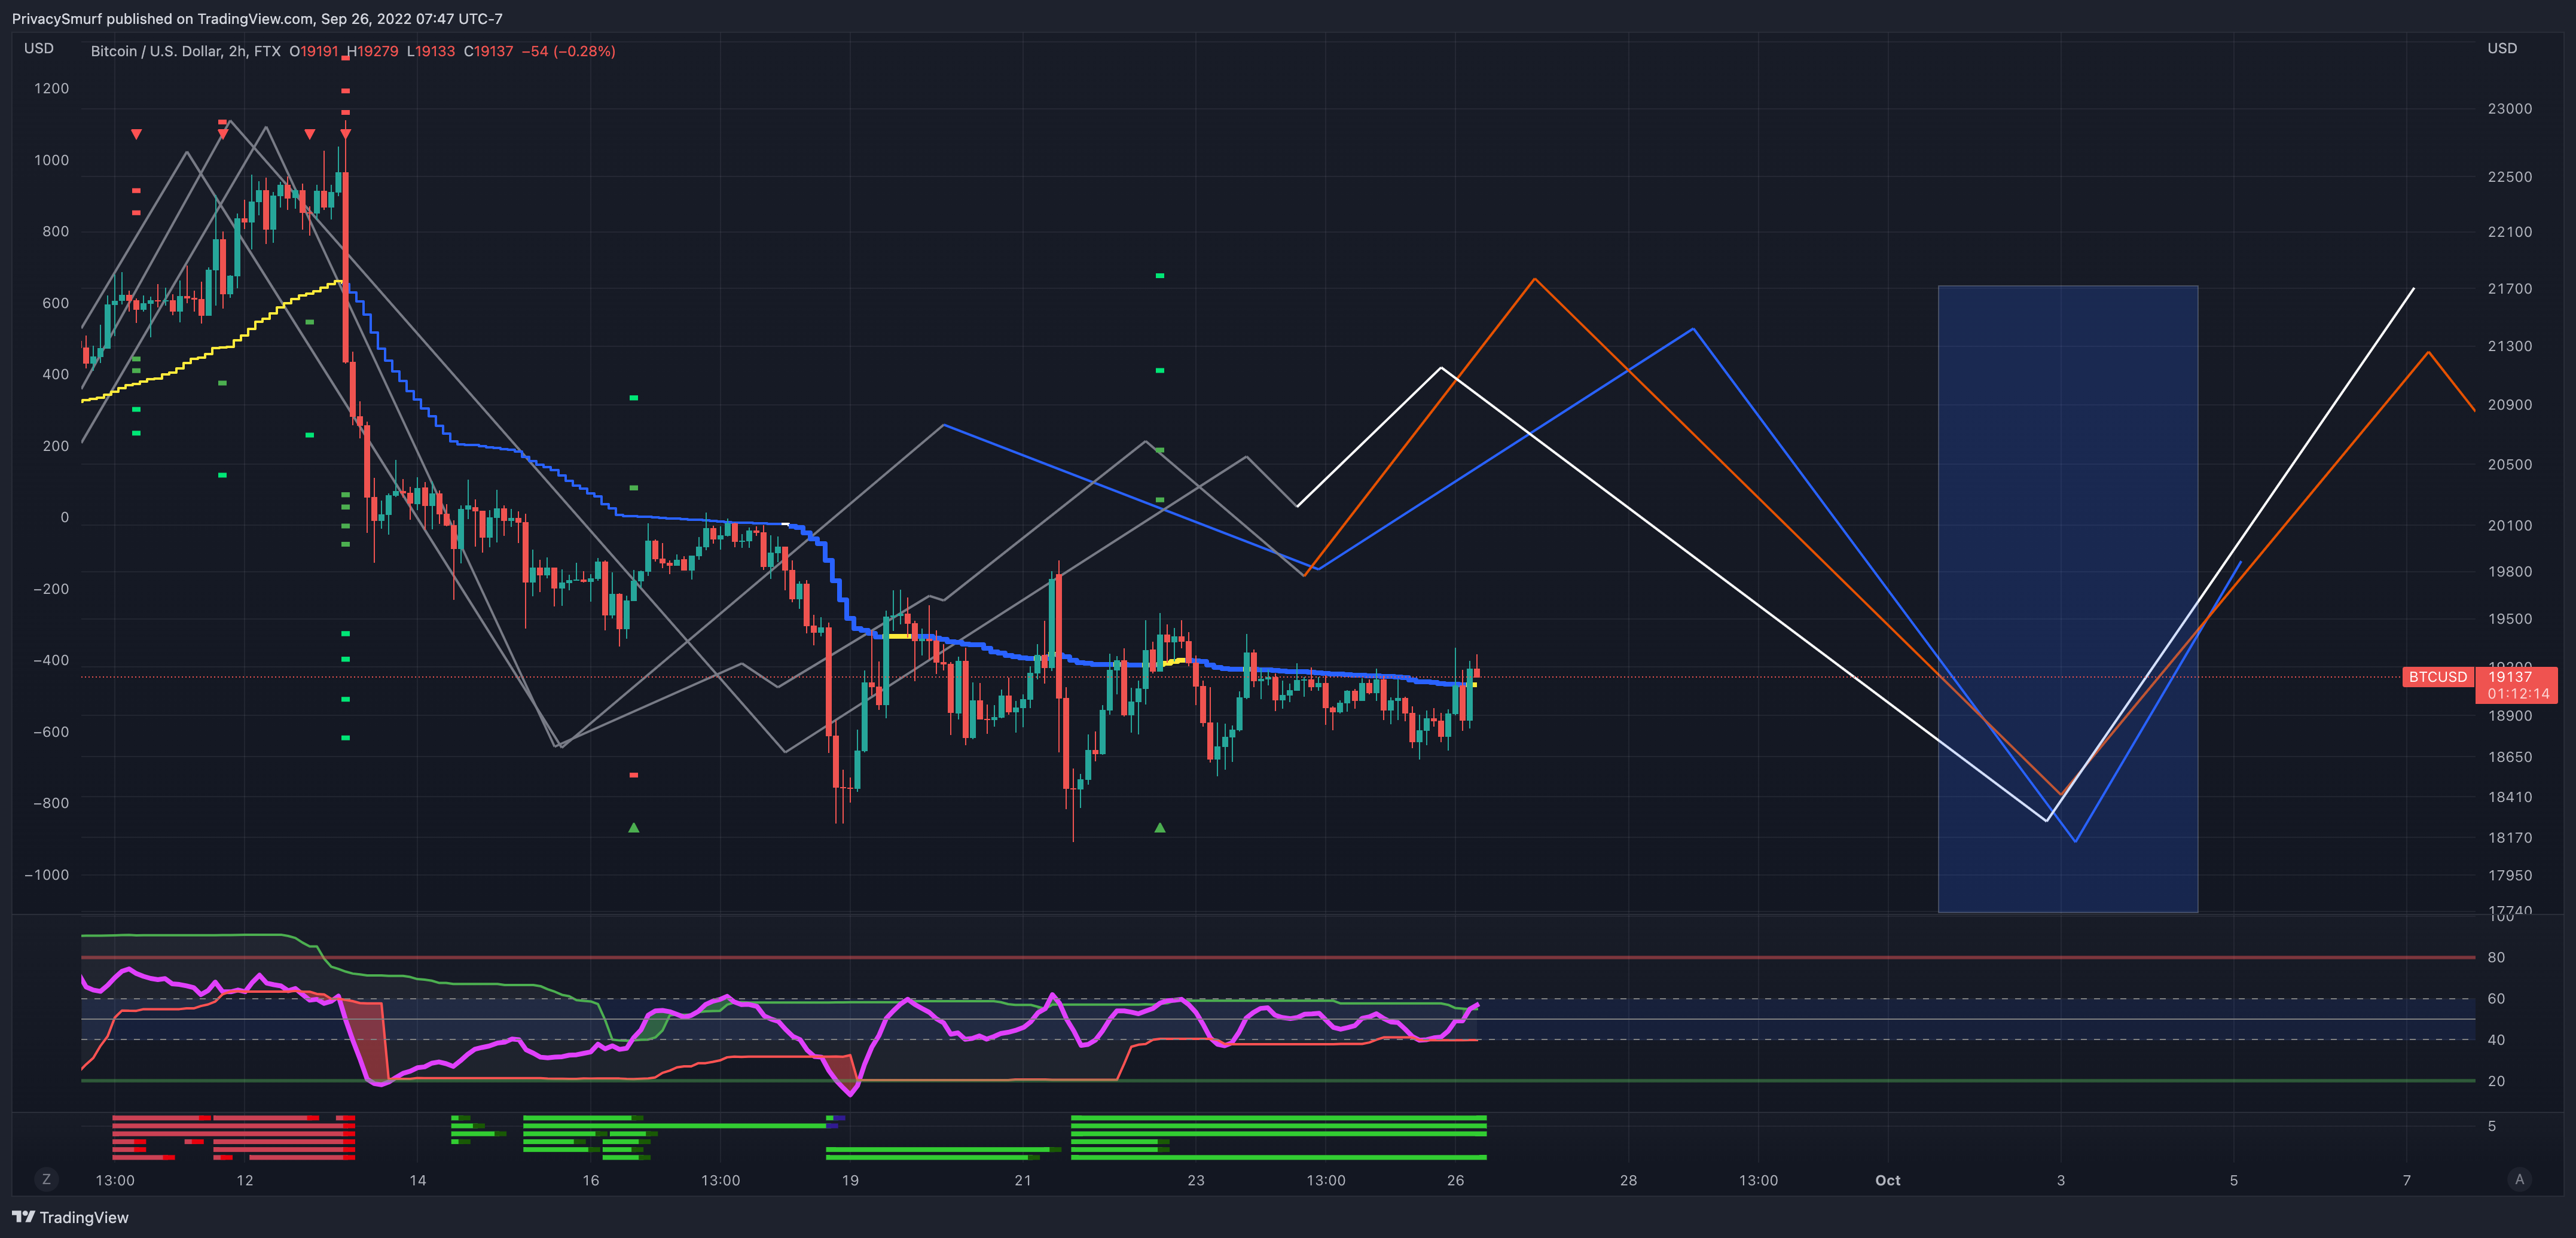
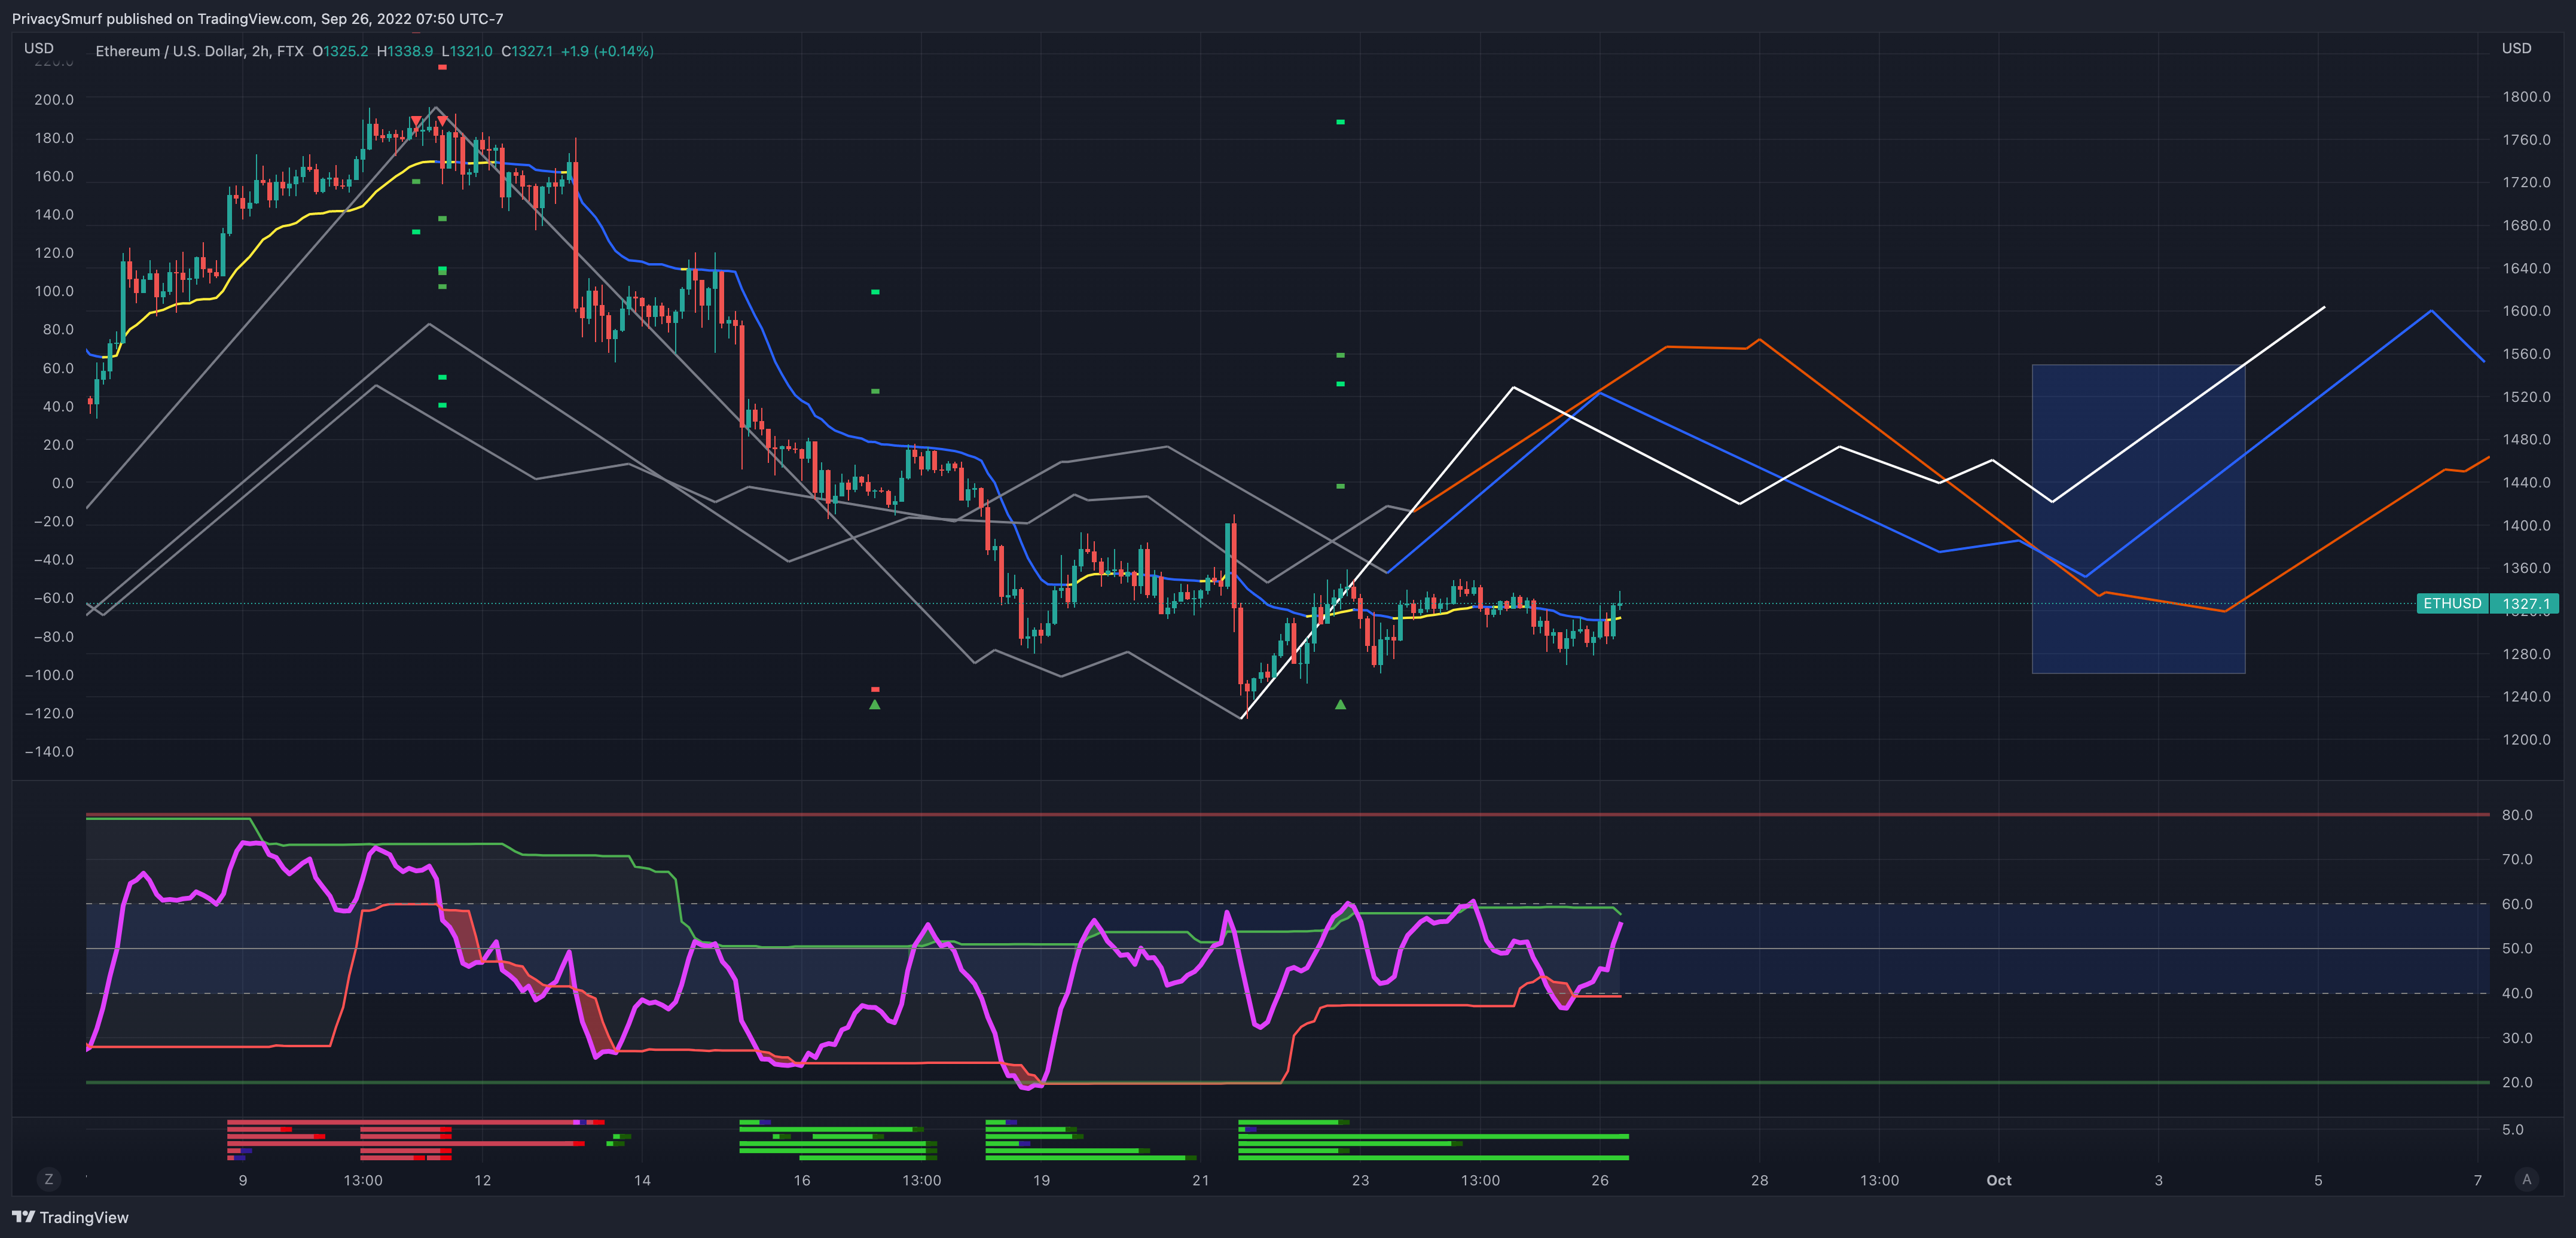
Intraday Cyclical Alignment:
There is reason to suspect bullish price action in early October. Models of intraday price action show a period of bullish alignment. There’s more in than ETHB, which is also further validation of the ETH/BTC chart analysis suggesting BTC has more potential near term than ETH. Here are the photos of both intraday charts with the region of time to look for bullish trade signals.
BTC/USDT 2HR
ETHUSDT 2HR
Trading Range Tuesday Updates:
Here are the latest photos of the intraday trading ranges. Chart links are still valid in the latest post.

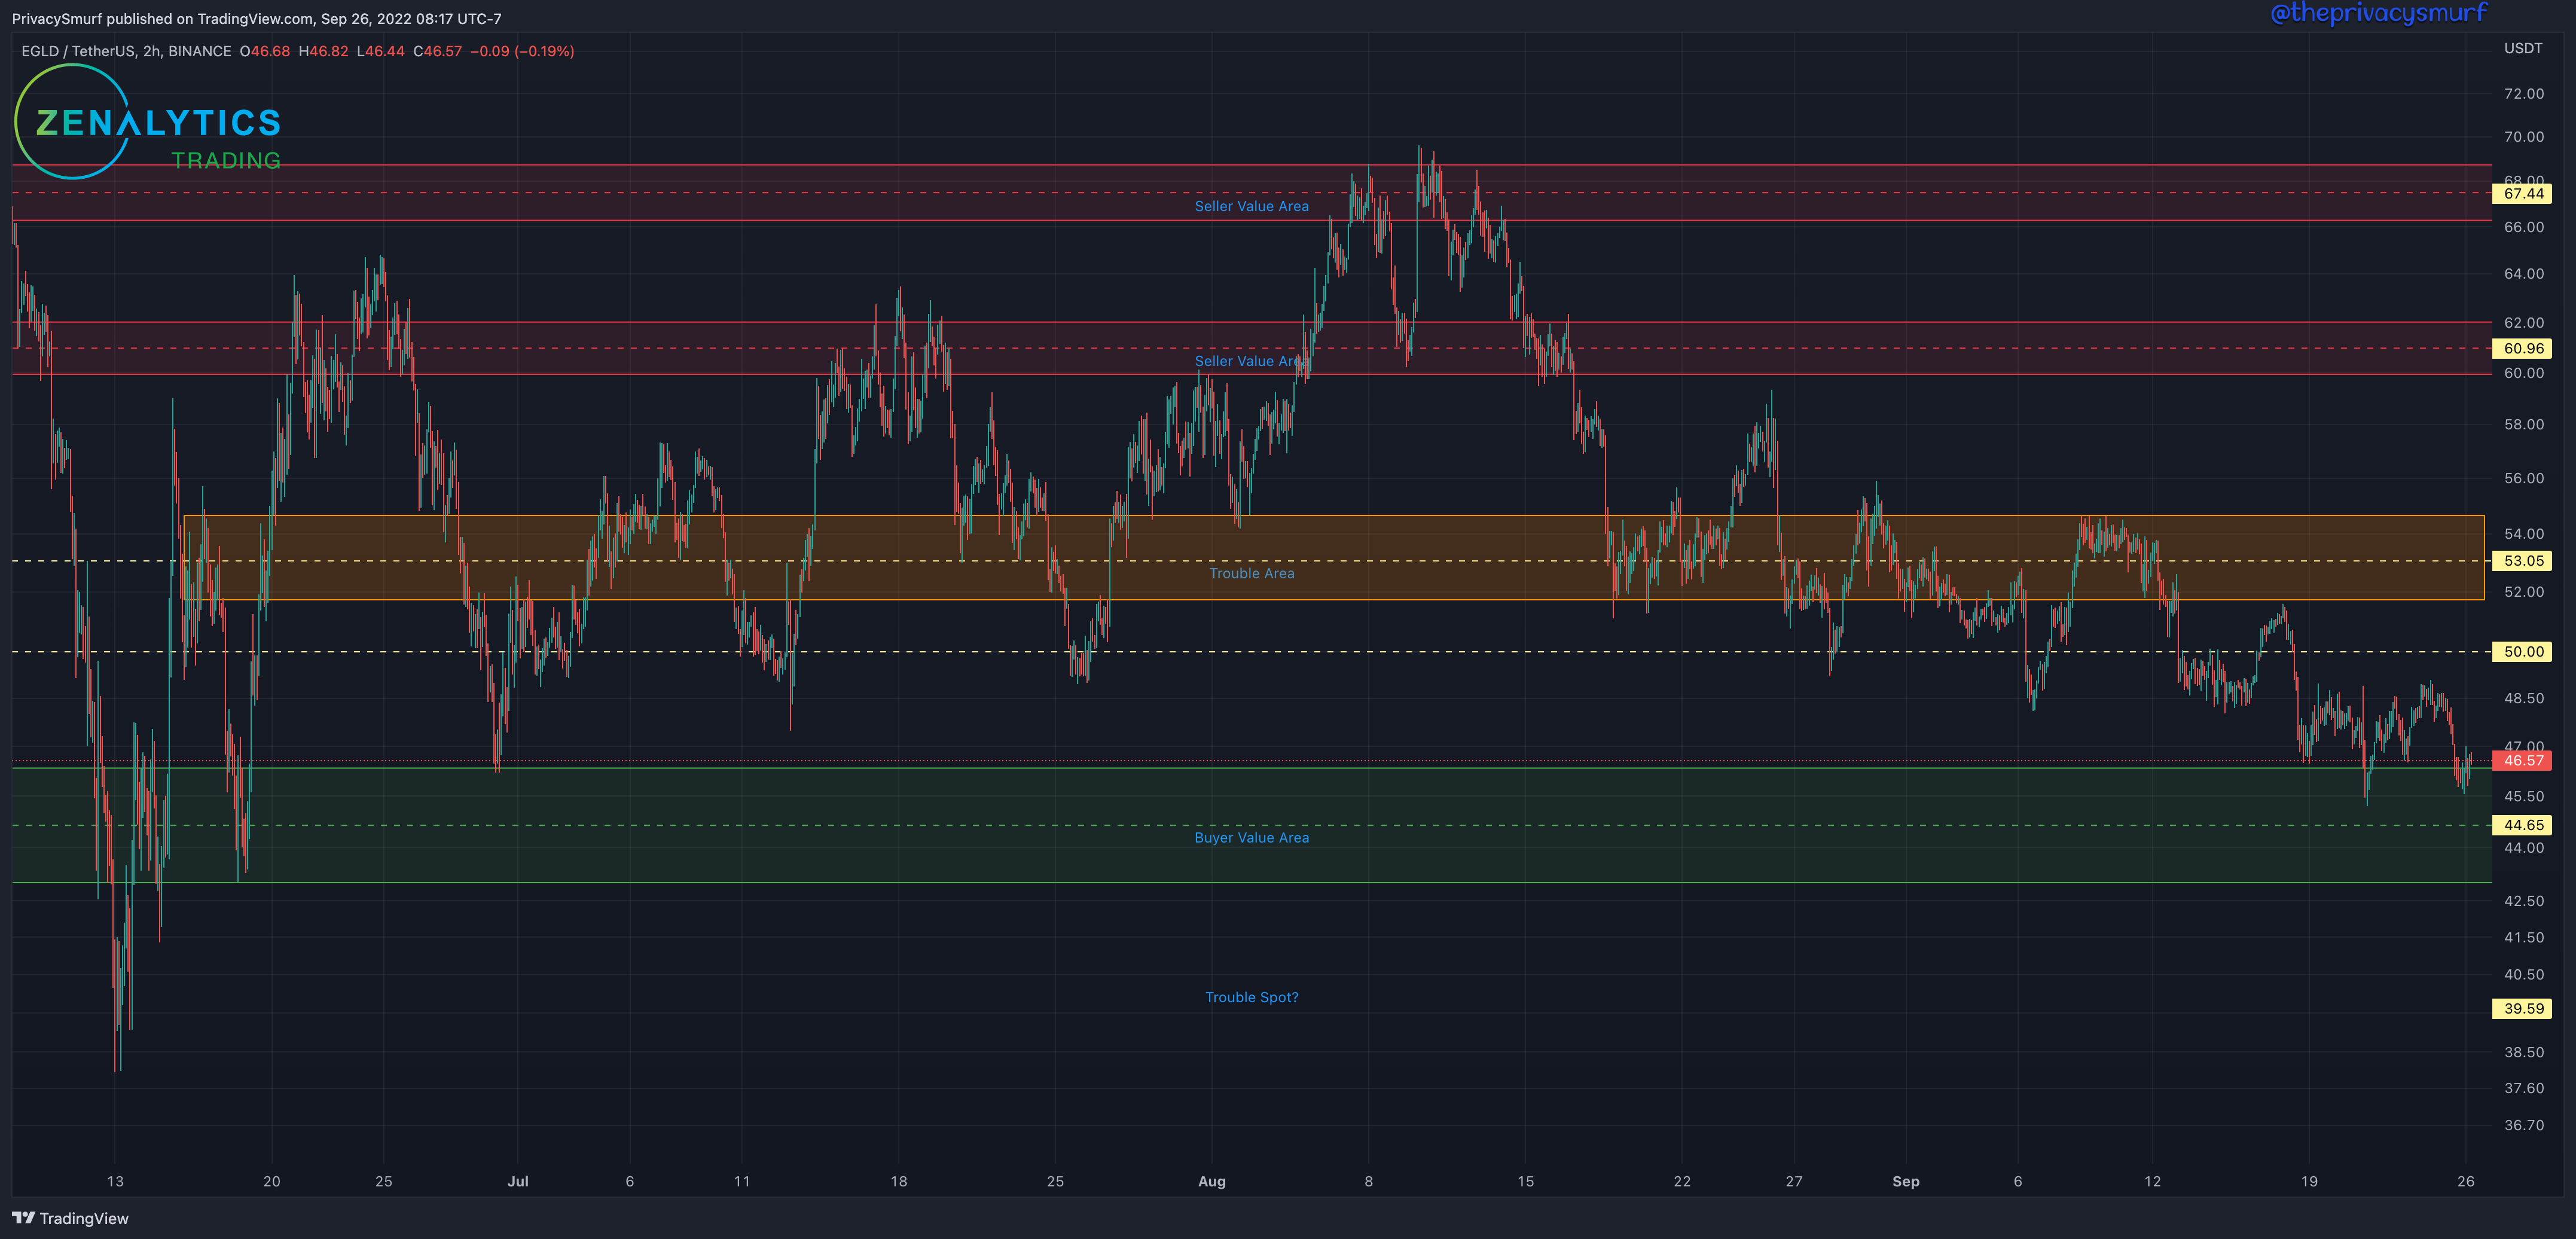
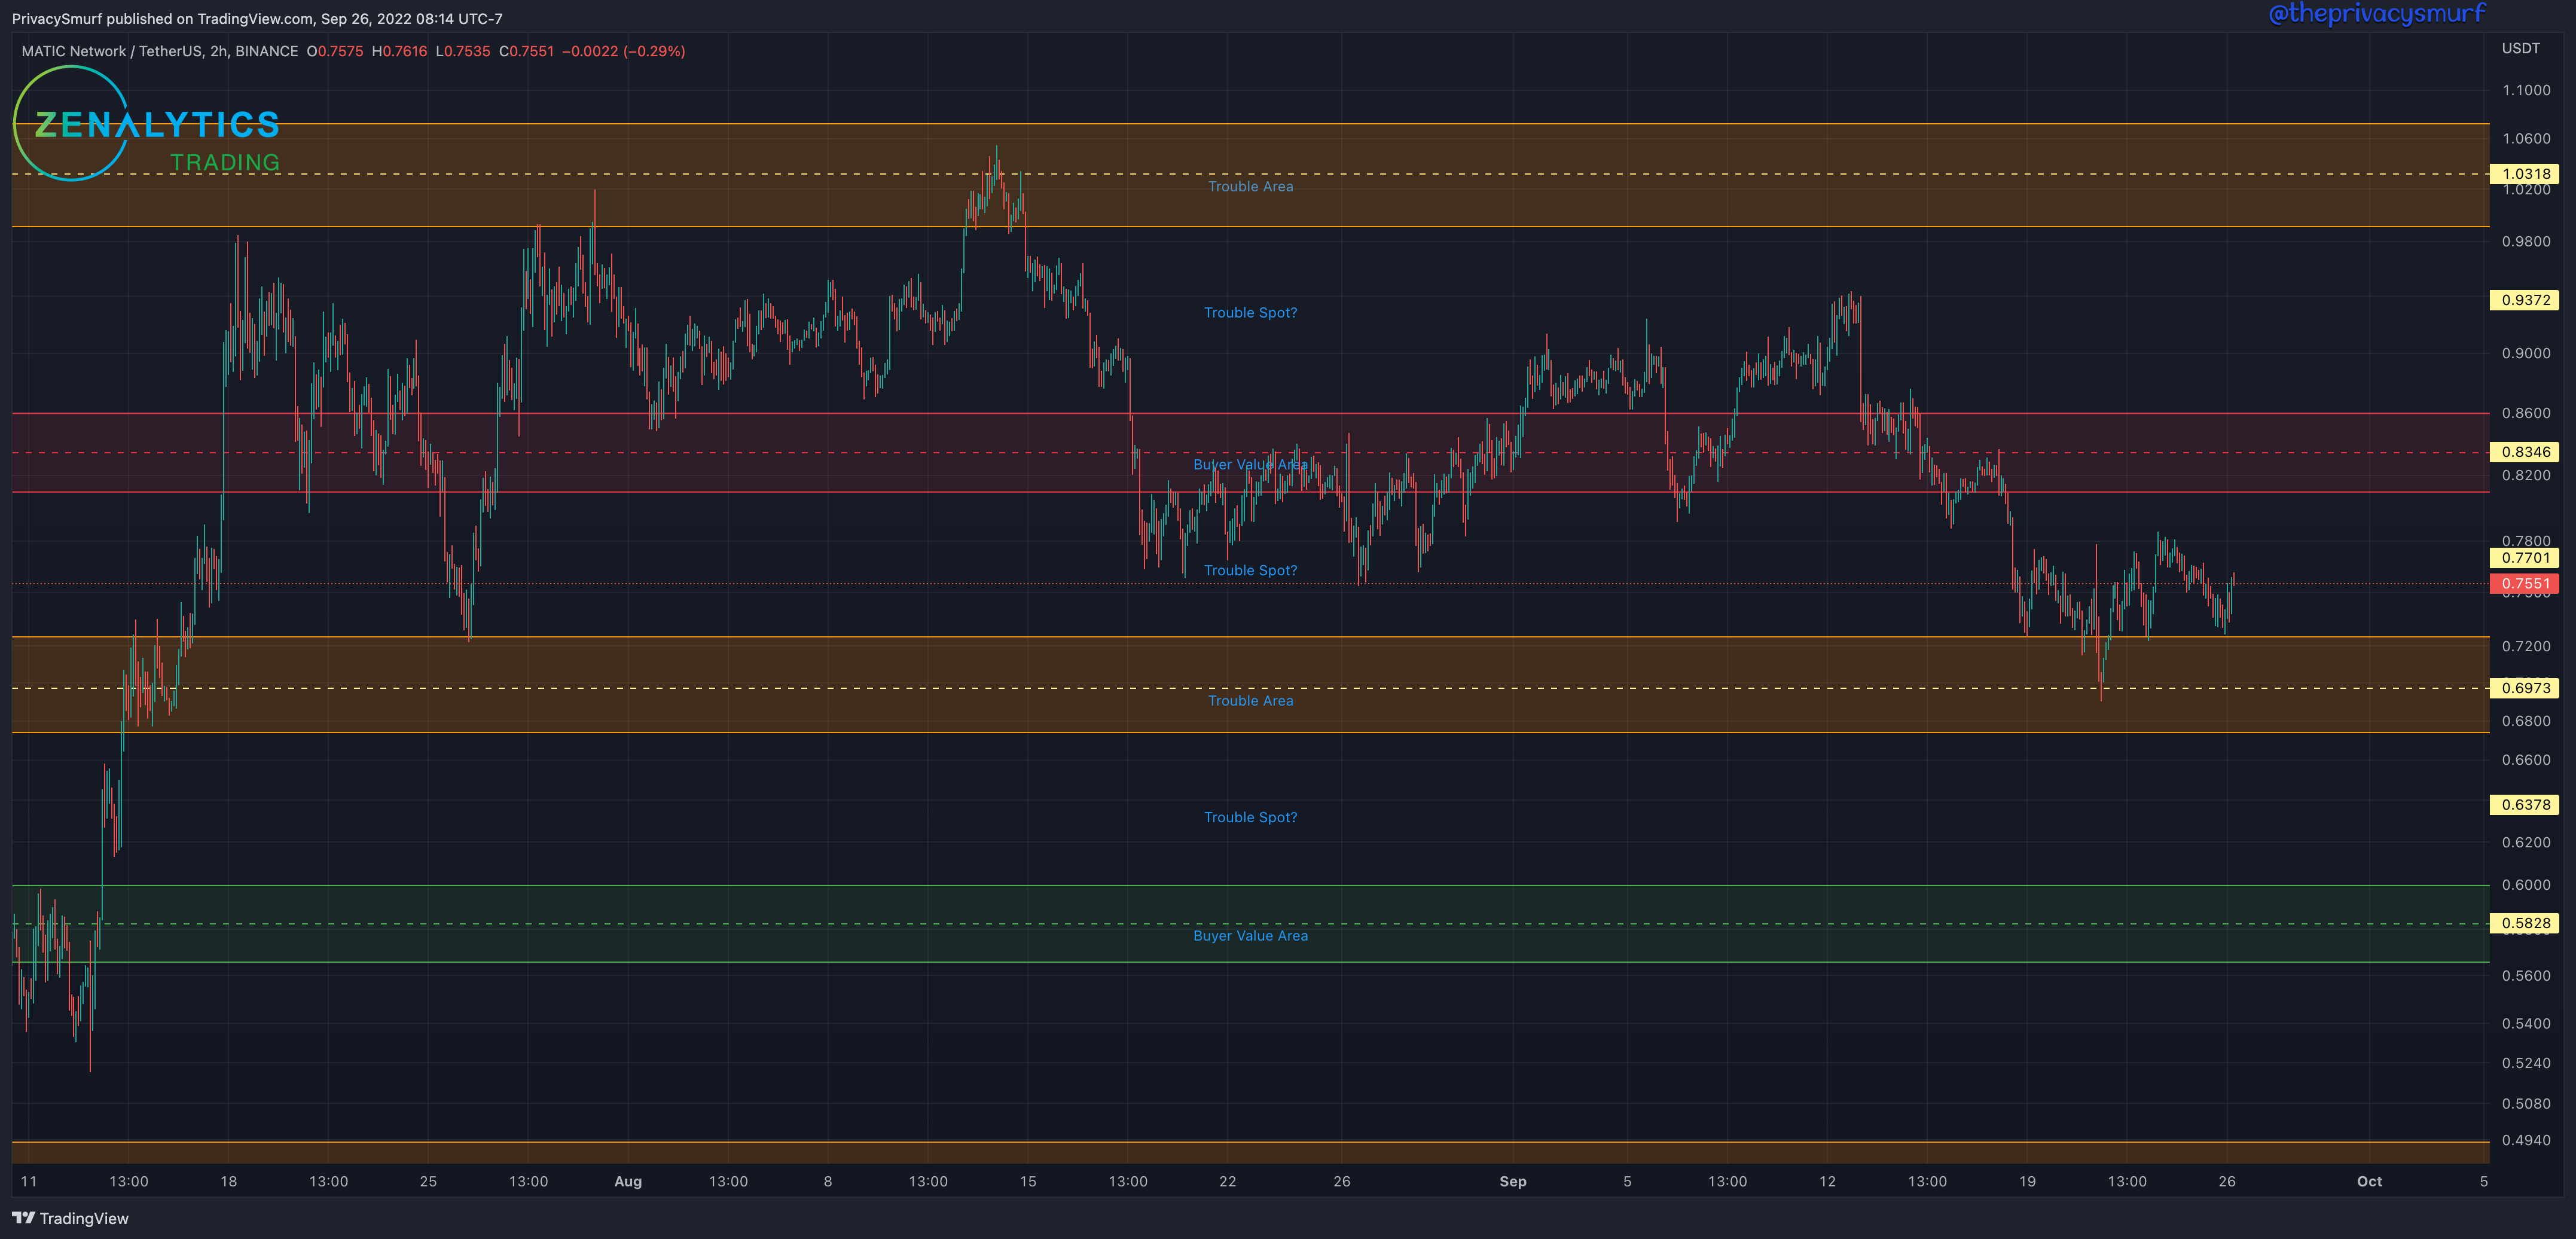
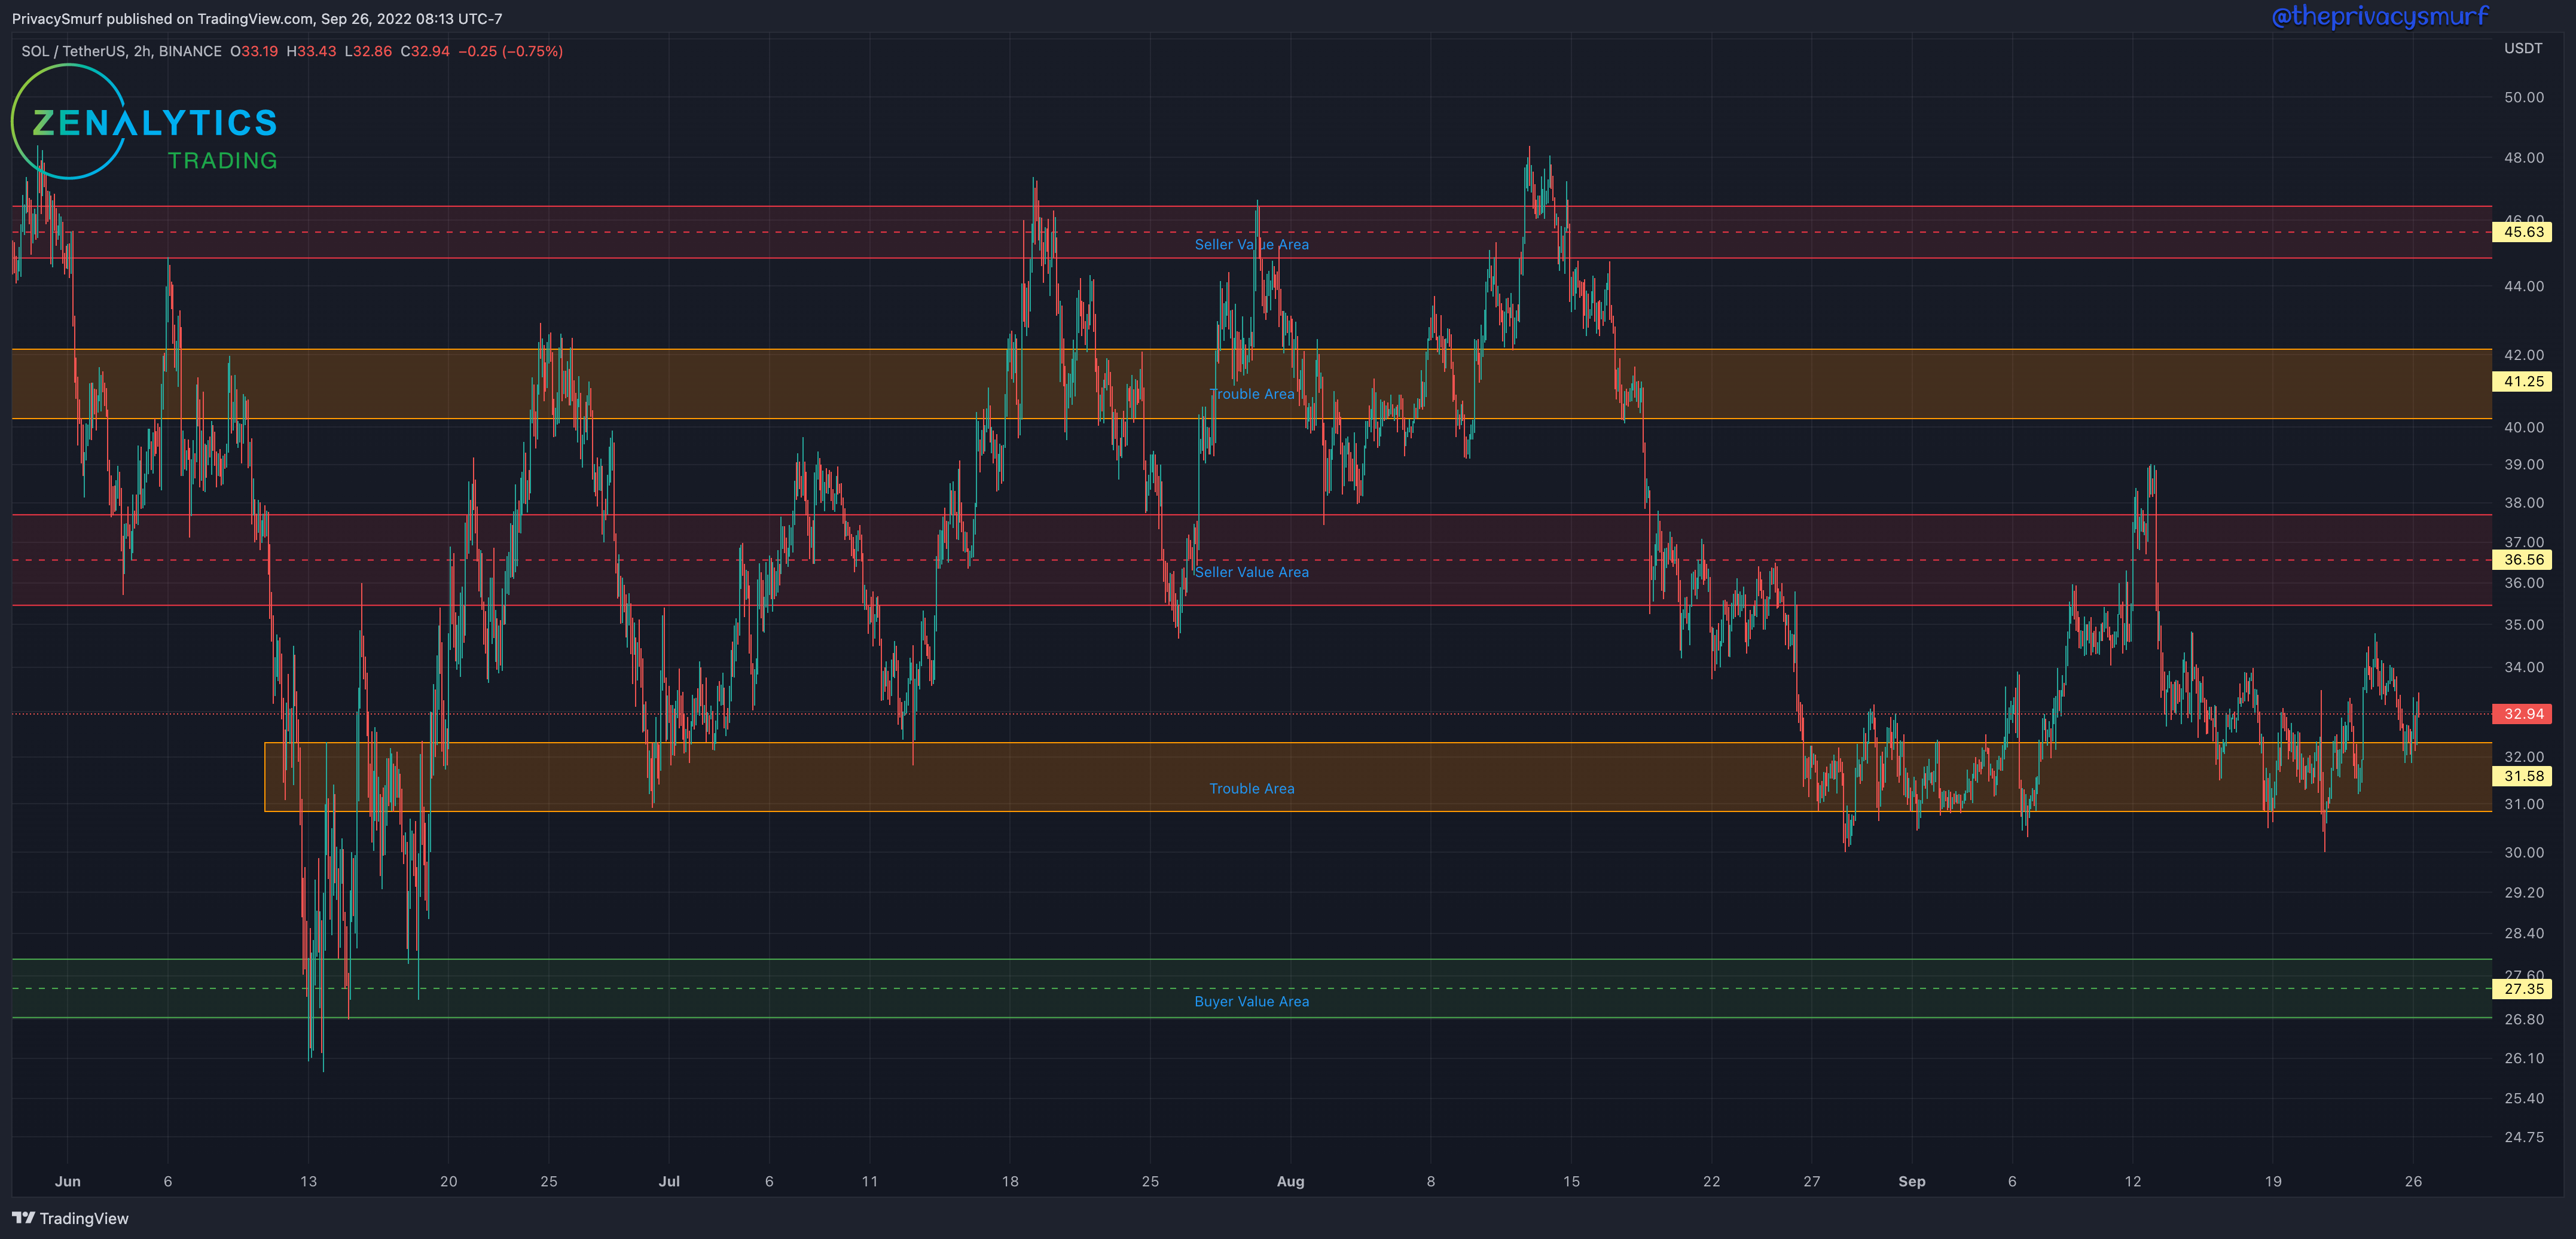
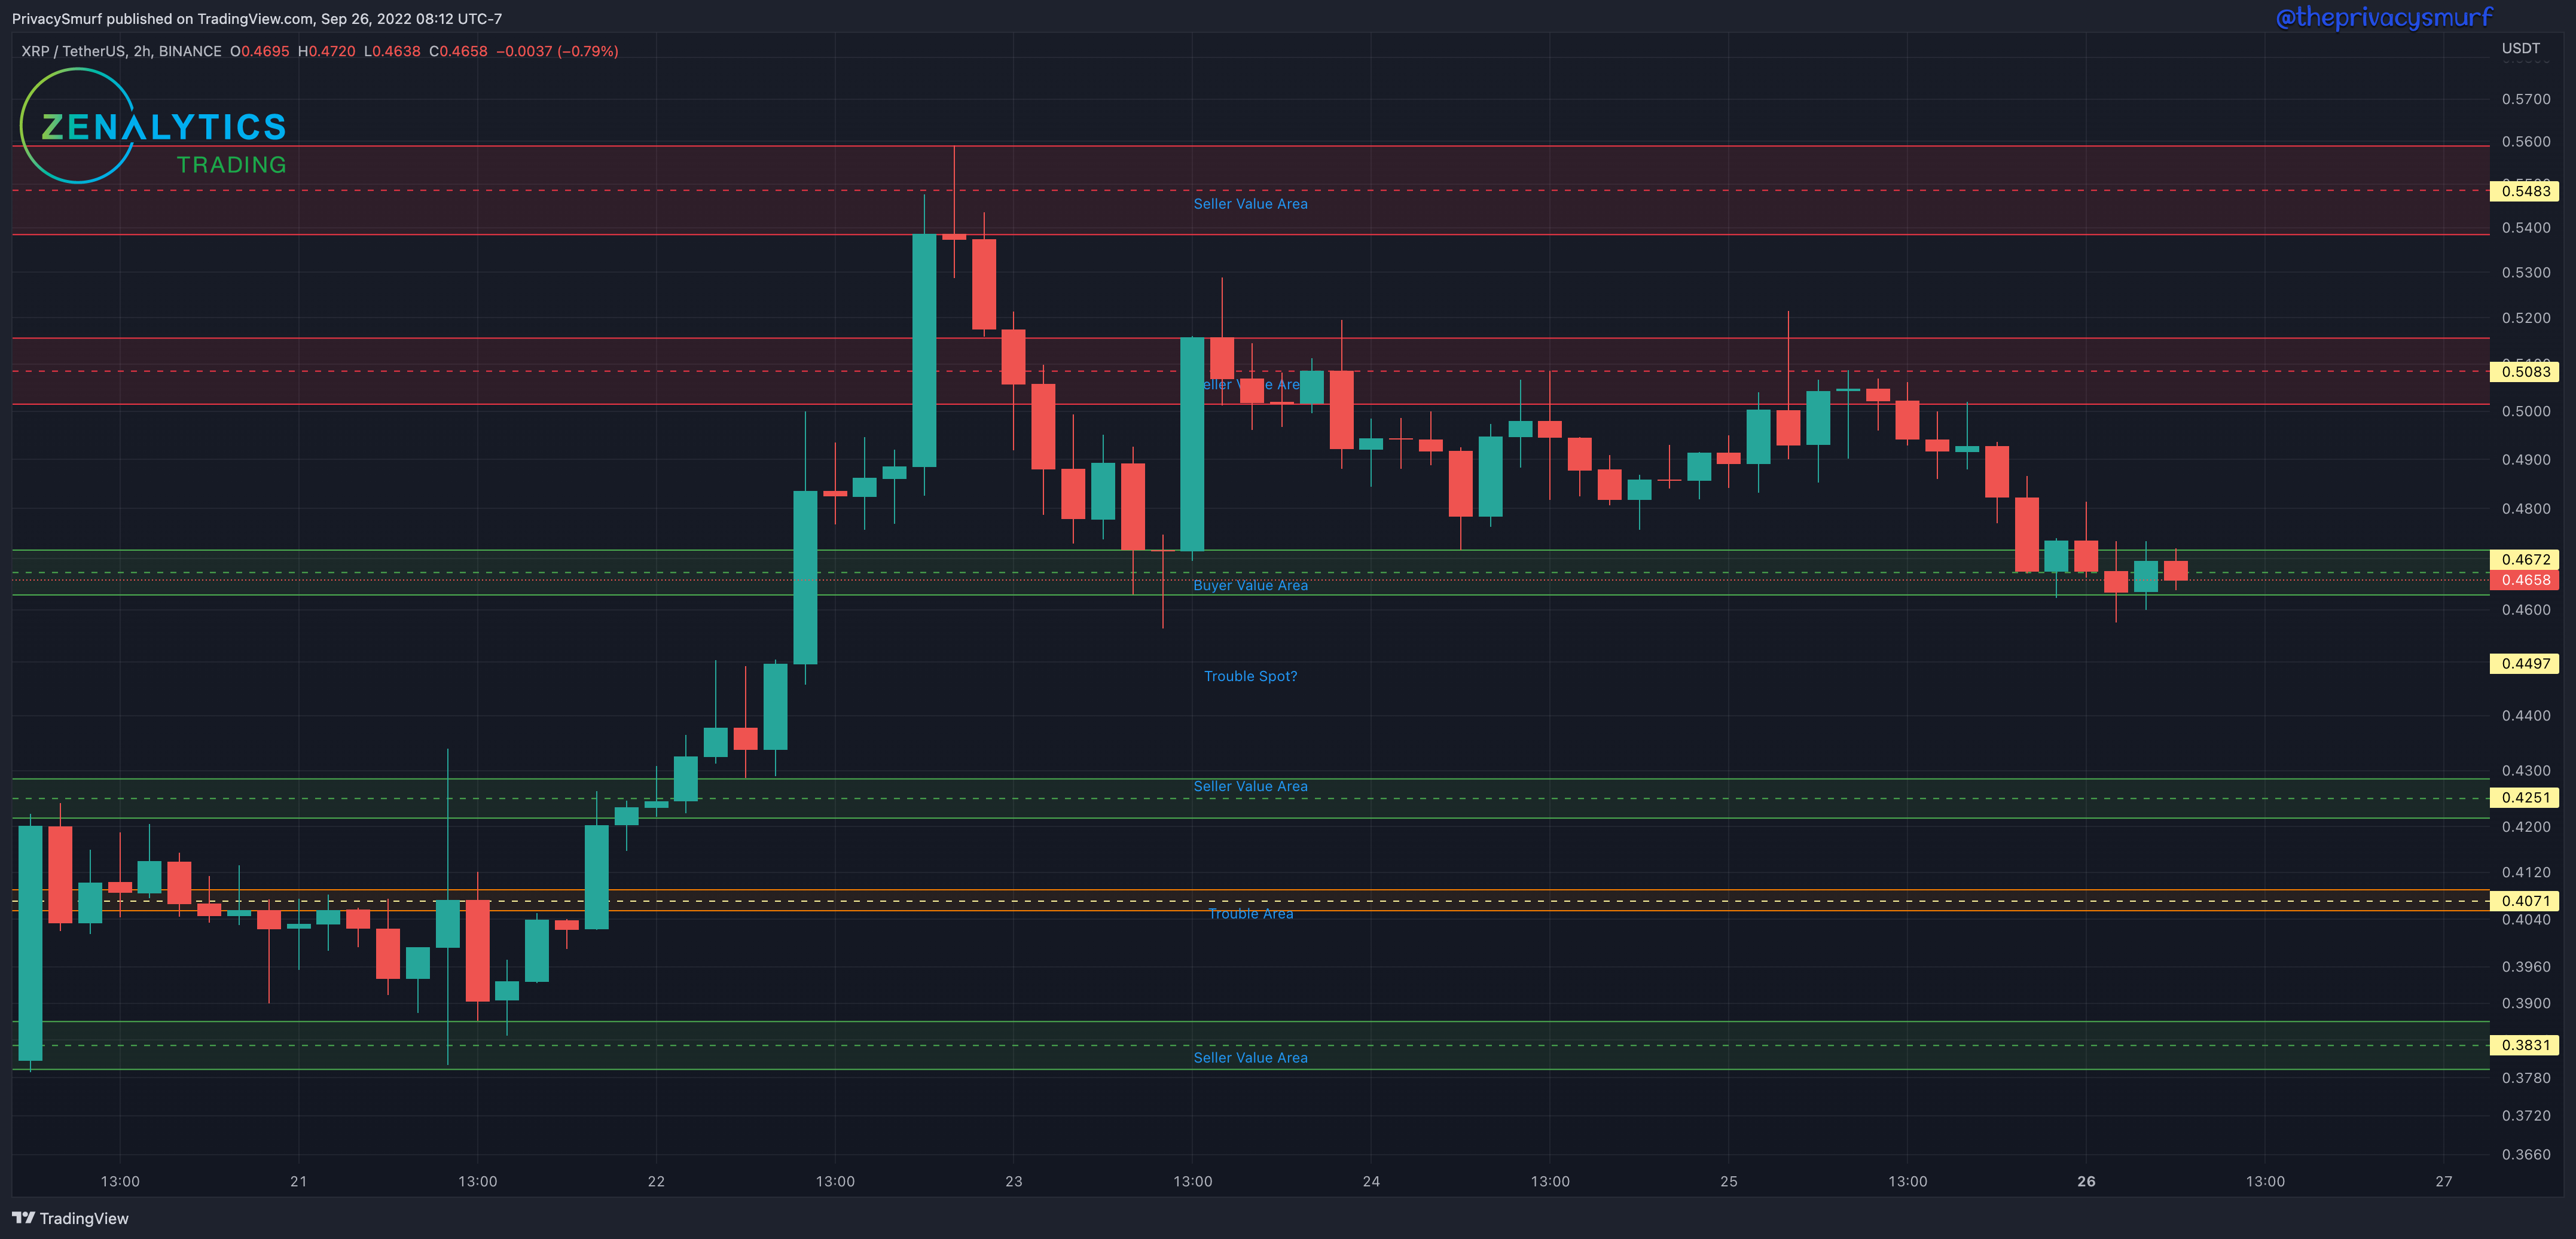
We’ll add in a new altcoin on my return next month.
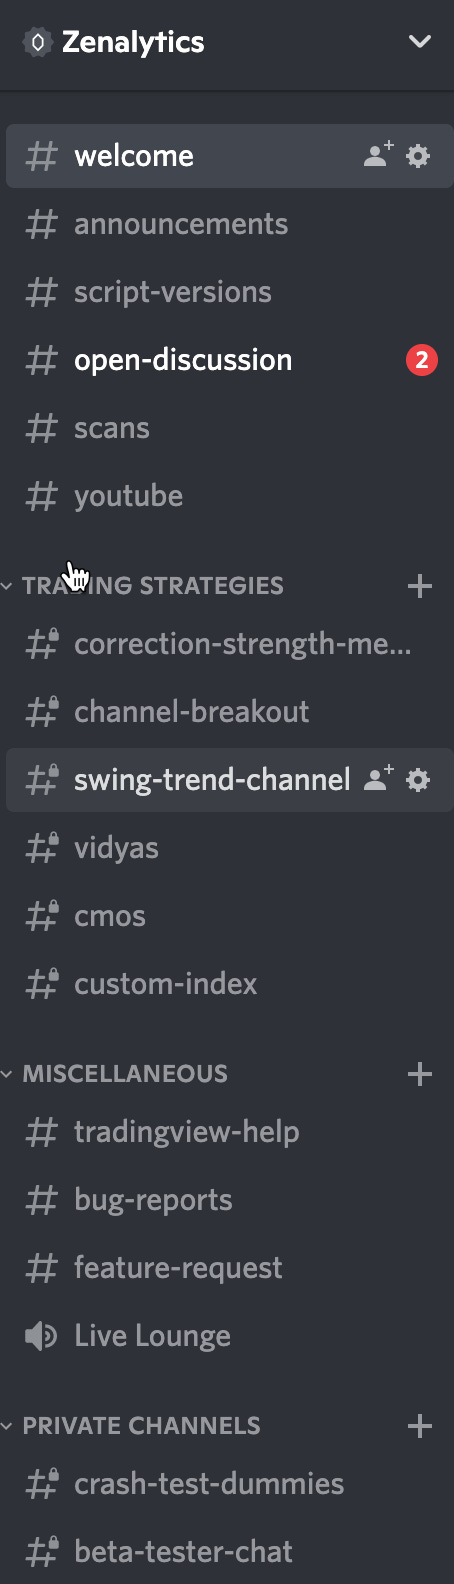
Discord:
On the launch of the educational site, I’ll also be opening up a public side of my discord. The discord is primarily restricted to the buyers of my indicators. Still, I’ll open up a few public channels so anyone can hop in and chat with me and others to become more familiar with my work.
Here’s a quick sneak peek at the discord and my current (mostly private) scripts.
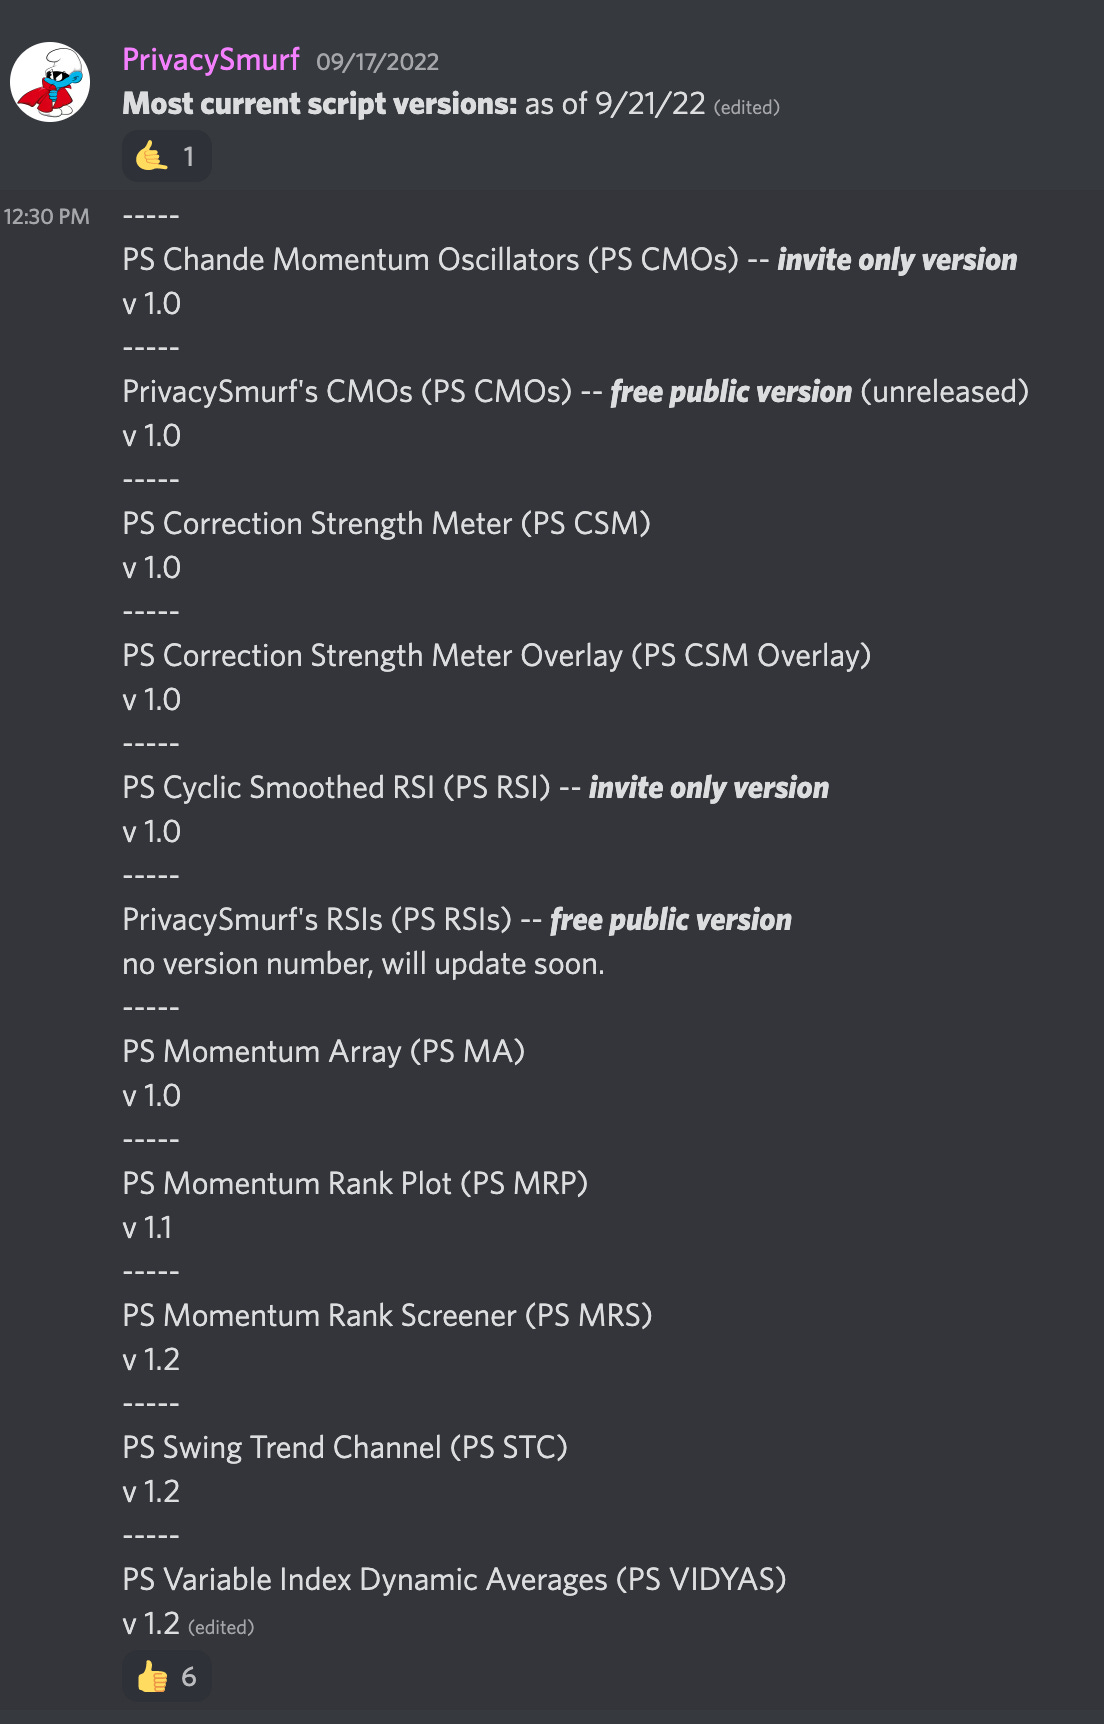
I’m super proud of the Momentum Array and Momentum Rank Plot. Those new additions show great value in selecting the assets to trade.
Thanks again for your patience and I’ll see you in two weeks. The following week will include the Q4 Forecast, the public side of the discord, the trading education site, and more newsletters. Take care and trade well.
@theprivacysmurf
PS. If you see a smurf hiking through a national park in Utah, it’s me; say hi. I’m nice.
Thanks and have a safe trip!
And remember, big, furry, bad breath, and big teeth equals bear! Don’t get caught!!!
Safe travels Terry !
Do you have a customer service
email address or phone number?
Have an issue( that isn’t your fault)
that I need to correct with billing.
Thanks for all you do and look forward to your return!