

Saturday Showcase #3: BAIT
Saturday Showcase #3: BAIT
The finer the bait the shorter the wait.


Here we are with some more TA on another batch of altcoins selected by you. Each alt is evaluated on the BTC chart since the goal is stacking those sats.
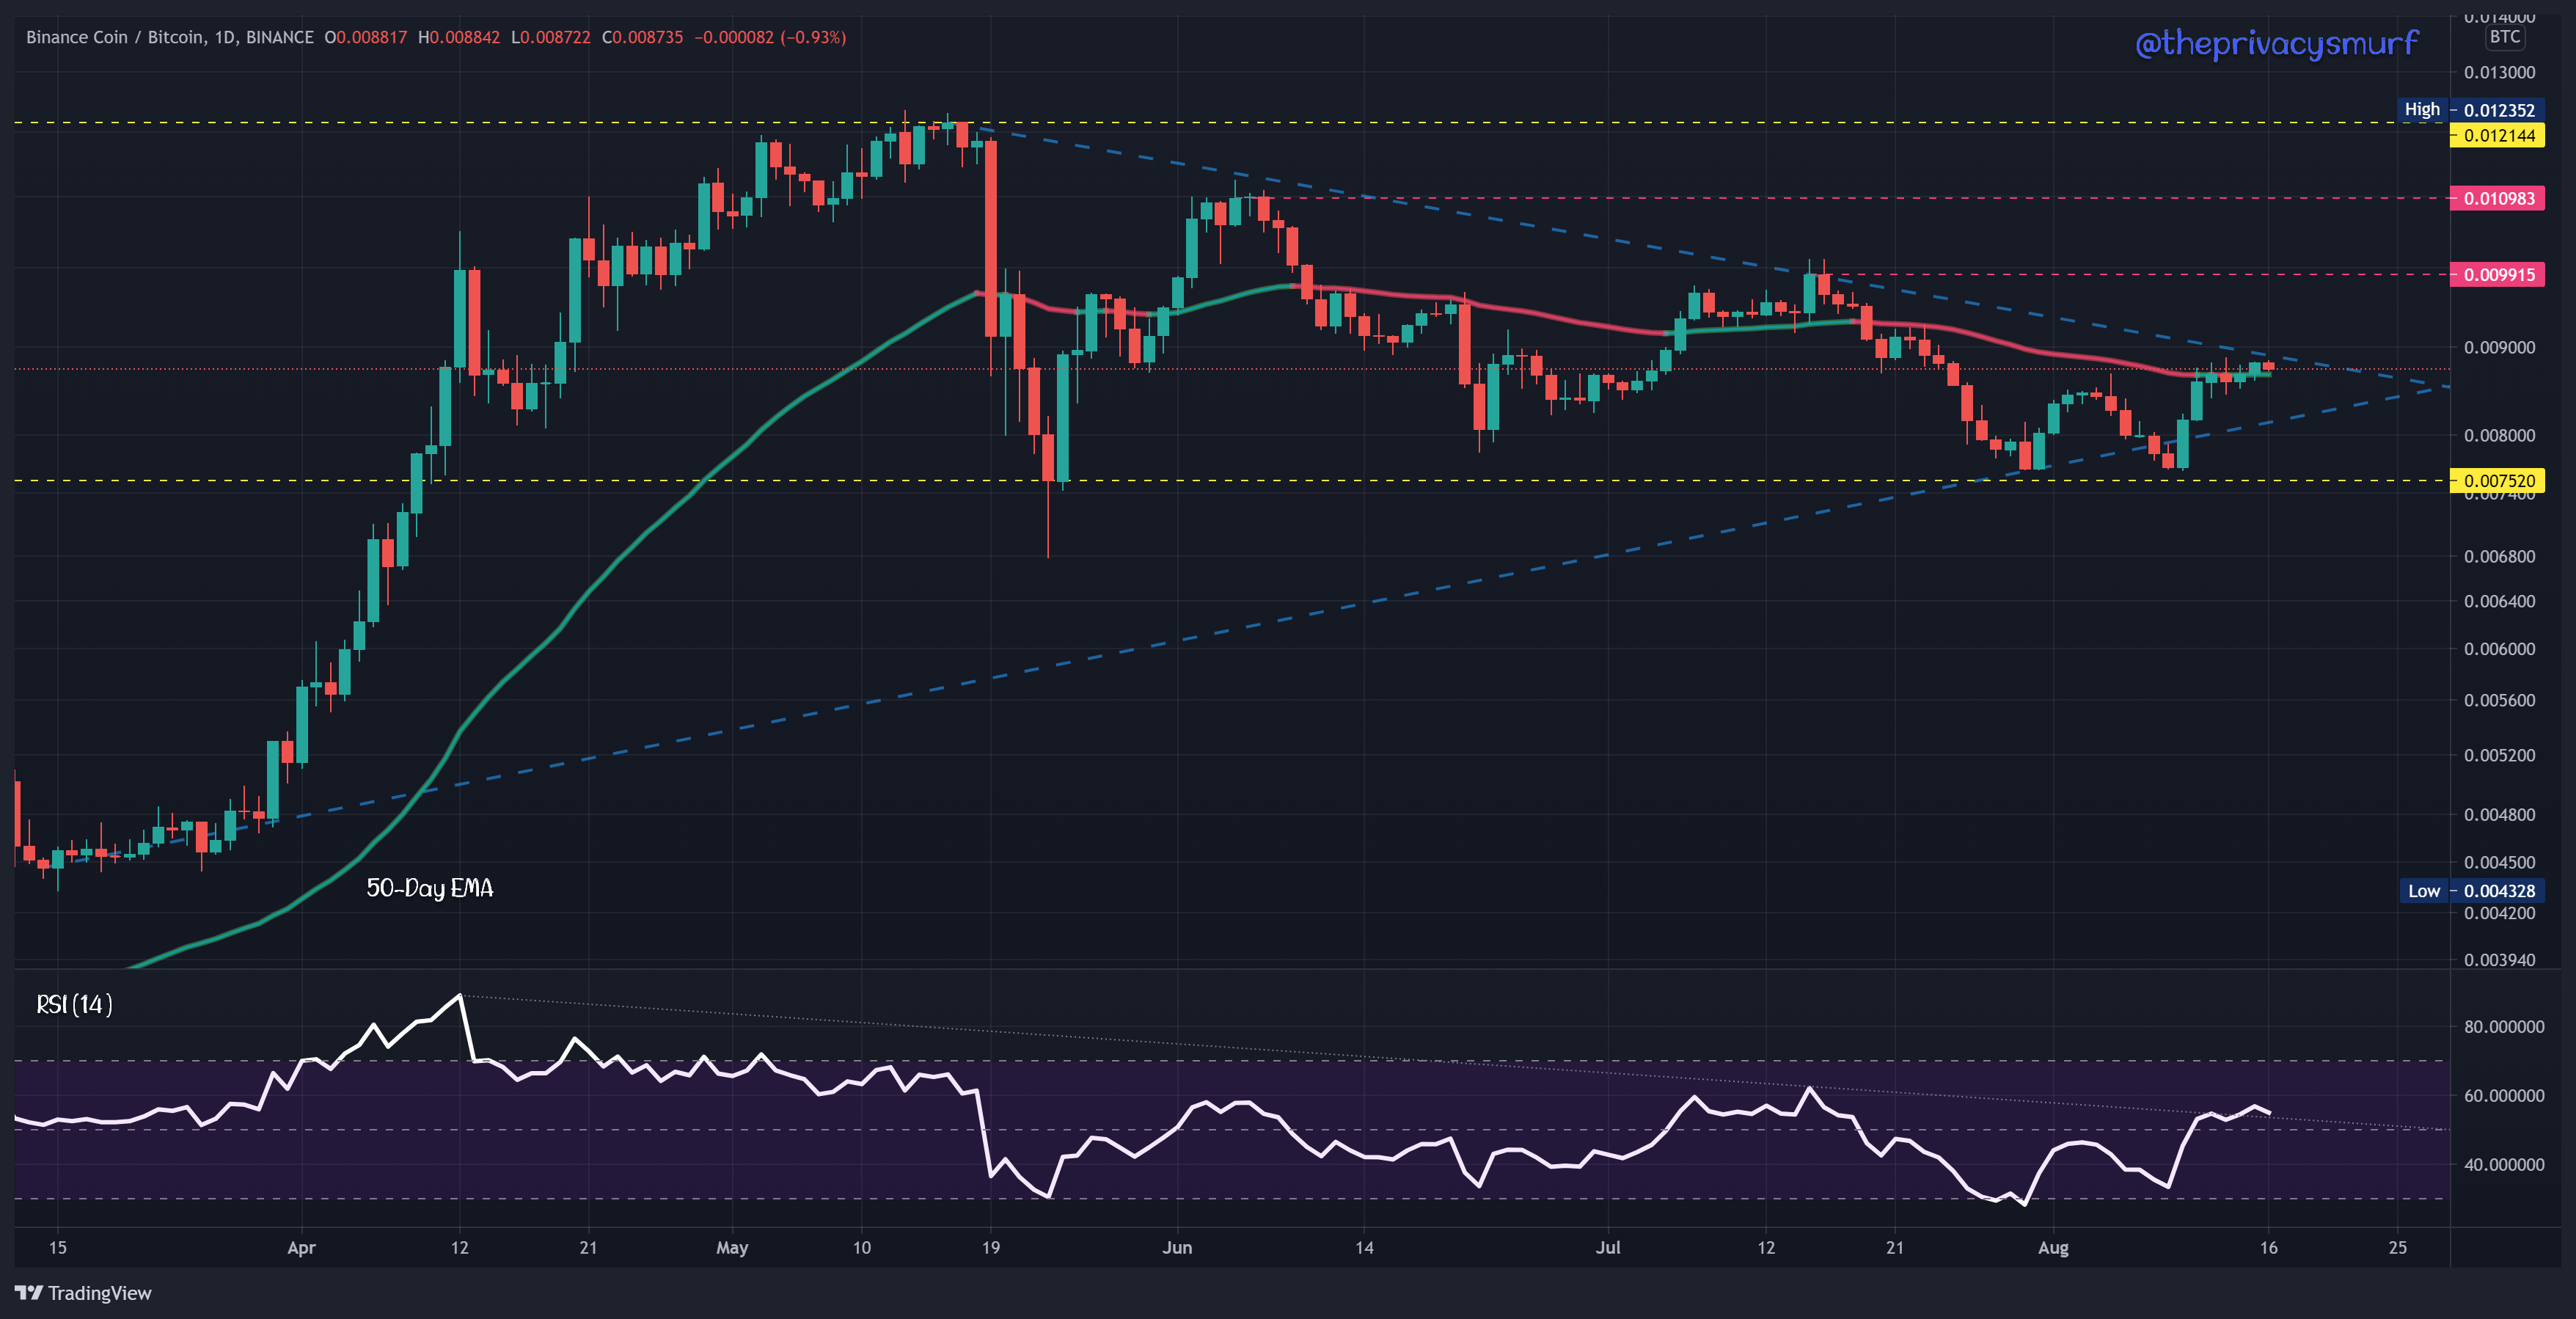
BNB (Binance Coin)
Volatility can be expected with the BNB price coming up soon. The 50-Day EMA has been holding up as resistance while two angular trend lines converge. The RSI has just broken out of a months-long downtrend. Testing the midline for support and a bounce off the angular trend line may be enough to break out towards the upside. A fakeout to the bottom would also be something to be wary of. The 0.00752 price point has acted as support. If the RSI fails I would expect that to align with a failure of the 0.00752 price point leading to BNB decreasing in value relative to BTC. The next support isn’t until the last low at 0.004328 - 0.0048 so if one was a BNB holder selling BTC profits into BNB at that mark would be an extremely valuable discount on BNB.
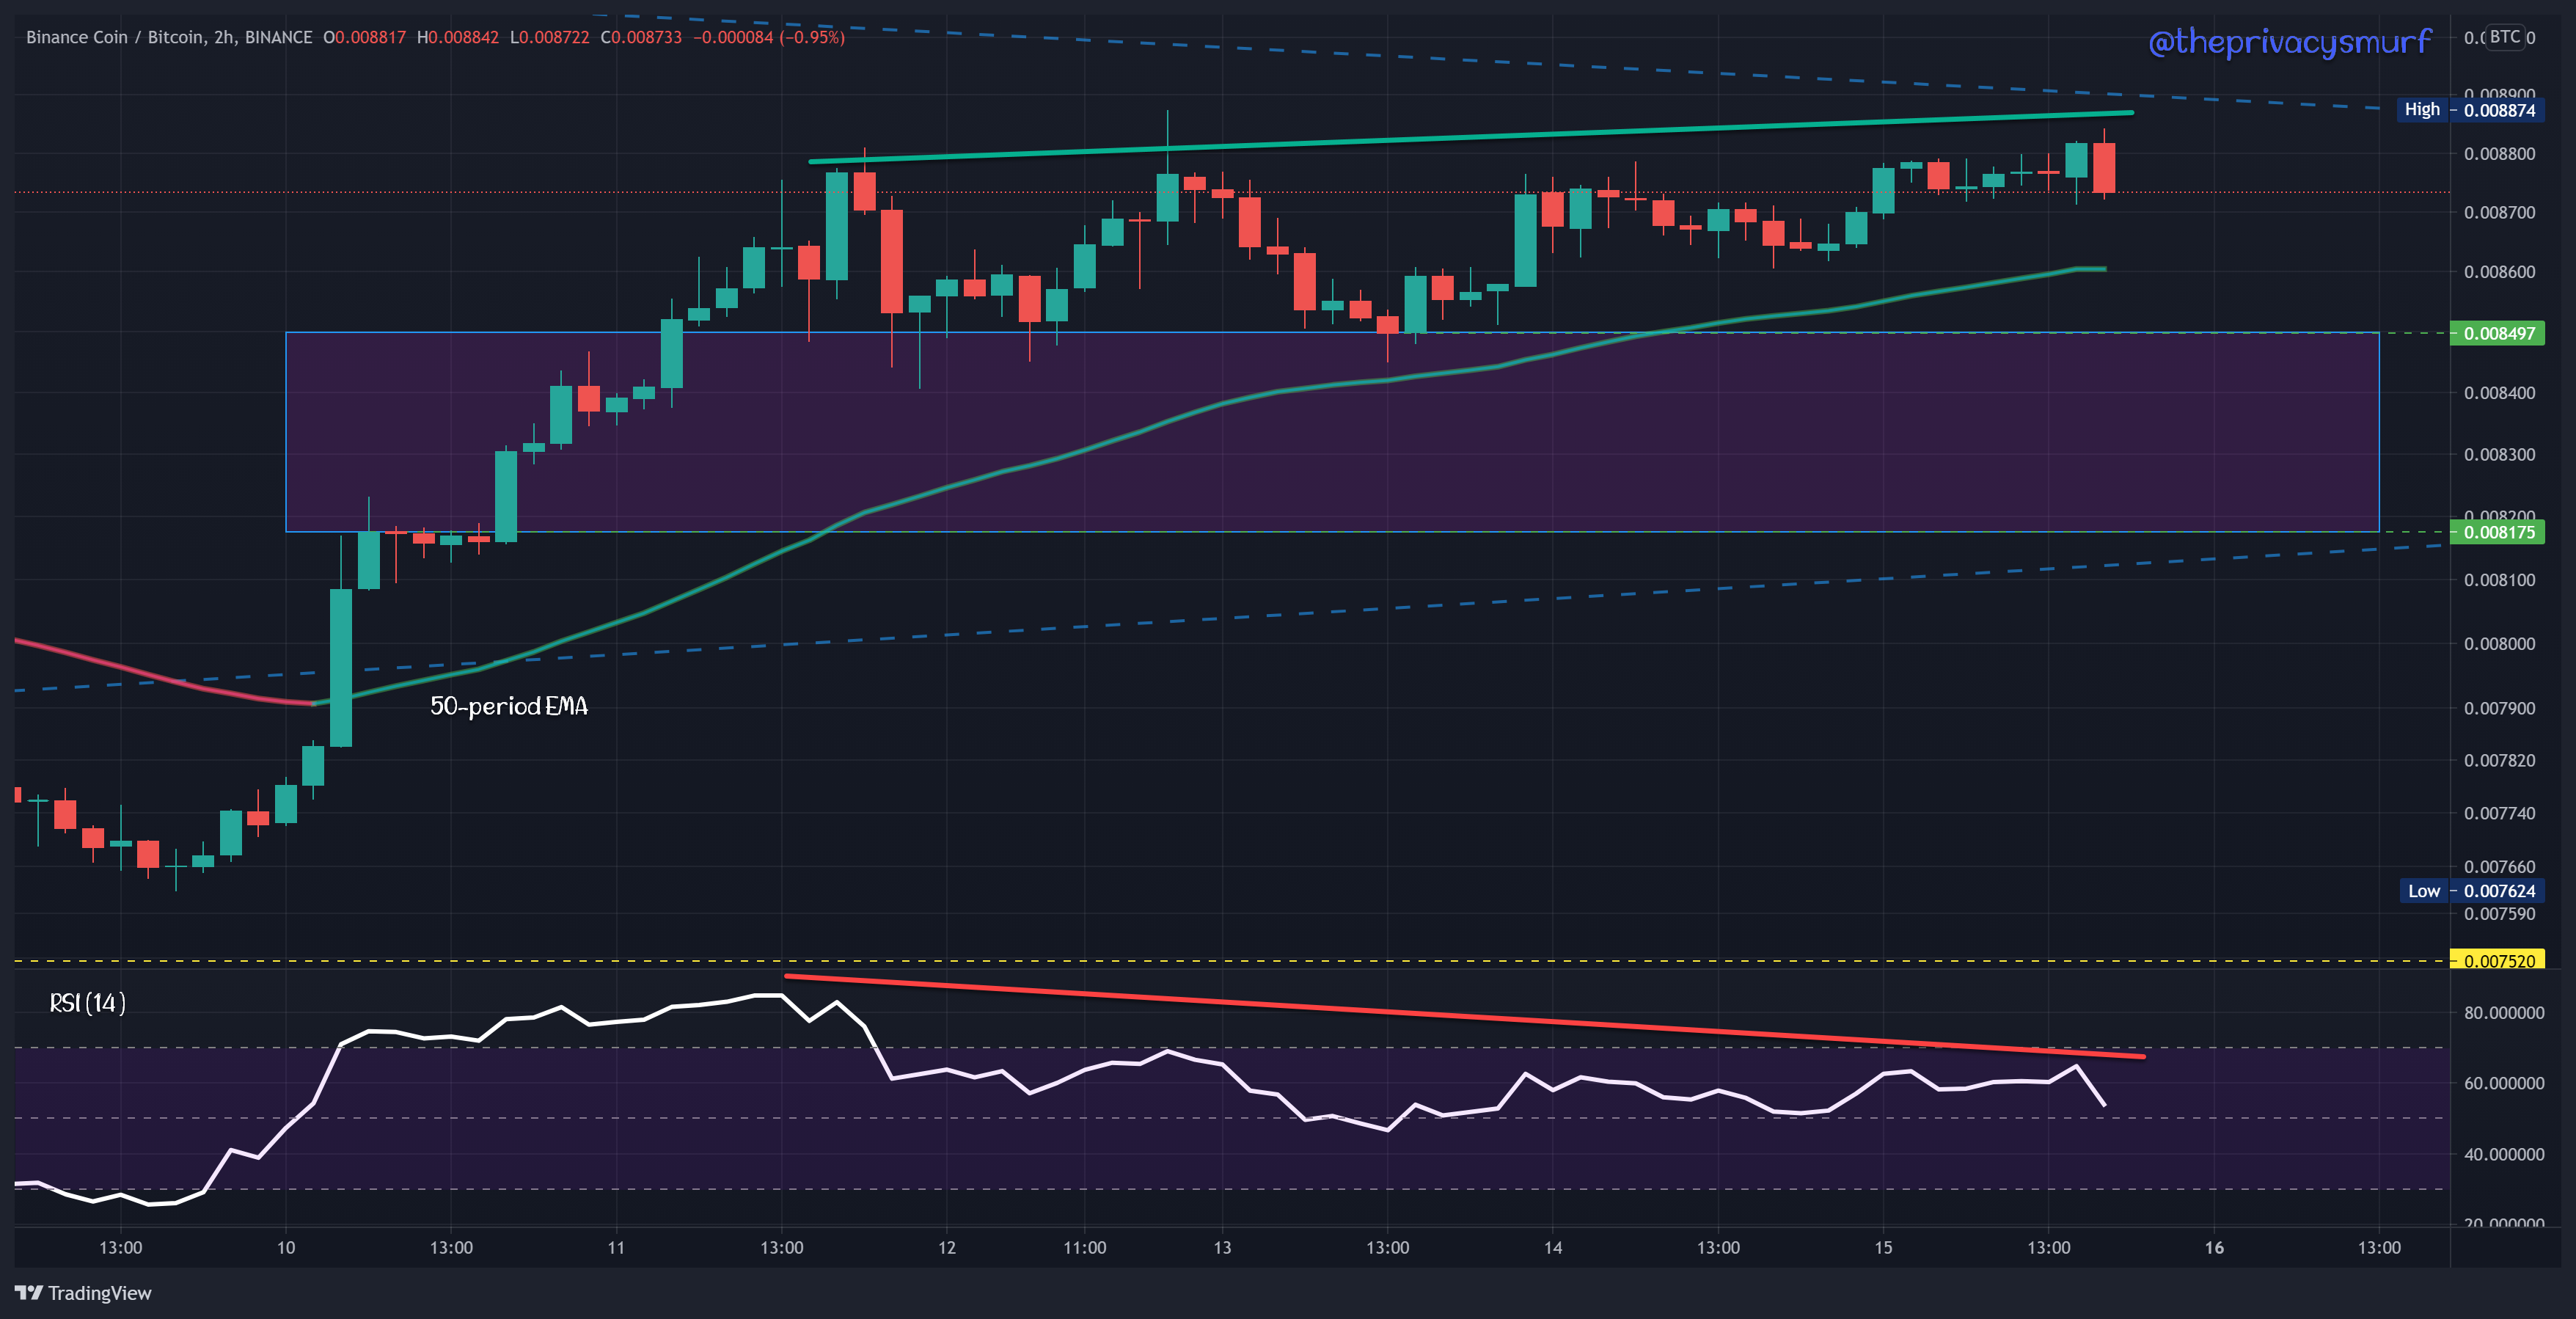
The 2HR timeframe shows a bearish divergence with the price slightly increasing and the RSI decreasing. This validates the notion that price relative to BTC will likely decline from the descending angular trendline. The zone highlighted between 0.008175 - 0.008498 is where I’d be watching for bullish price action patterns if I were to be buying BNB with BTC, building a position for a potential breakout, although that is a risky prospect.
ALGO (Algorand)
Willy Woo wrote a great piece a while back that someone recently reposted. First go read this post because I don’t wanna recreate the wheel and he’s a great voice to listen to anyways.
Welcome back. Check out this chart. This is exactly what he was referring to. This coin is an “oscillator” because it moves back and forth between a set range predictably and consistently over a long period of time. If you are looking for a trading pair to make profits on like I mentioned in this post about currency pairs here’s a perfect example, ALGO/BTC. See how you can sell and buy around either extreme ranges in red if you are super patient or back and forth between each third.
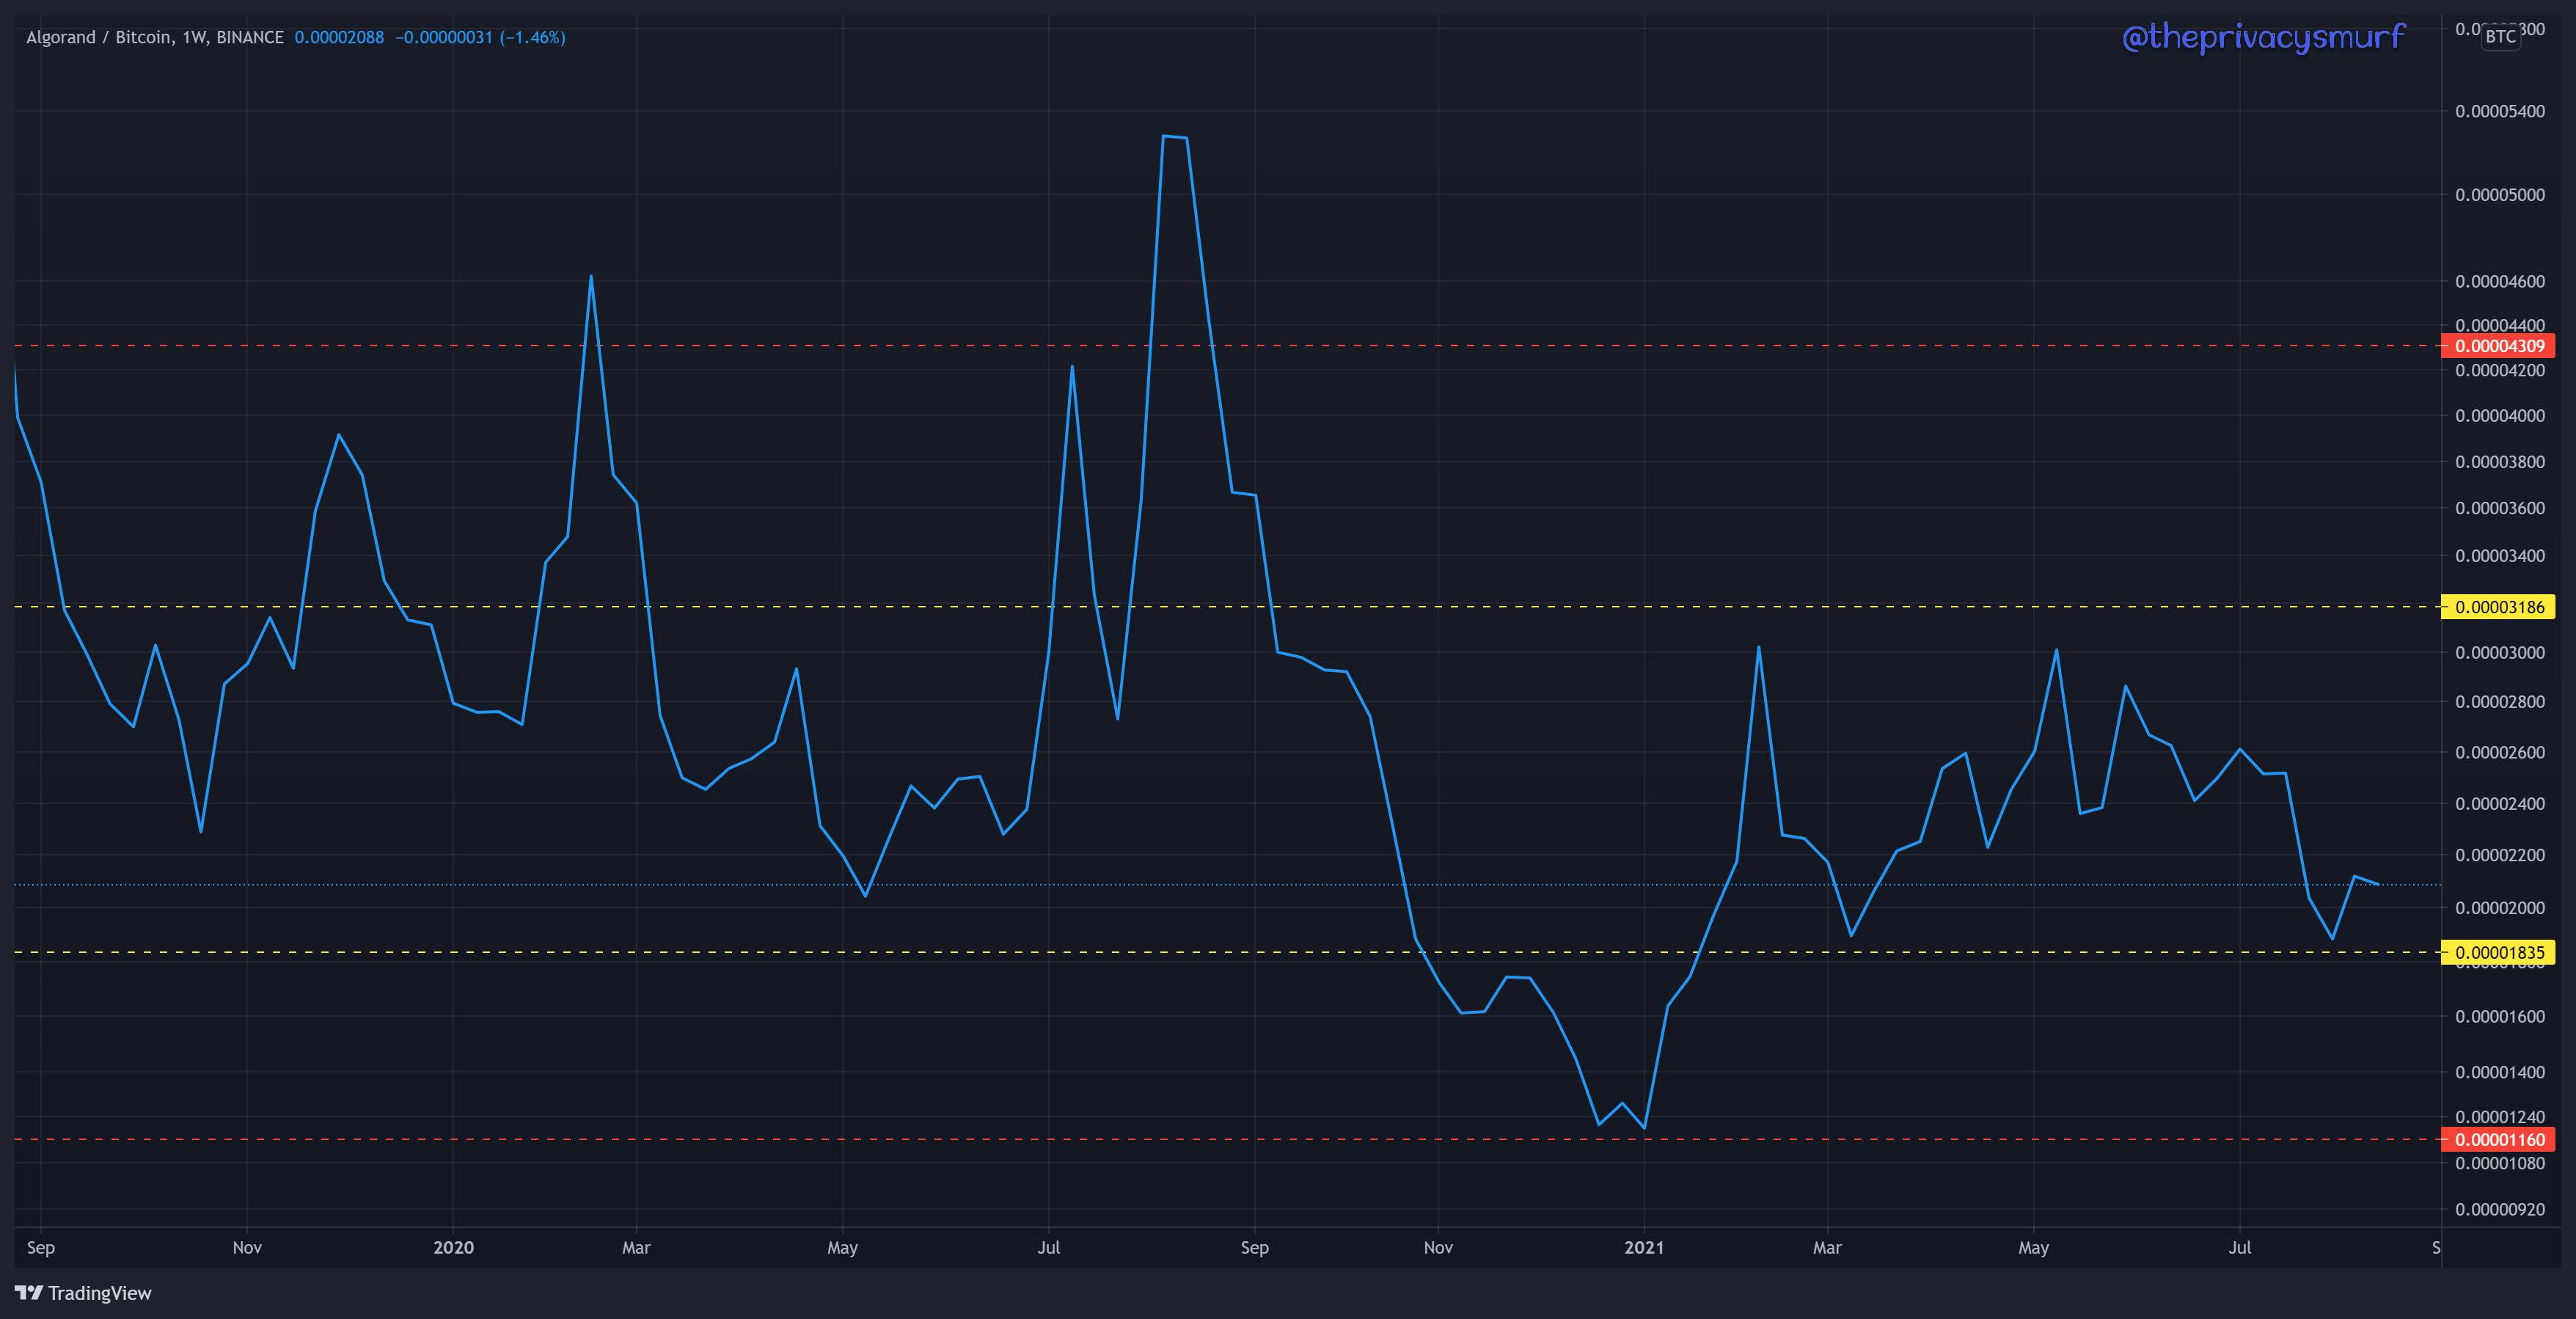
Swapping over to the candle chart, but still in the weekly timeframe you can see how the wicks are penetrating each divider with regularity. Each time presents an opportunity to sell BTC for ALGO at the bottom of the ranges and back into BTC at the tops. More volatility is expected in the near future as there are two pair converging angular trend lines, one on the price and one on the RSI. I’d expect price compression between the 50-Week EMA and the 0.00001835 mark until an inevitable breakout occurs.

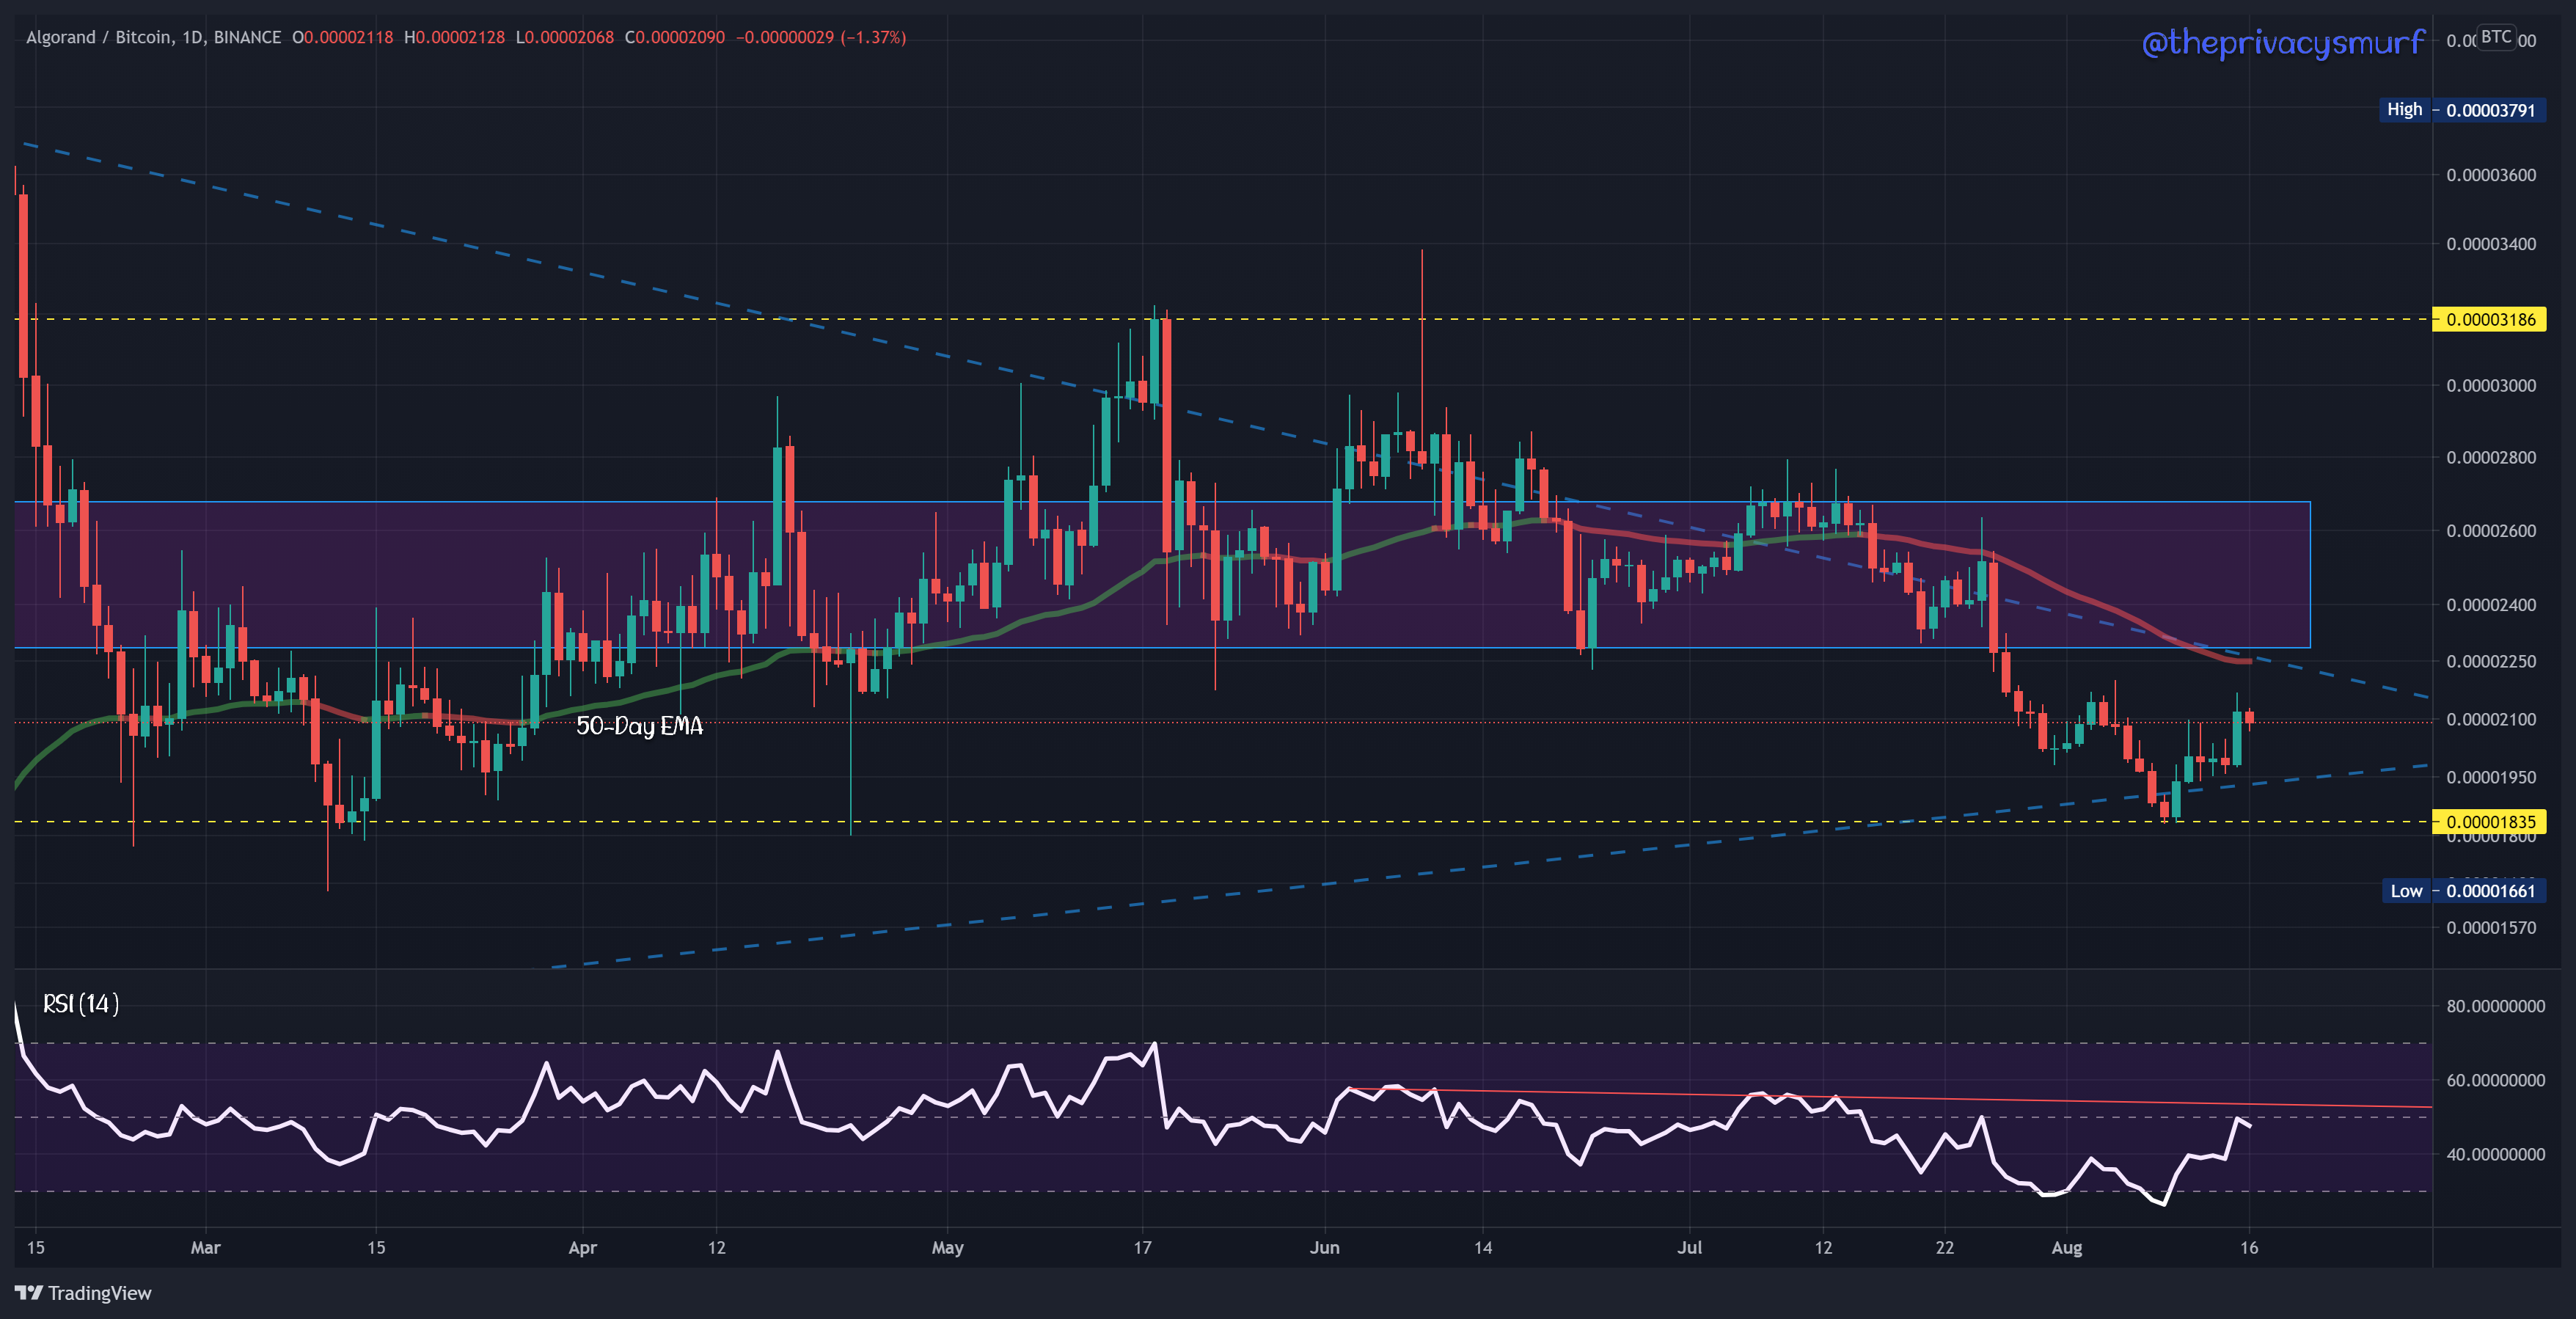
The Daily chart gives me a reason to think that breakout will be to the downside with the RSI having a resistance of the midline and a long-term descending trendline, plus price with a descending trendline and the 50-Day EMA. There may be an opportunity to pick this up cheap with BTC later at the lower weekly support level in red (above).
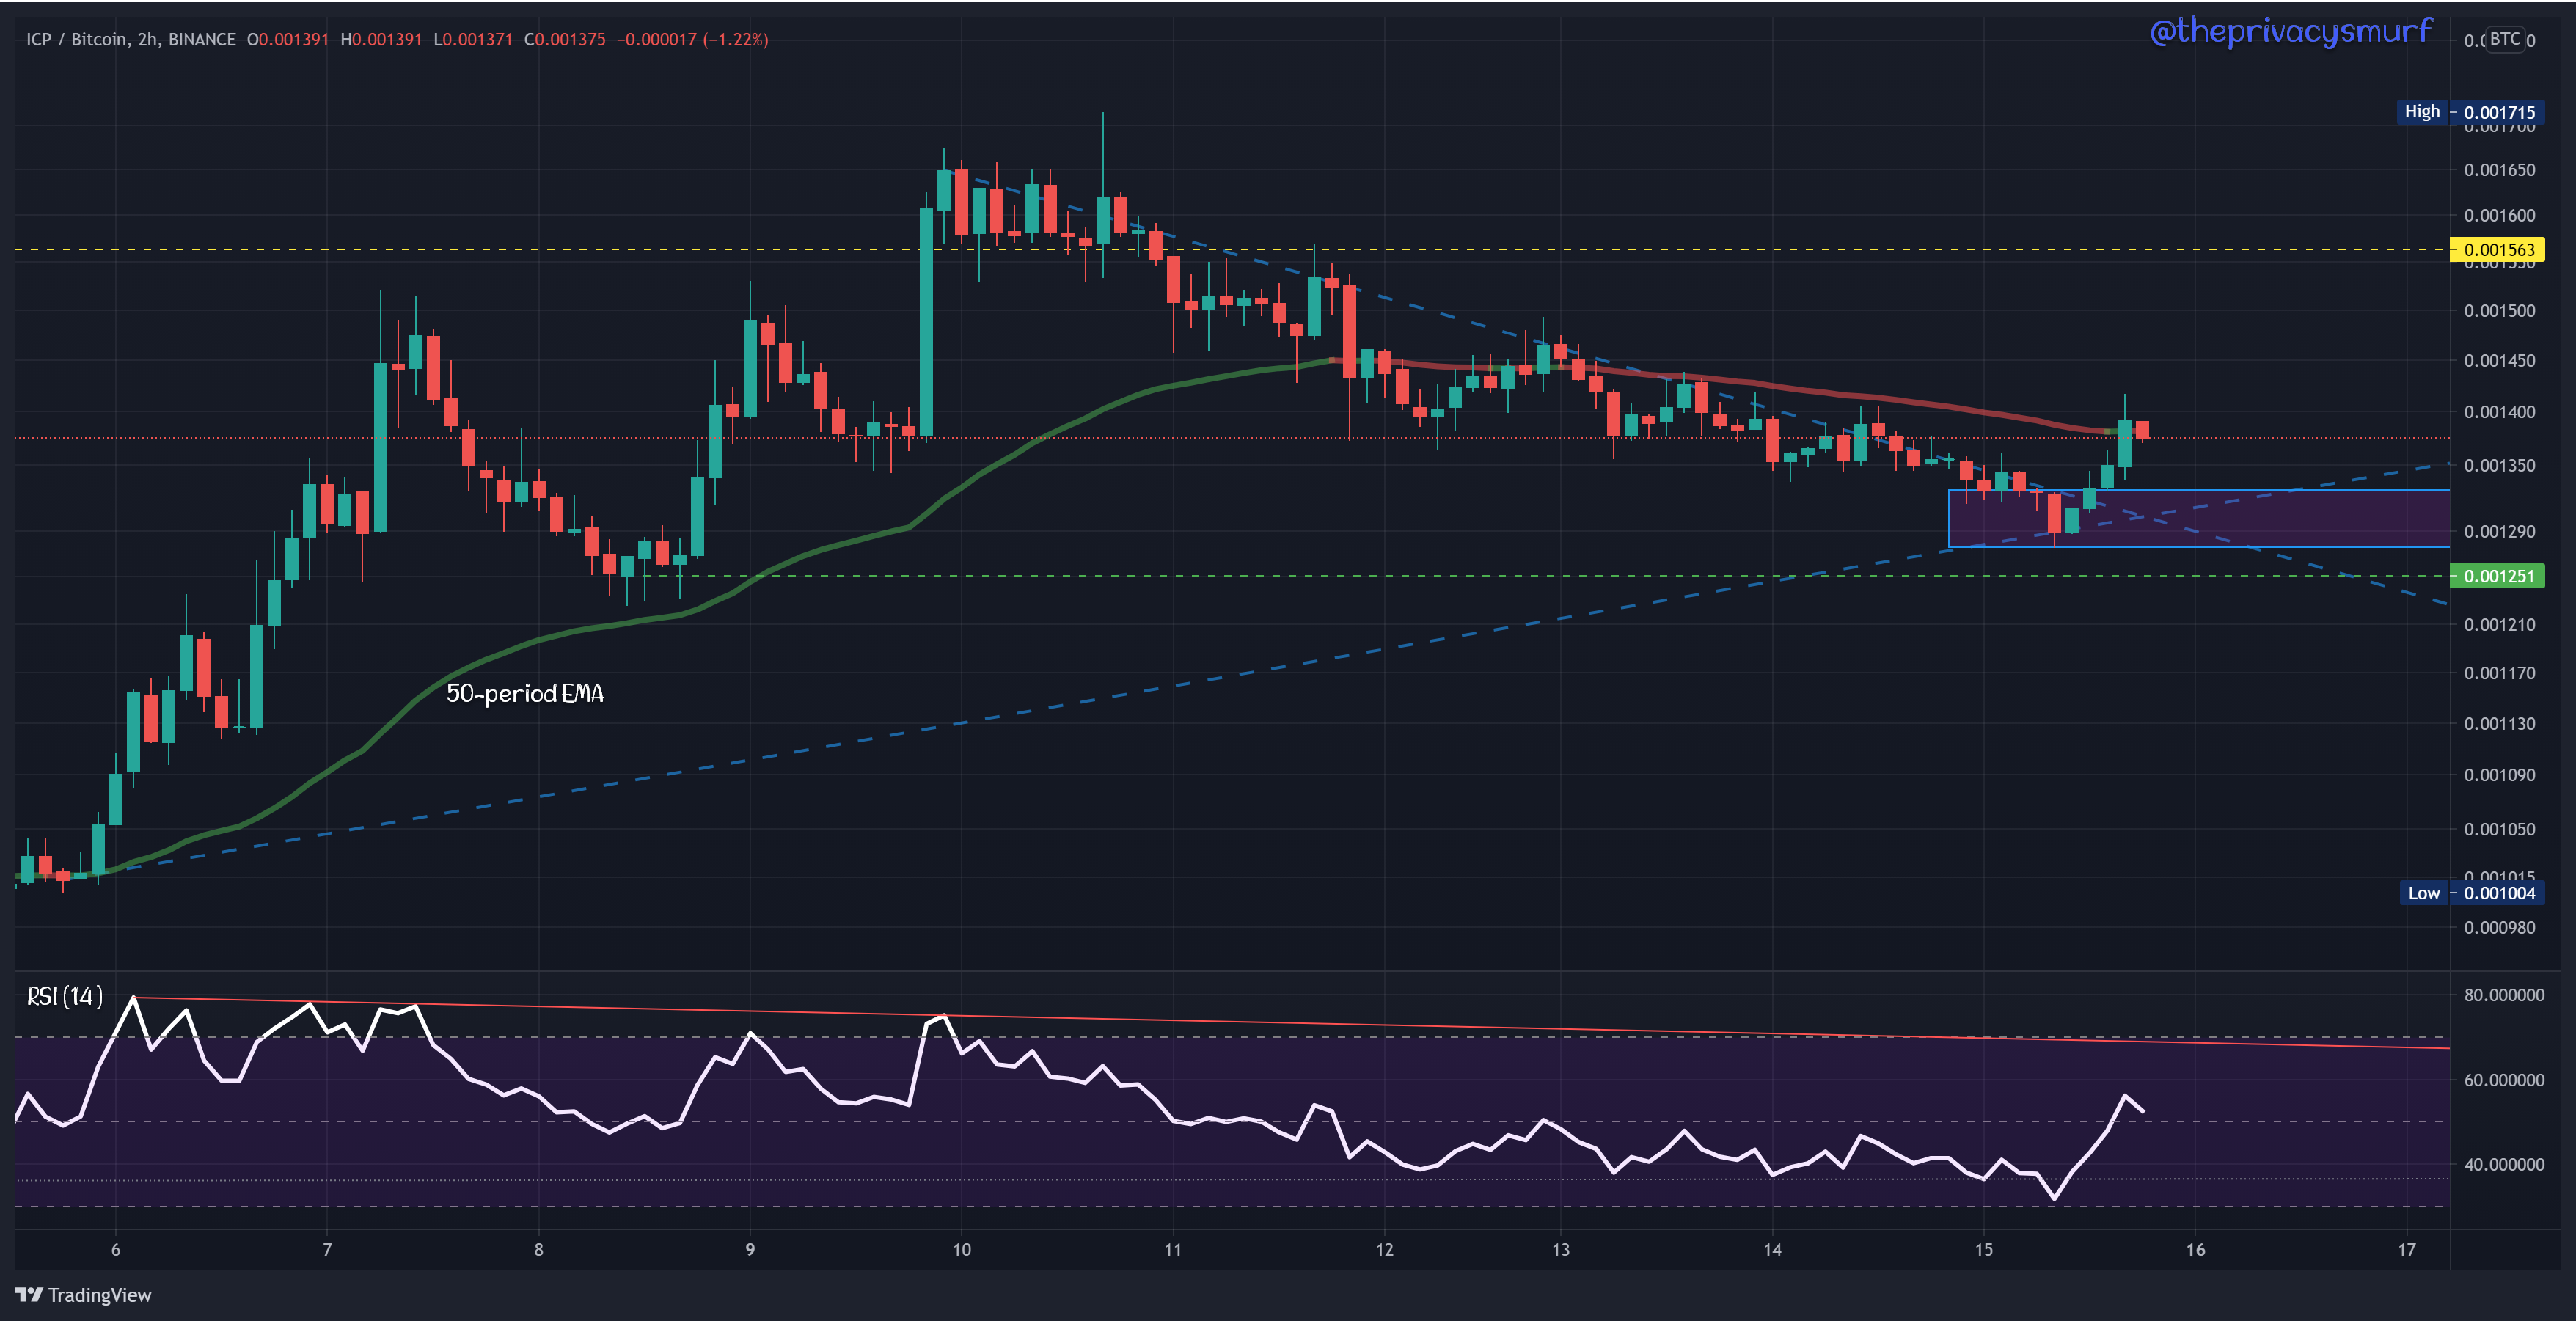
ICP ( Internet Computer)
I don’t know if anyone remembers but ICP was a wild flash in the pan. The listing day on Binance it opened at $249 and spiked all the way to $2831.02 (+677% ) and closed the first day at 364.01. Since then it’s been on a gradual slide. This is the BTC chart but it’s starting to show signs of life. The RSI in bullish territory and the price is butting up to first of only a few resistances before price discovery, relative to BTC. This will be something to watch in the near future and get some insight on a smaller timeframe because this chart isn’t giving me enough to really warrant action or make a plan.

Here on the 2HR chart, we see that price is breaking out to the topside of converging angular trendlines. The RSI is broken above the midline and is heading back to test as support which will likely align with a breakout confirmation test of the descending trendline. Watching price action in the zone around the convergence will give insight as to whether ICP will fail or not in relation to BTC. Patience is a key here.
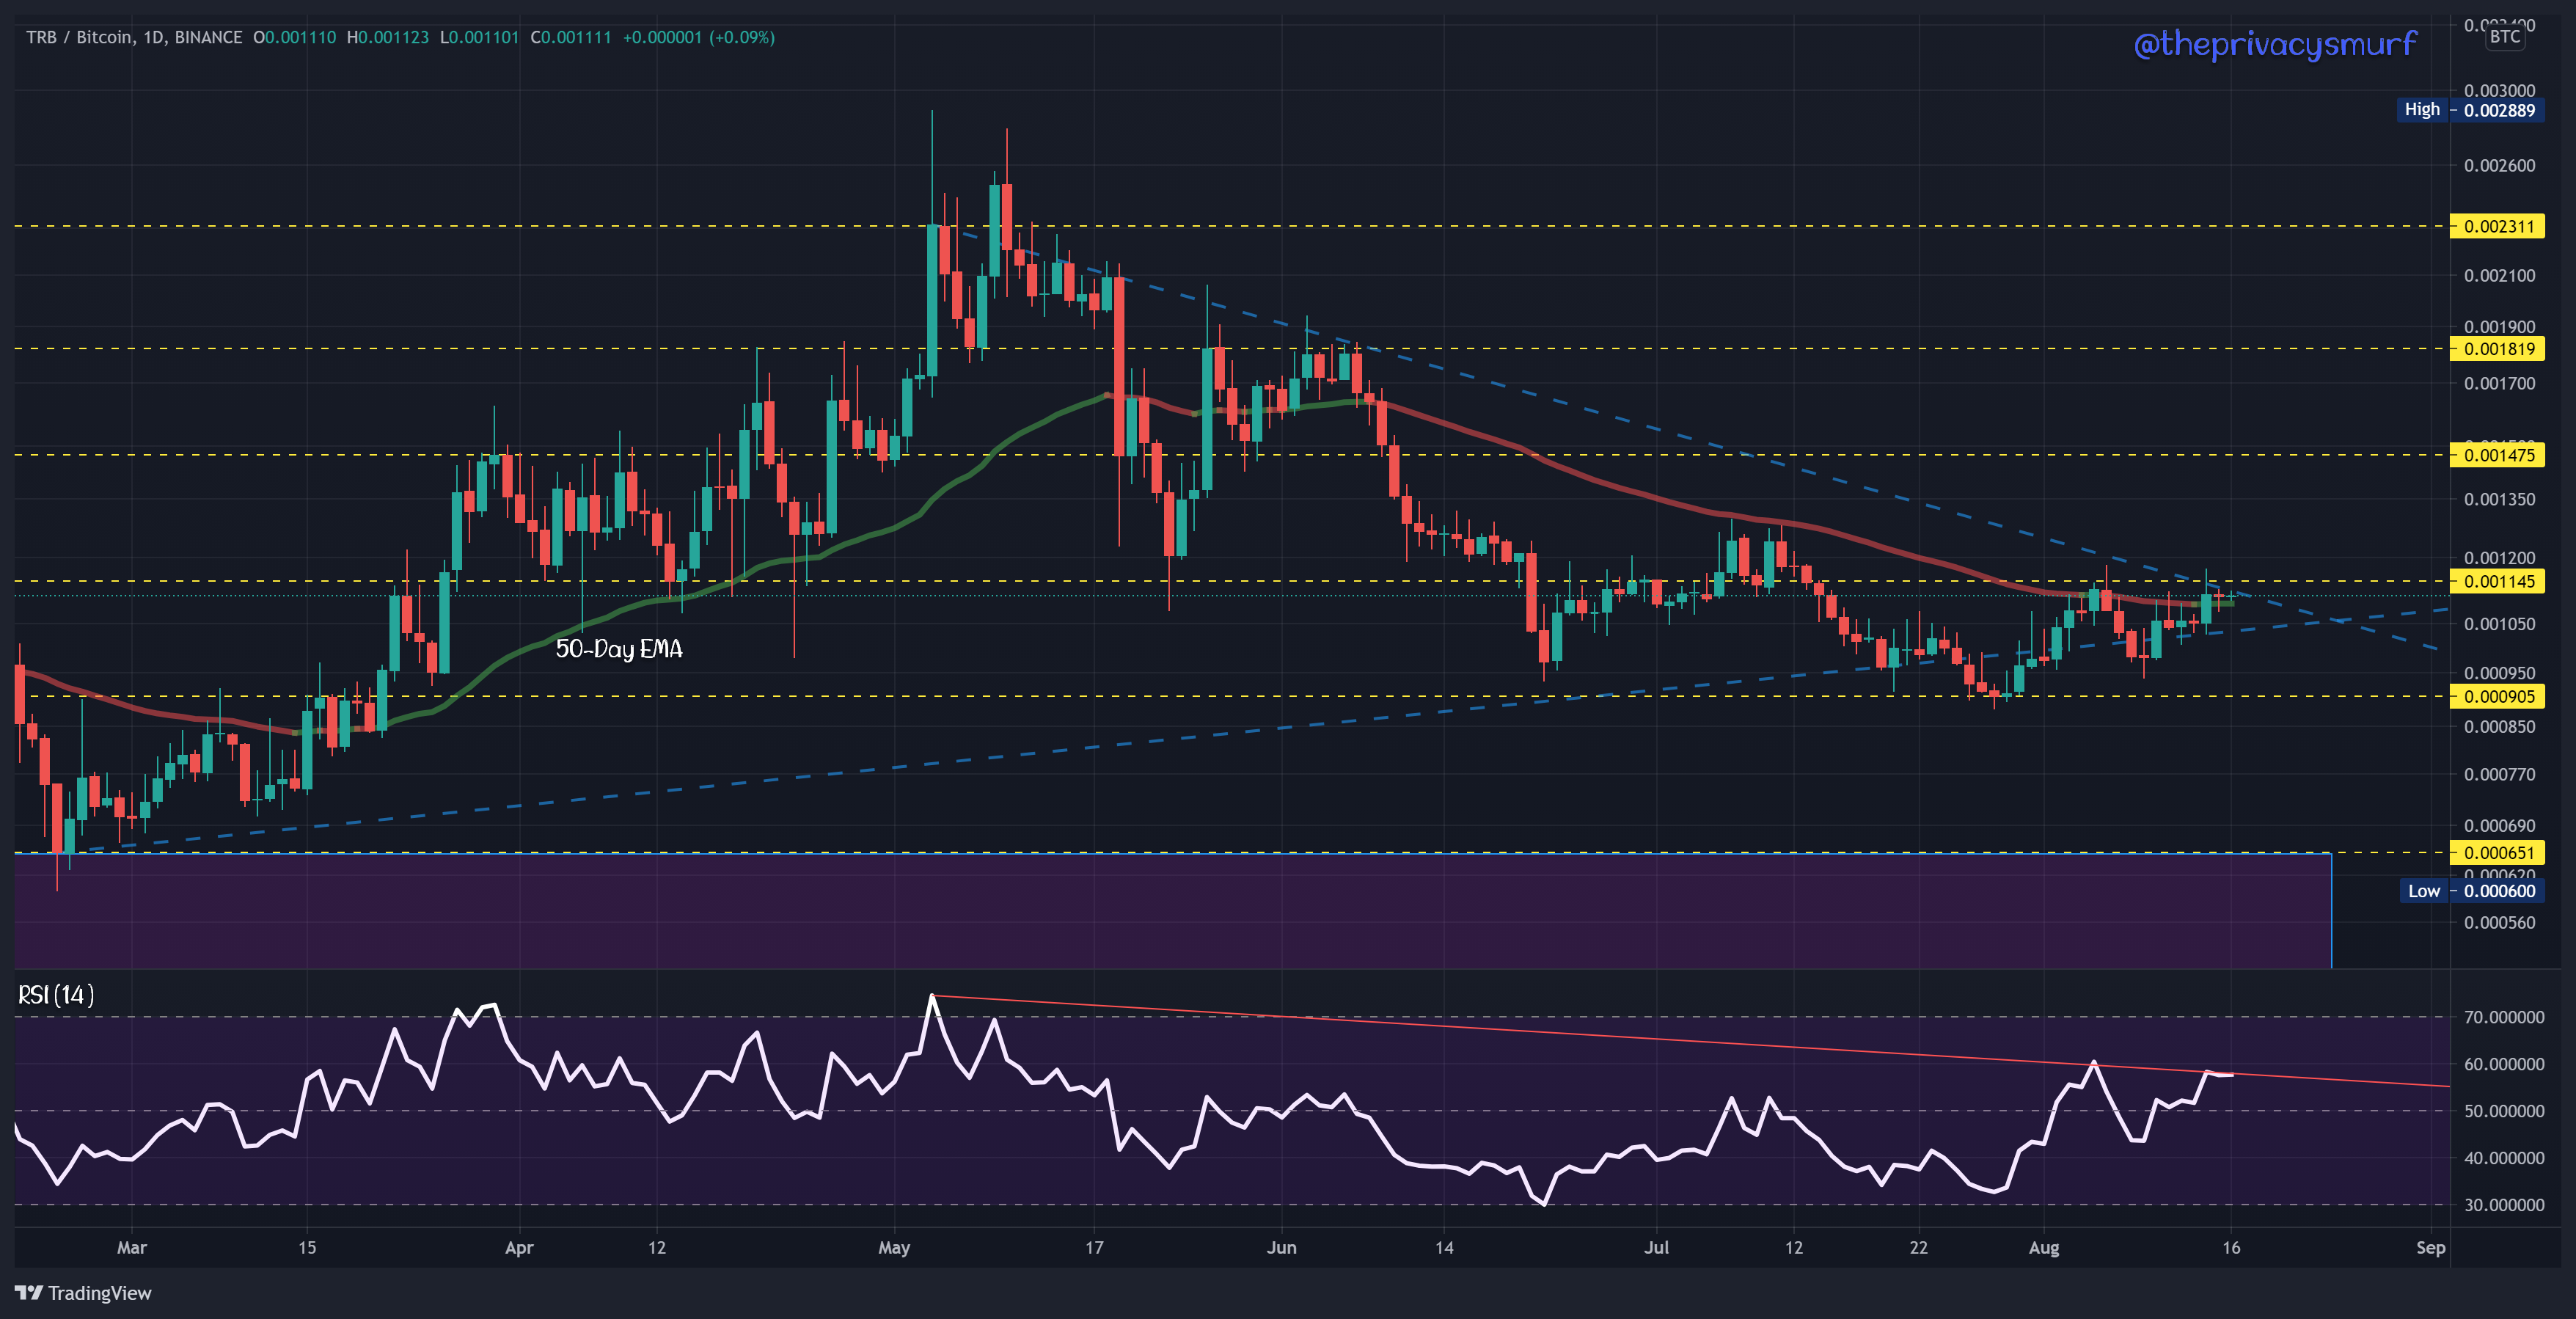
TRB (Tellor) *Randomly Selected*
One thing that I enjoy about the reader-selected coins is I get to see all sorts of things that I would have never heard of or looked at otherwise. Here TRB is in a similar position, compressed price action between converging trendlines, 50-Day EMA and descending trendline on the RSI. Volatility is expected in the near future here as well. A smaller timeframe will provide some more clarity on the potential break.
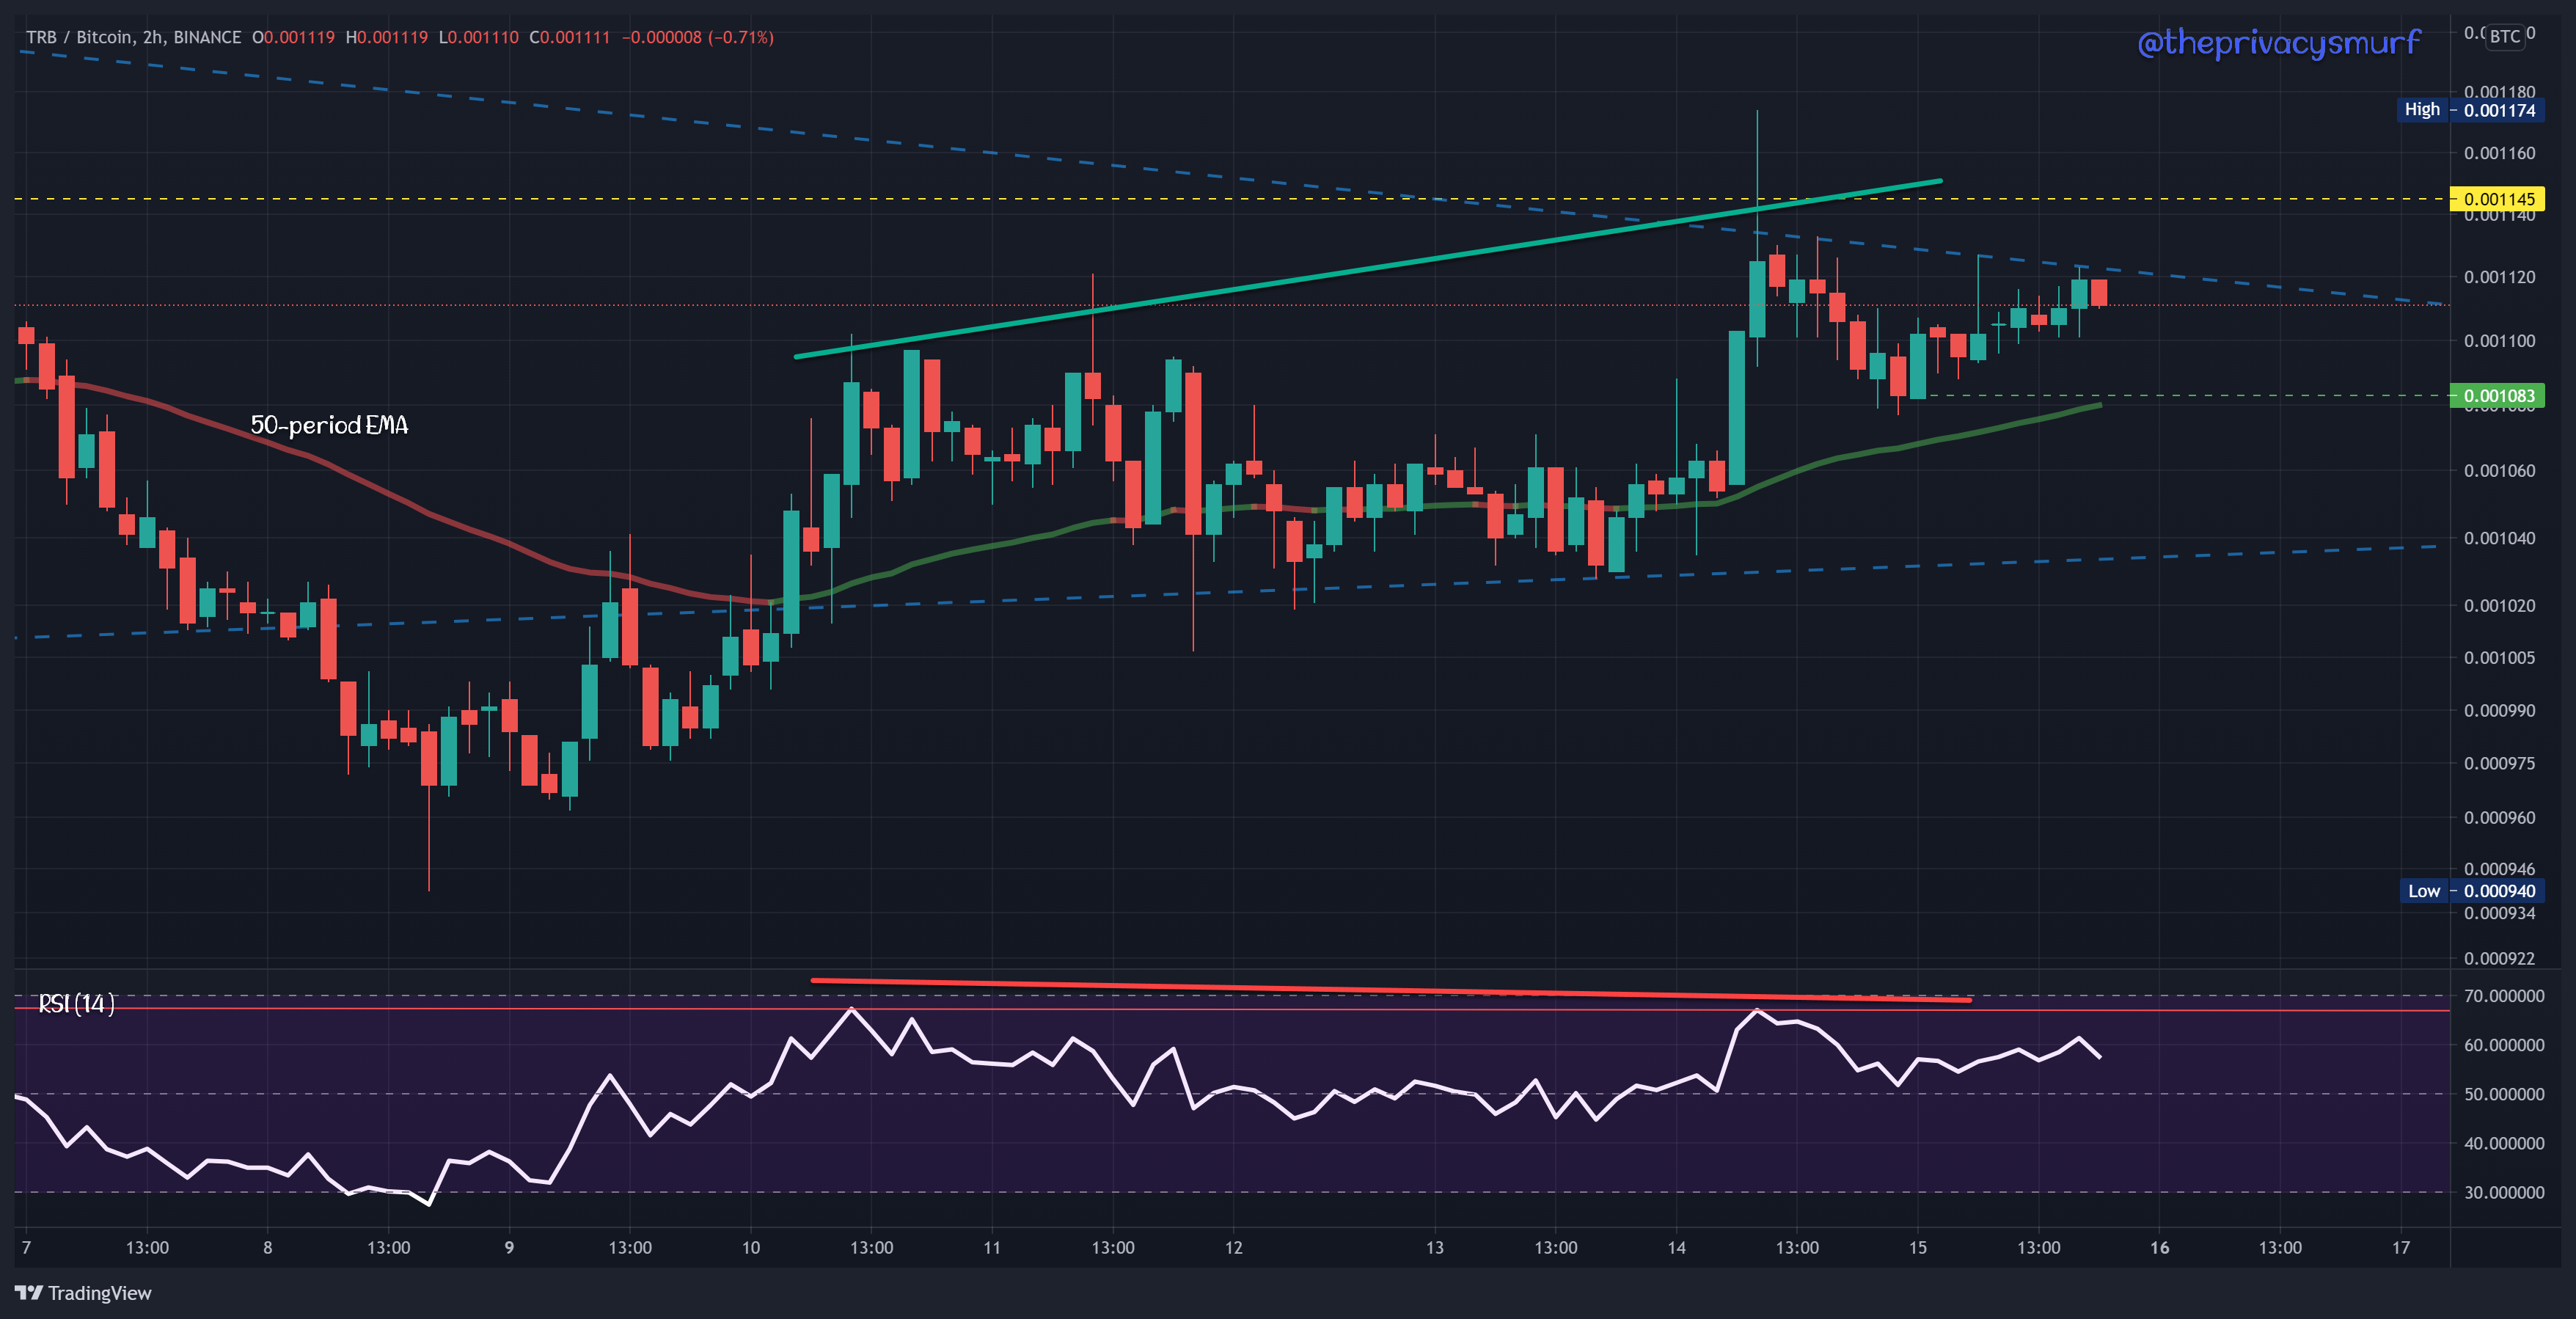
Increasing prices and slightly decreasing RSI measurements show bearish divergence. I wouldn’t be expecting the value here to increase without some extra buy volume. A retracement to the 0.001083 will likely provide the first support as that low pivot point is backed up by the 50-period EMA. Failure there and the 0.00104 mark will be the next support and may be followed by a bounce back up making the consolidation range even tighter over the next couple of days.
That’s all I’ve got for the Altcoins today. Don’t forget to submit your suggestions in a comment for me to add to the list to write up for August 29th.
That wraps up the bonus week of free posts. Tomorrow, I’ll post up the Sunday Synopsis, which goes back to the alternating schedule or subscribers. It will be free this week and on the paid side next week. I’ll have the Micro Monday tomorrow as well if I can wrap it up before it gets too late. I’m a bit behind because I ended up doing some intraday trading this afternoon along with dogsitting a good old doggo. There was a lot of good bullish price action this evening. On the horizon, the 5th of September should be a good Sunday synopsis, which will also be on the paid side. I’ll be doing an update to my cycle analysis, the final update of Q3. I think it will be really important, a bit more so than the Q4 cycle models I’ll post on October 1st, because I have a suspicion that early October we will be in the thick of the bullish price action, and setting up for that needs to be happening right now and next month.
Regardless, give this a share if you don’t mind.
Join up for the paid side if you like this type of info and want to keep getting it every week. Thanks again for reading!
@theprivacysmurf
I'm rooting for you to cover an IOHK project, HYDRA
Good Evening; my little gem is Badger DAO brought at £11 and was last time I looked £27 but went up to the £30 range (probably $ not £), but in the 150% ish range, also DENT which went up 100% plus... Happy days as a newbie! Burt