

SS #59: Whatchawannado
SS #59: Whatchawannado
Do you wanna get out?

This post series is live on the new site.
https://zenalytics.info
This series will be available for the new site's short- and medium-term packages.
If you haven’t registered as a free community member, please do so so you can roll over and get your membership perks as a prior subscriber. Details here.
Quick post tonight over the holidays. Just got time to ‘dot my I’s, cross my T’s… do my job and leave’.
BTC/USDT Daily Chart
https://www.tradingview.com/chart/jjSdFW4b/
From last week:
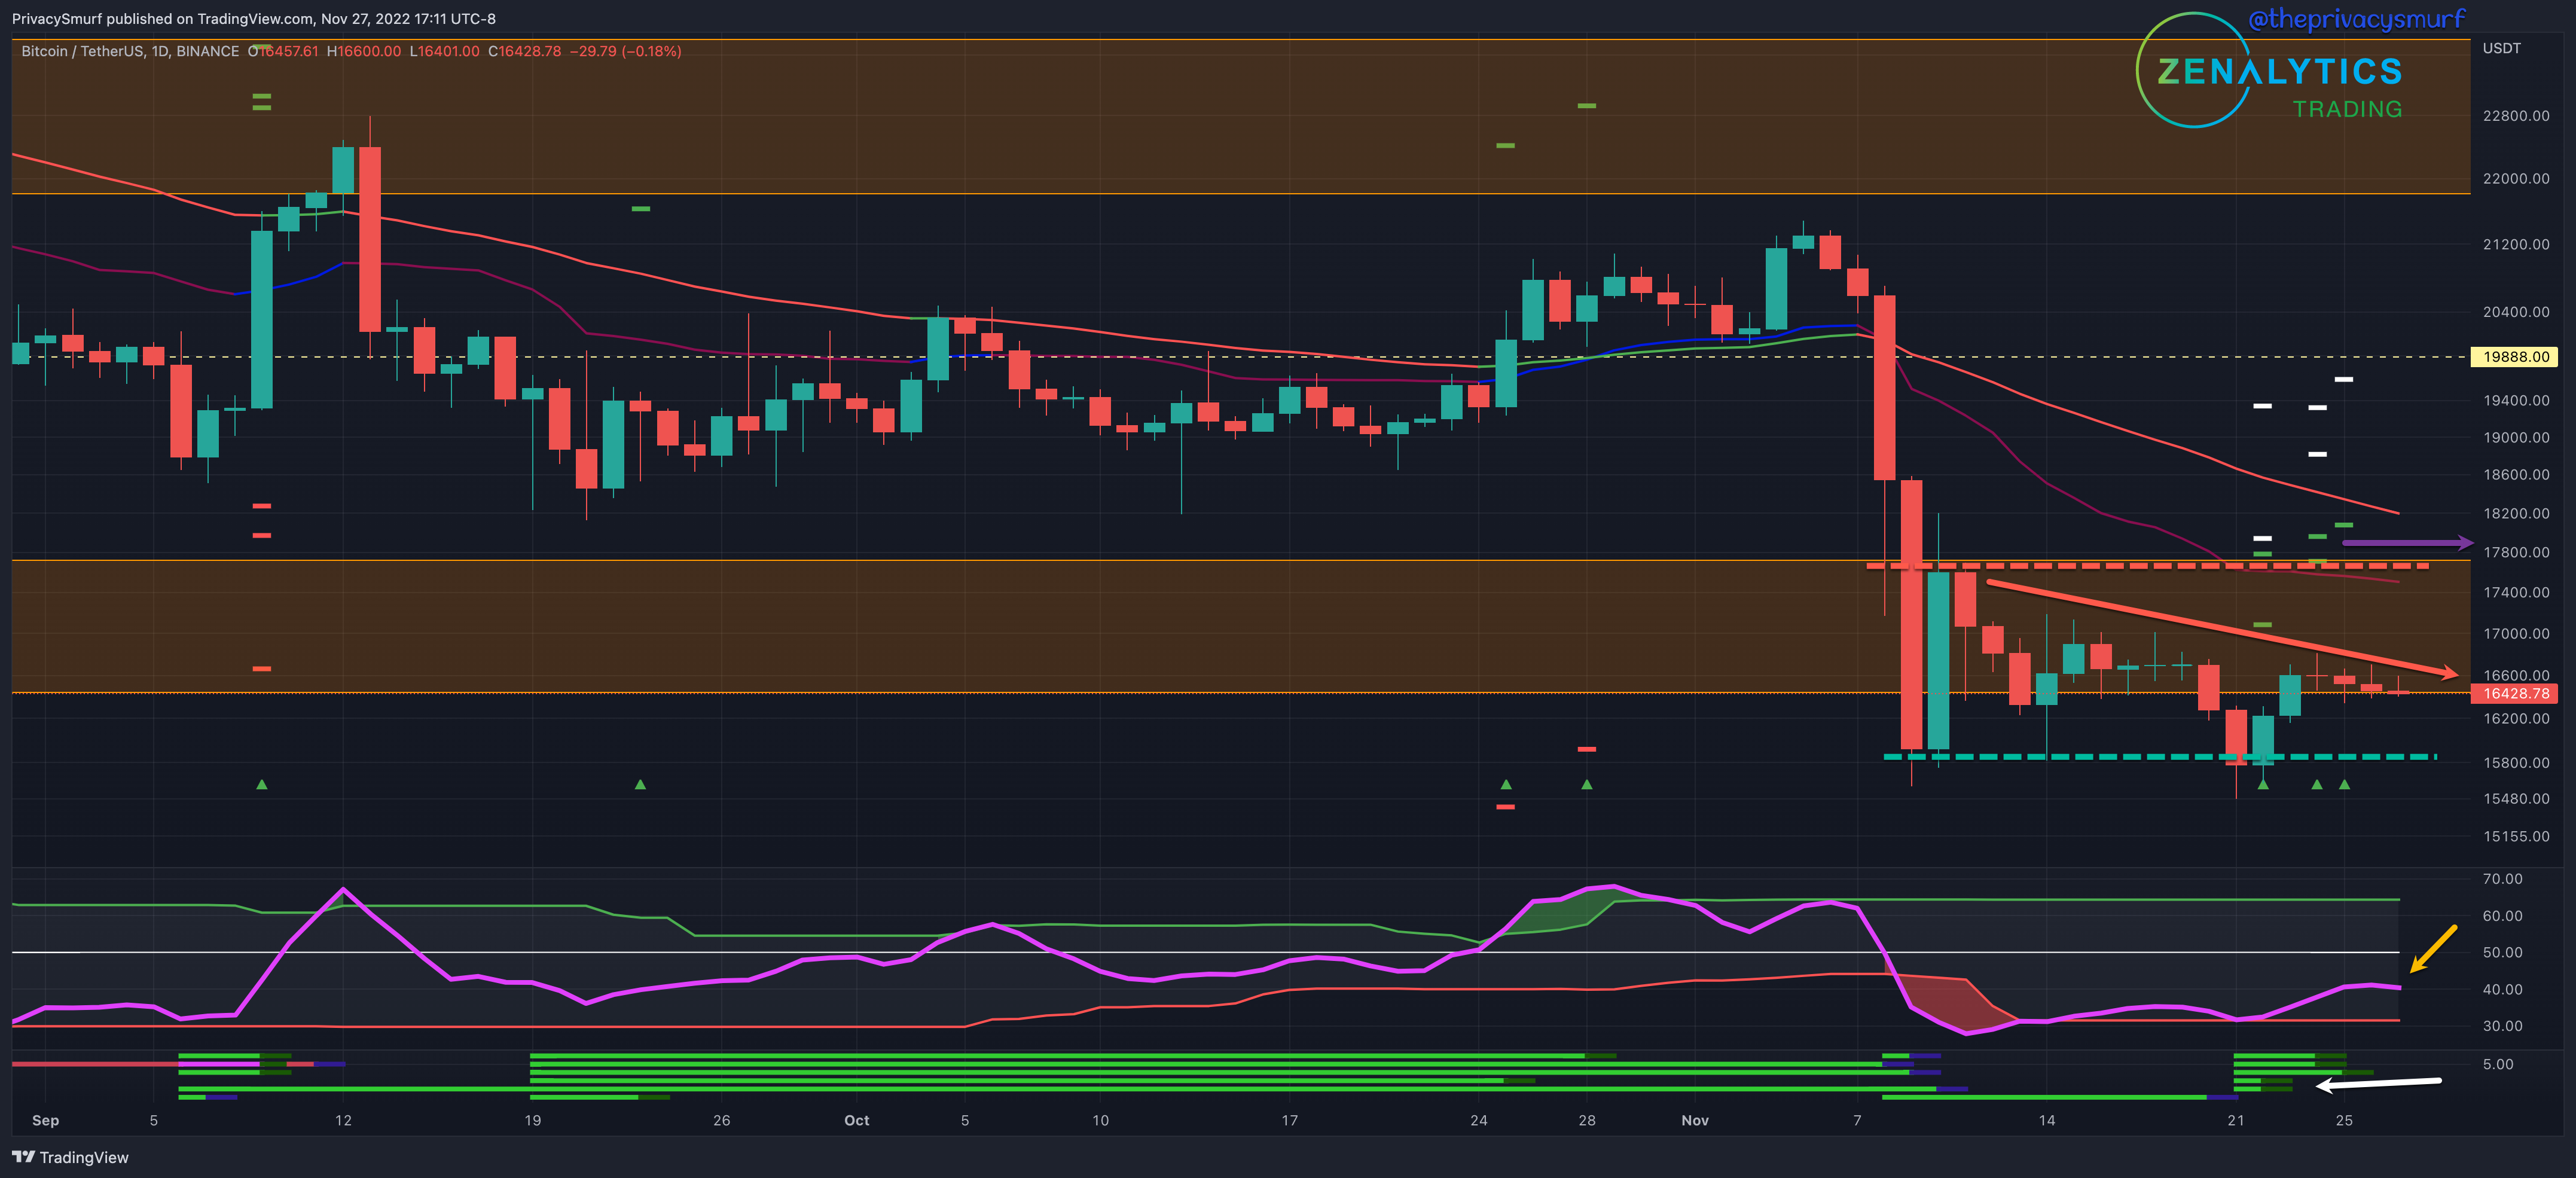
“…still expect pricing in the $15800 - $17800 range… potential for bearish continuation… wicks below the support. Intraday bullish divergences may be good, yet risky plays to the long side when the price gets to the support...”
We saw wicking under the low support early in the week and decent entries on the intraday charts. I’ll go over those on Tuesday. The chart presents mixed messages compared to last week. Most importantly, when prices made a new low, my custom indicator, the Correction Strength Meter, showed the potential for a bullish reversal (white arrow). Bullish trade conditions have been signaled. Secondary targets are plotting up near the high of the range (purple arrow), and initial targets are near the middle of the range. The targets may have to wait until the price compression in the downwards wedging structure between the support (green dashed line) and the descending trendline (red arrow) breaks out. This trade carries additional risk as the trend is still bearish. The RSI (yellow arrow) is still under the midline, suggesting a bearish influence on prices. Turning back down and breaking the bottom band may lead to a failure of the lows and daily closes under support.
Given the week's current technicals, I still expect pricing in the $15800 - $17800 range. There is an increased potential of lower lows this week. My bias this week is still bearish, but considering the price is closer to support at the moment, shorts wouldn’t be entertained unless there are daily closes below the support, and I’d look to play the failure of the $15800 level. Intraday bullish divergences may be good, yet risky plays to the long side when the price gets to the support.
ETH/BTC Daily Chart
https://www.tradingview.com/chart/gTkSjkj6/
From last week:
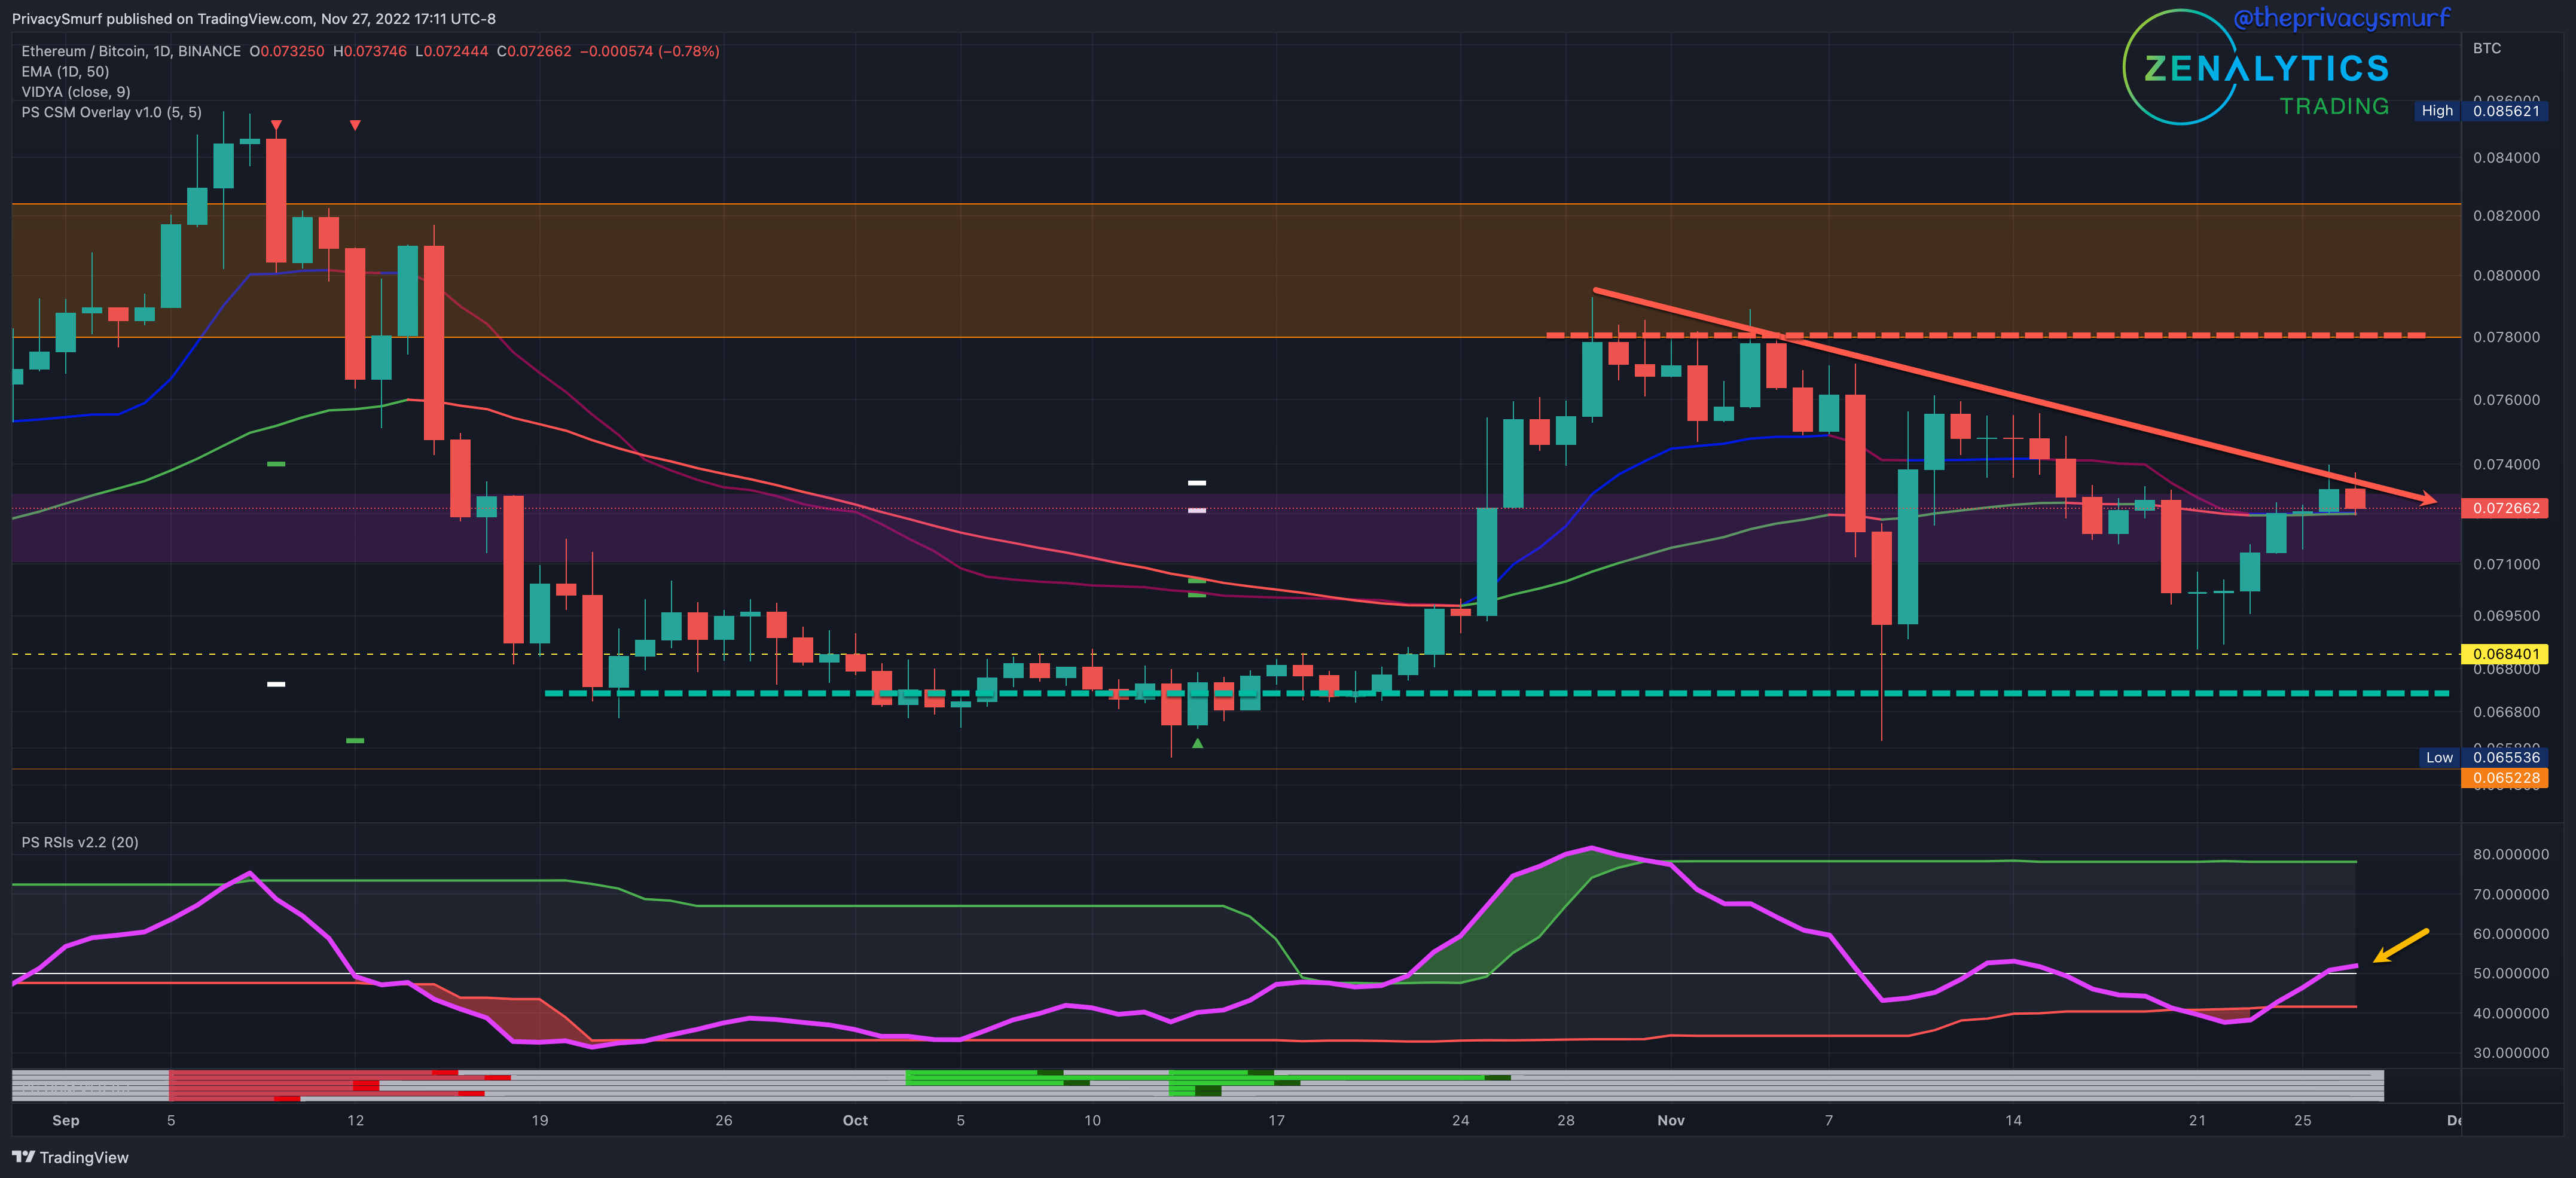
“…trend still very much remains down… big-picture compression pattern.. may lead to a volatile break but that may take some time to materialize… expecting… A test of the low support or wicks below this week…”
There wasn’t much that changed in the ratio of ETH to BTC. The downtrend is largely the same as prices ranged low and back to the descending trendline making a lower high. The big-picture compression pattern drawn with a descending trendline (red arrow) and lower-range support (green dashed line) may see a bullish break and retest due to the RSI placement. The RSI (yellow arrow) is currently teasing a bullish midline break. This would suggest a bullish influence if not rejected from the midline and the descending triangle. It’s something to monitor this week. A bullish break may translate to ETH and alts gaining over BTC. I’d be looking for price charts with a similar overall look as above.
Given the current technicals for the week, I’m expecting more bearishness and compression. However, a bullish break on the RSI and Price charts will be closely monitored for potential intraday breakout trades. There is still no bullish divergence on this timeframe, so I am very hesitant to consider large and/or long-term bullish positions on ETH and alts as the risk is substantial for more downside. I need more confirmation on bullish transitions on lower timeframes to influence that decision. Exposure in bullish positions for ETH and ALTs is still not within my risk tolerance.
ETH/USDT Daily Chart
https://www.tradingview.com/chart/xbB6lkZu/
From last week:
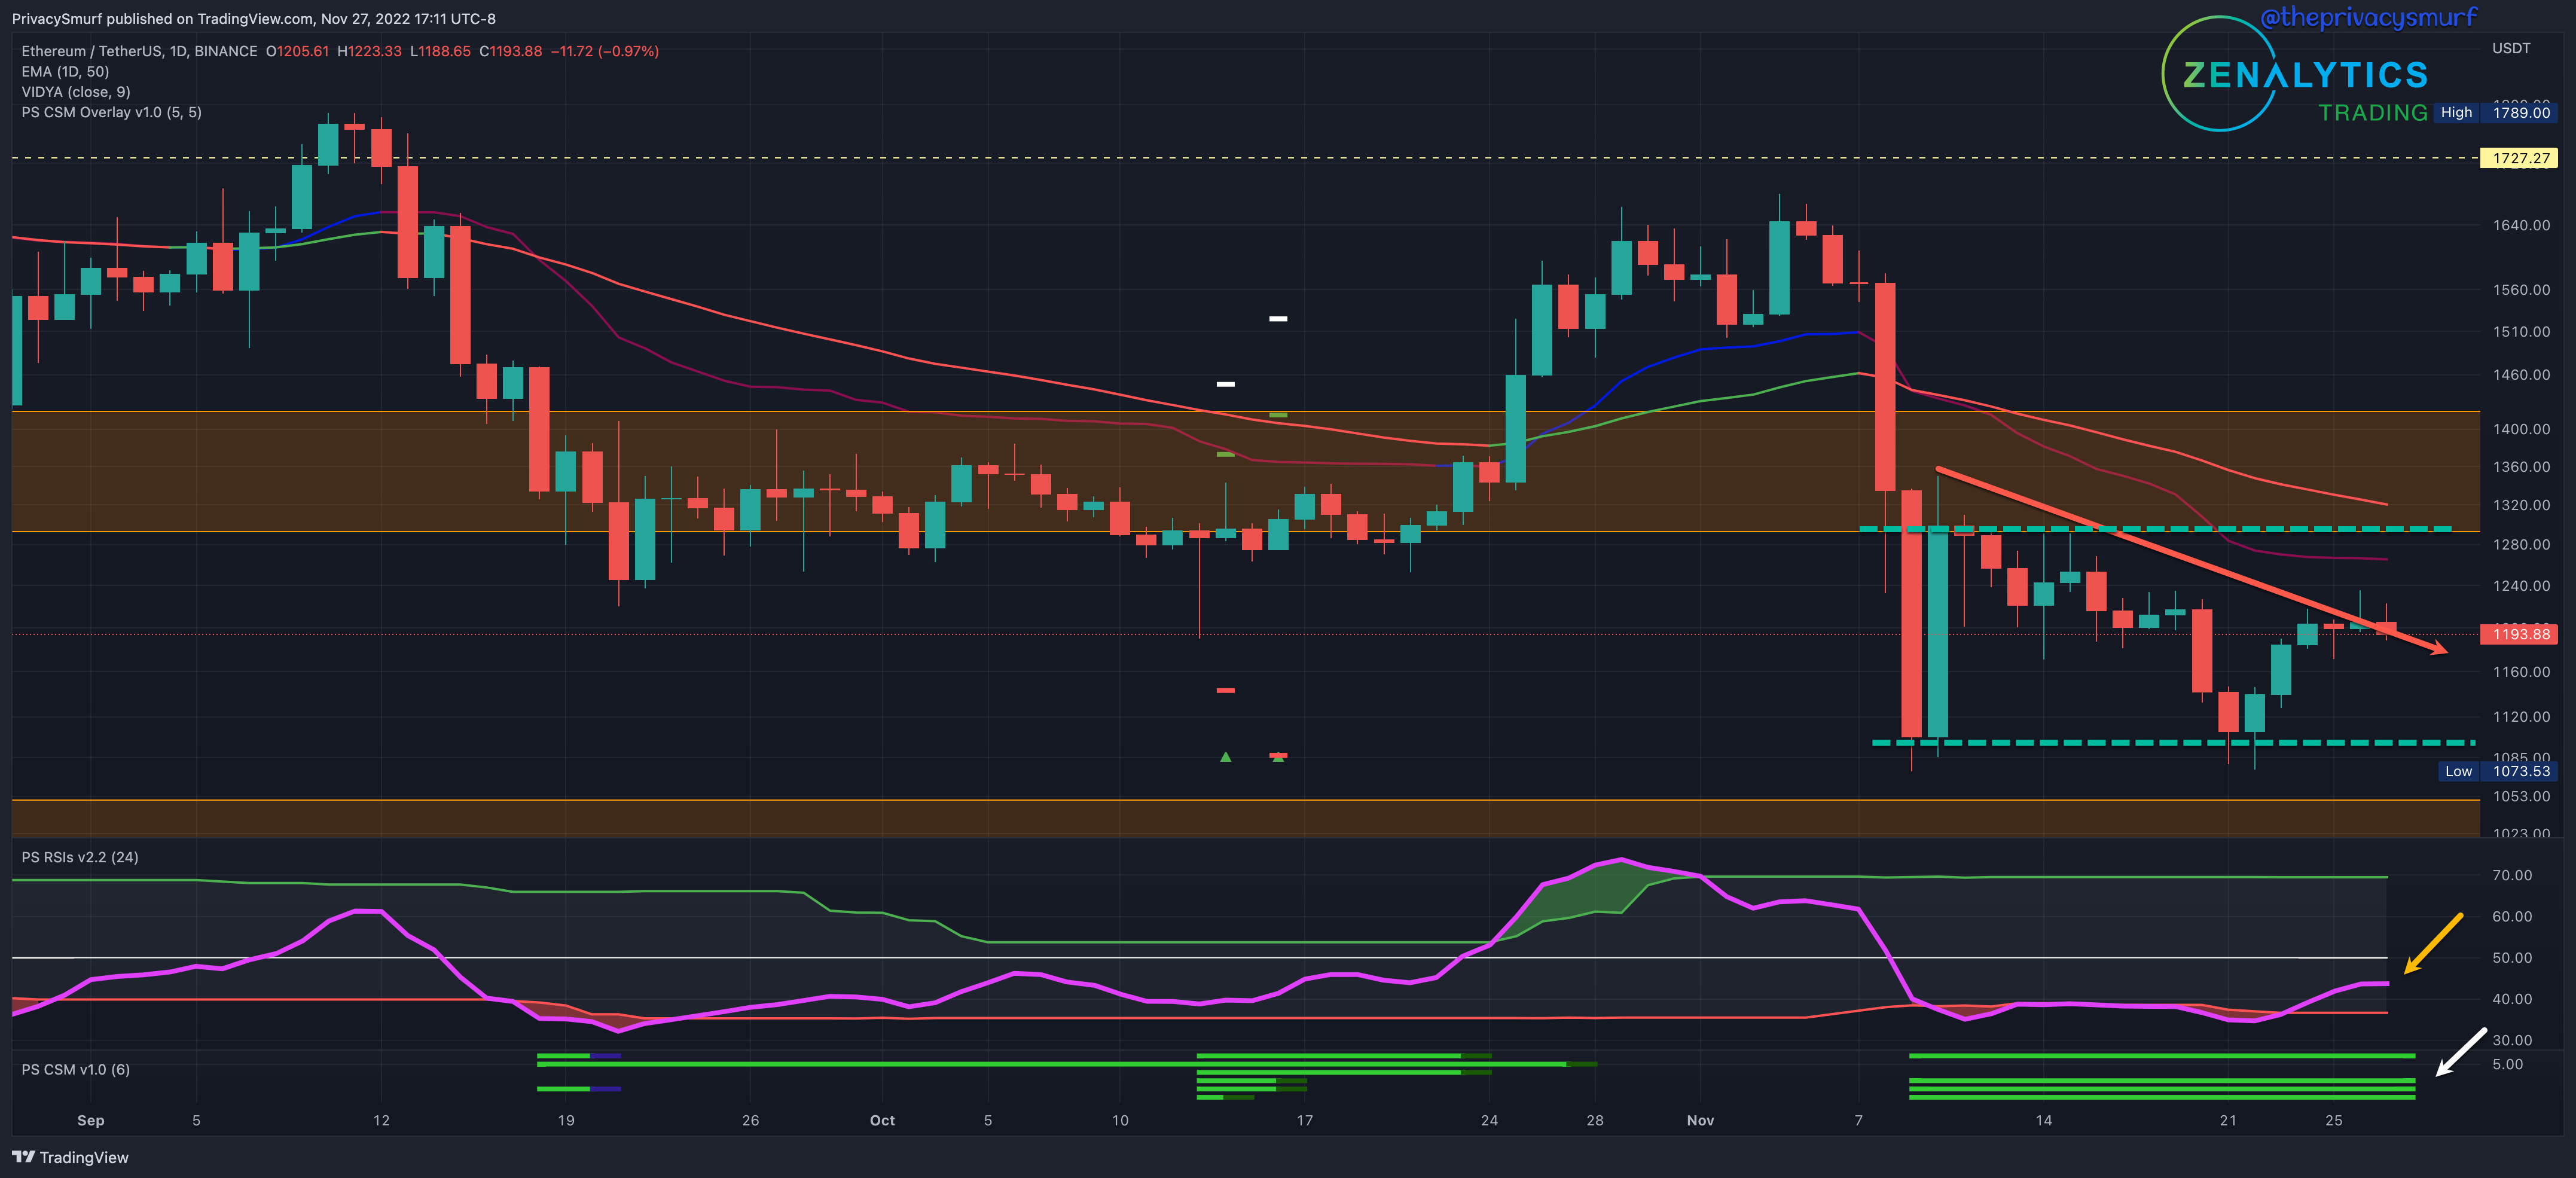
“… I’m expecting ranging values…”
We can repeat much of last week’s analysis as we are pretty much right back where we were. The only difference is a slightly more bullish outlook. The trend still very much remains down. The RSI (yellow arrow) is still below the adaptive bottom band, so the potential for bearish volatility still exists. The Correction Strength Meter (white arrow) still shows a bullish divergence on my custom indicator. This suggests there is an underlying buy bid. Still, it will be important to continue to monitor oscillators if new low measurements appear, as that will invalidate these bullish setups. The same compression pattern exists with a descending trendline (red arrow) and lower-range support (green dashed line). Early in the week may see a bullish break and test. However, with the adaptive bottom band of the RSI nearby, it may lead to whipsaw price action and not a sustained bullish rally out of this compression.
Given the current technicals for the week, I’m expecting ranging values with the potential for some bullish impulsivity. I’m still keeping the wide range of 1050 to 1350 to cover prices for the week, but wicking below support is still possible. My bias this week is still bearish, prioritizing intraday shorts. Still, considering the price is closer to support at the moment, shorts wouldn’t be entertained unless there are daily closes below the support, and I’d look to play the failure of the $1050 level. Intraday bullish divergences may be good, yet risky plays to the long side when the price gets to the support.
I’ll have some more site unlocks this week.
See you then,
@theprivacysmurf