

SS #60: Adventure

Maybe a bit premature, but moving into the late hours of Sunday night, prices are starting to ‘adventure’ into the wild yonder above the trading range we’ve been stuck in for a bit.
Here’s a link to the live-action music video. Kinda silly.
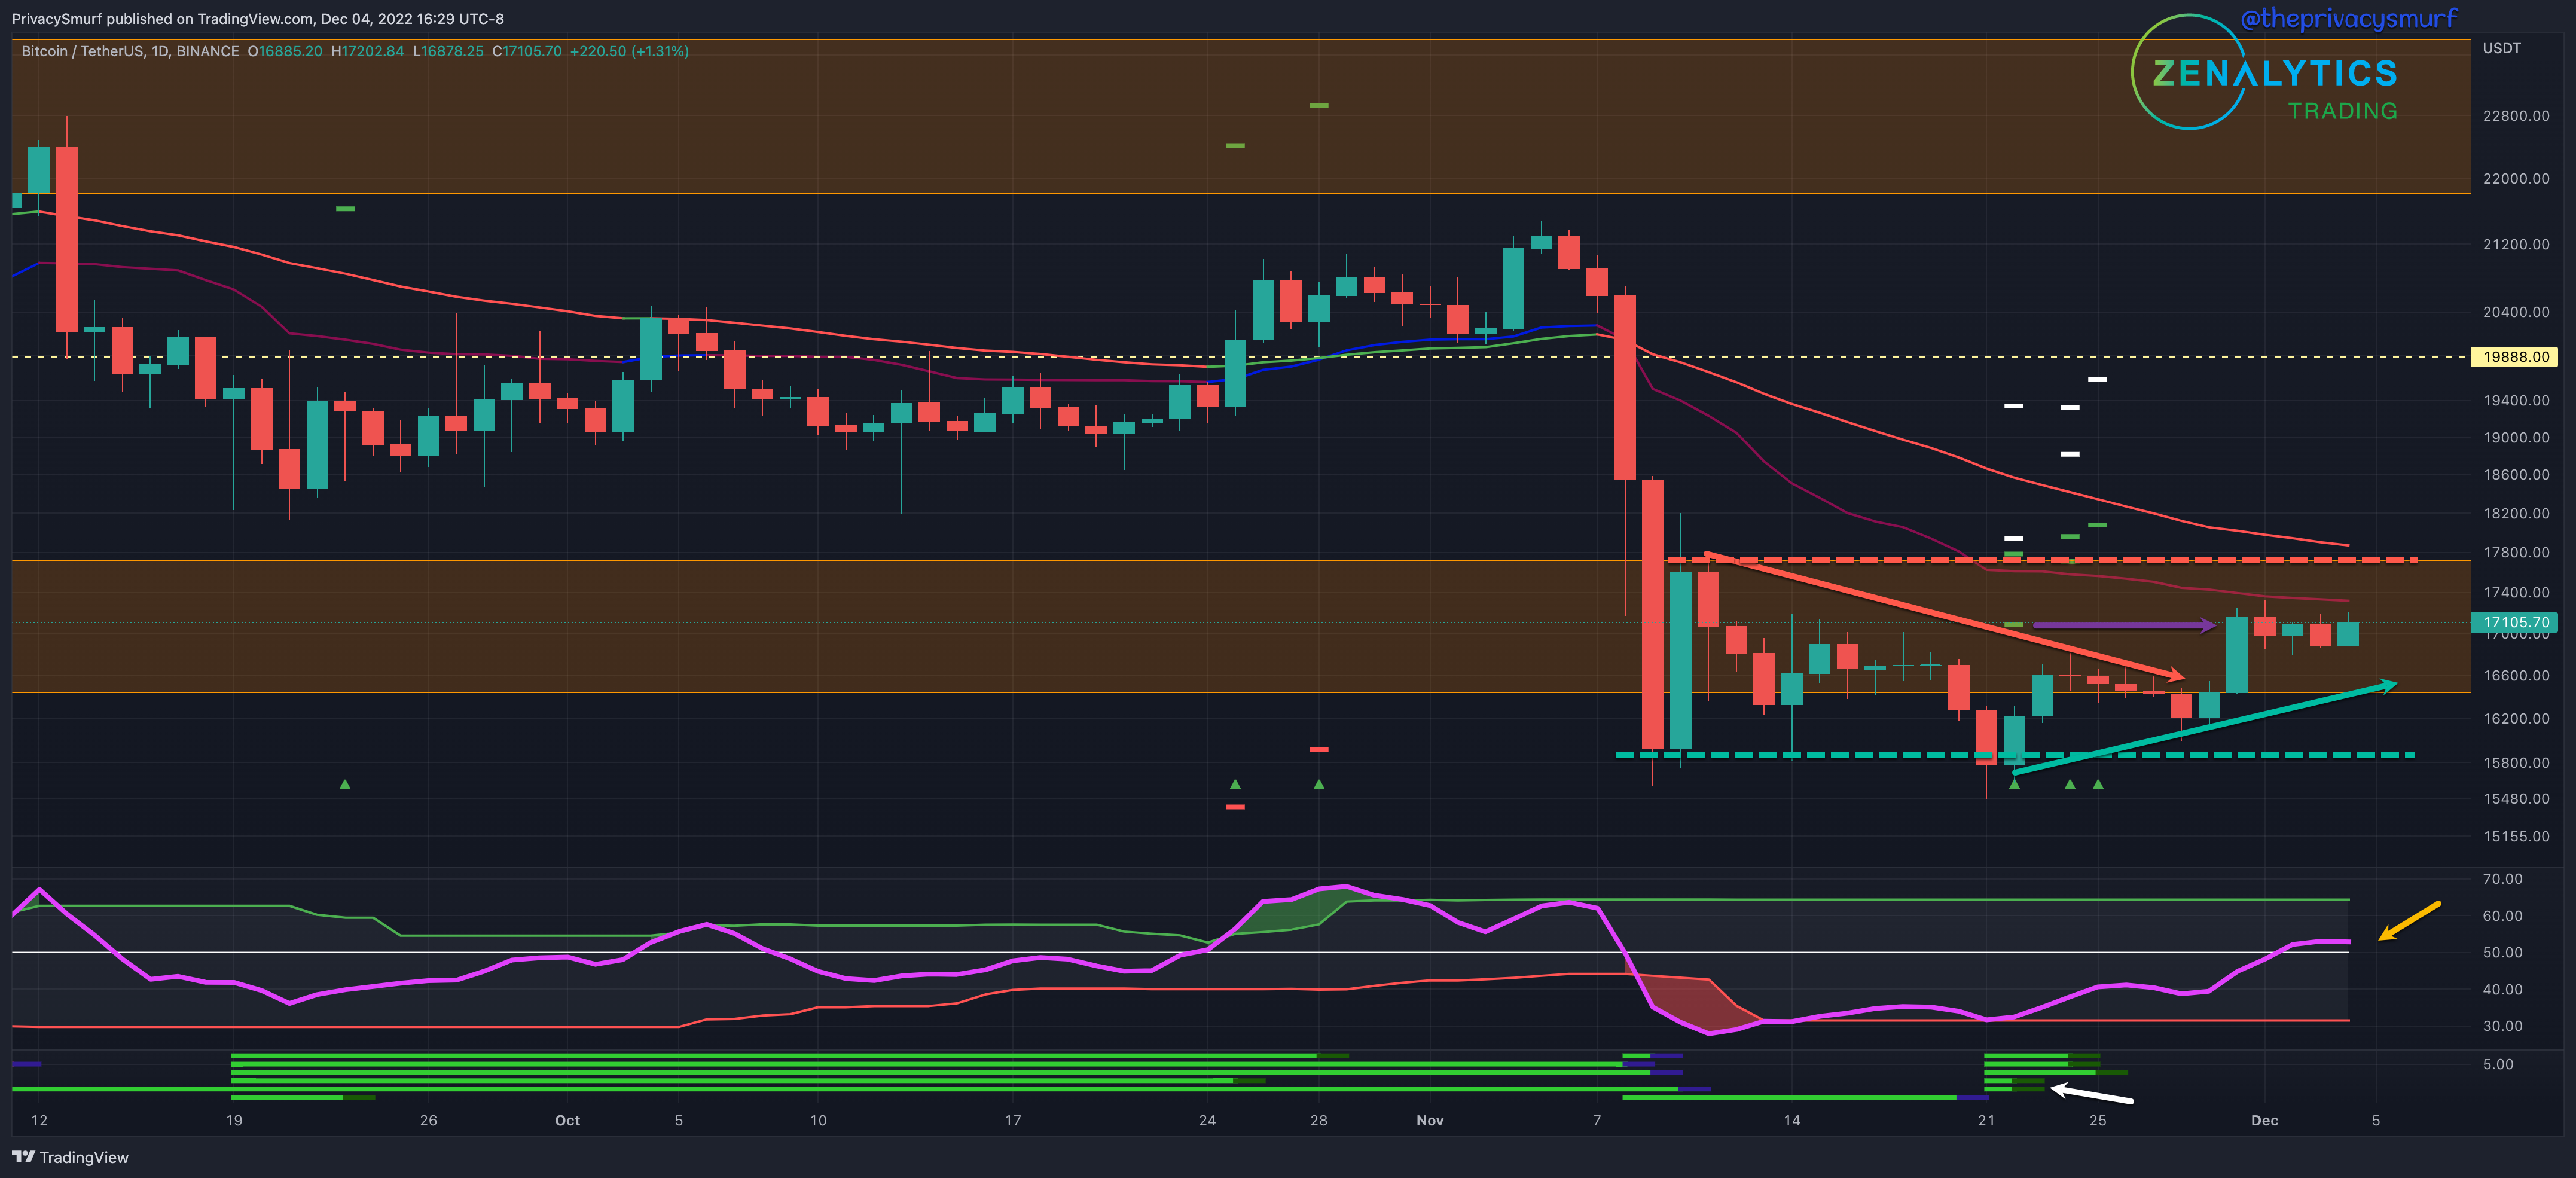
BTC/USDT Daily Chart
https://www.tradingview.com/chart/jjSdFW4b/
From last week:
“…potential for a bullish reversal… initial targets are near the middle of the range… still expect pricing in the $15800 - $17800 range...”
This past week the price compression above support(green dashed line) illustrated by the downward red arrow led to bullish volatility, which met the initial targets (purple arrow) from my custom indicator, the Correction Strength Meter(white arrow). Prices then stalled out, consolidating at that level. The RSI (yellow arrow) also broke above the midline, suggesting a bullish influence on prices. Retesting the RSI to the midline may coincide with a new higher low and a continuation of the ascending green arrow trendline. Failure of the RSI to hold the midline and I would expect the price structure to break down and revisit the low support again.
Given the week's current technicals, I still expect pricing in the $15800 - $17800 range. The 50-Day EMA is now measuring just above the $17800 ceiling, and I expect that to offer a level of resistance. My bias this week is neutral to bullish since we have set a new series of higher highs and higher lows. Ideally, I’ll look to take a long at a retest of the $16.6 - $16.8k level. I will watch for signs of failure and bearish divergences at the high end of the range on intraday charts to cut out short-term longs. In the event of structure breakdown intraday, bullish divergences at the low end near $15800 will still be on my mind to take risky plays to the long side.
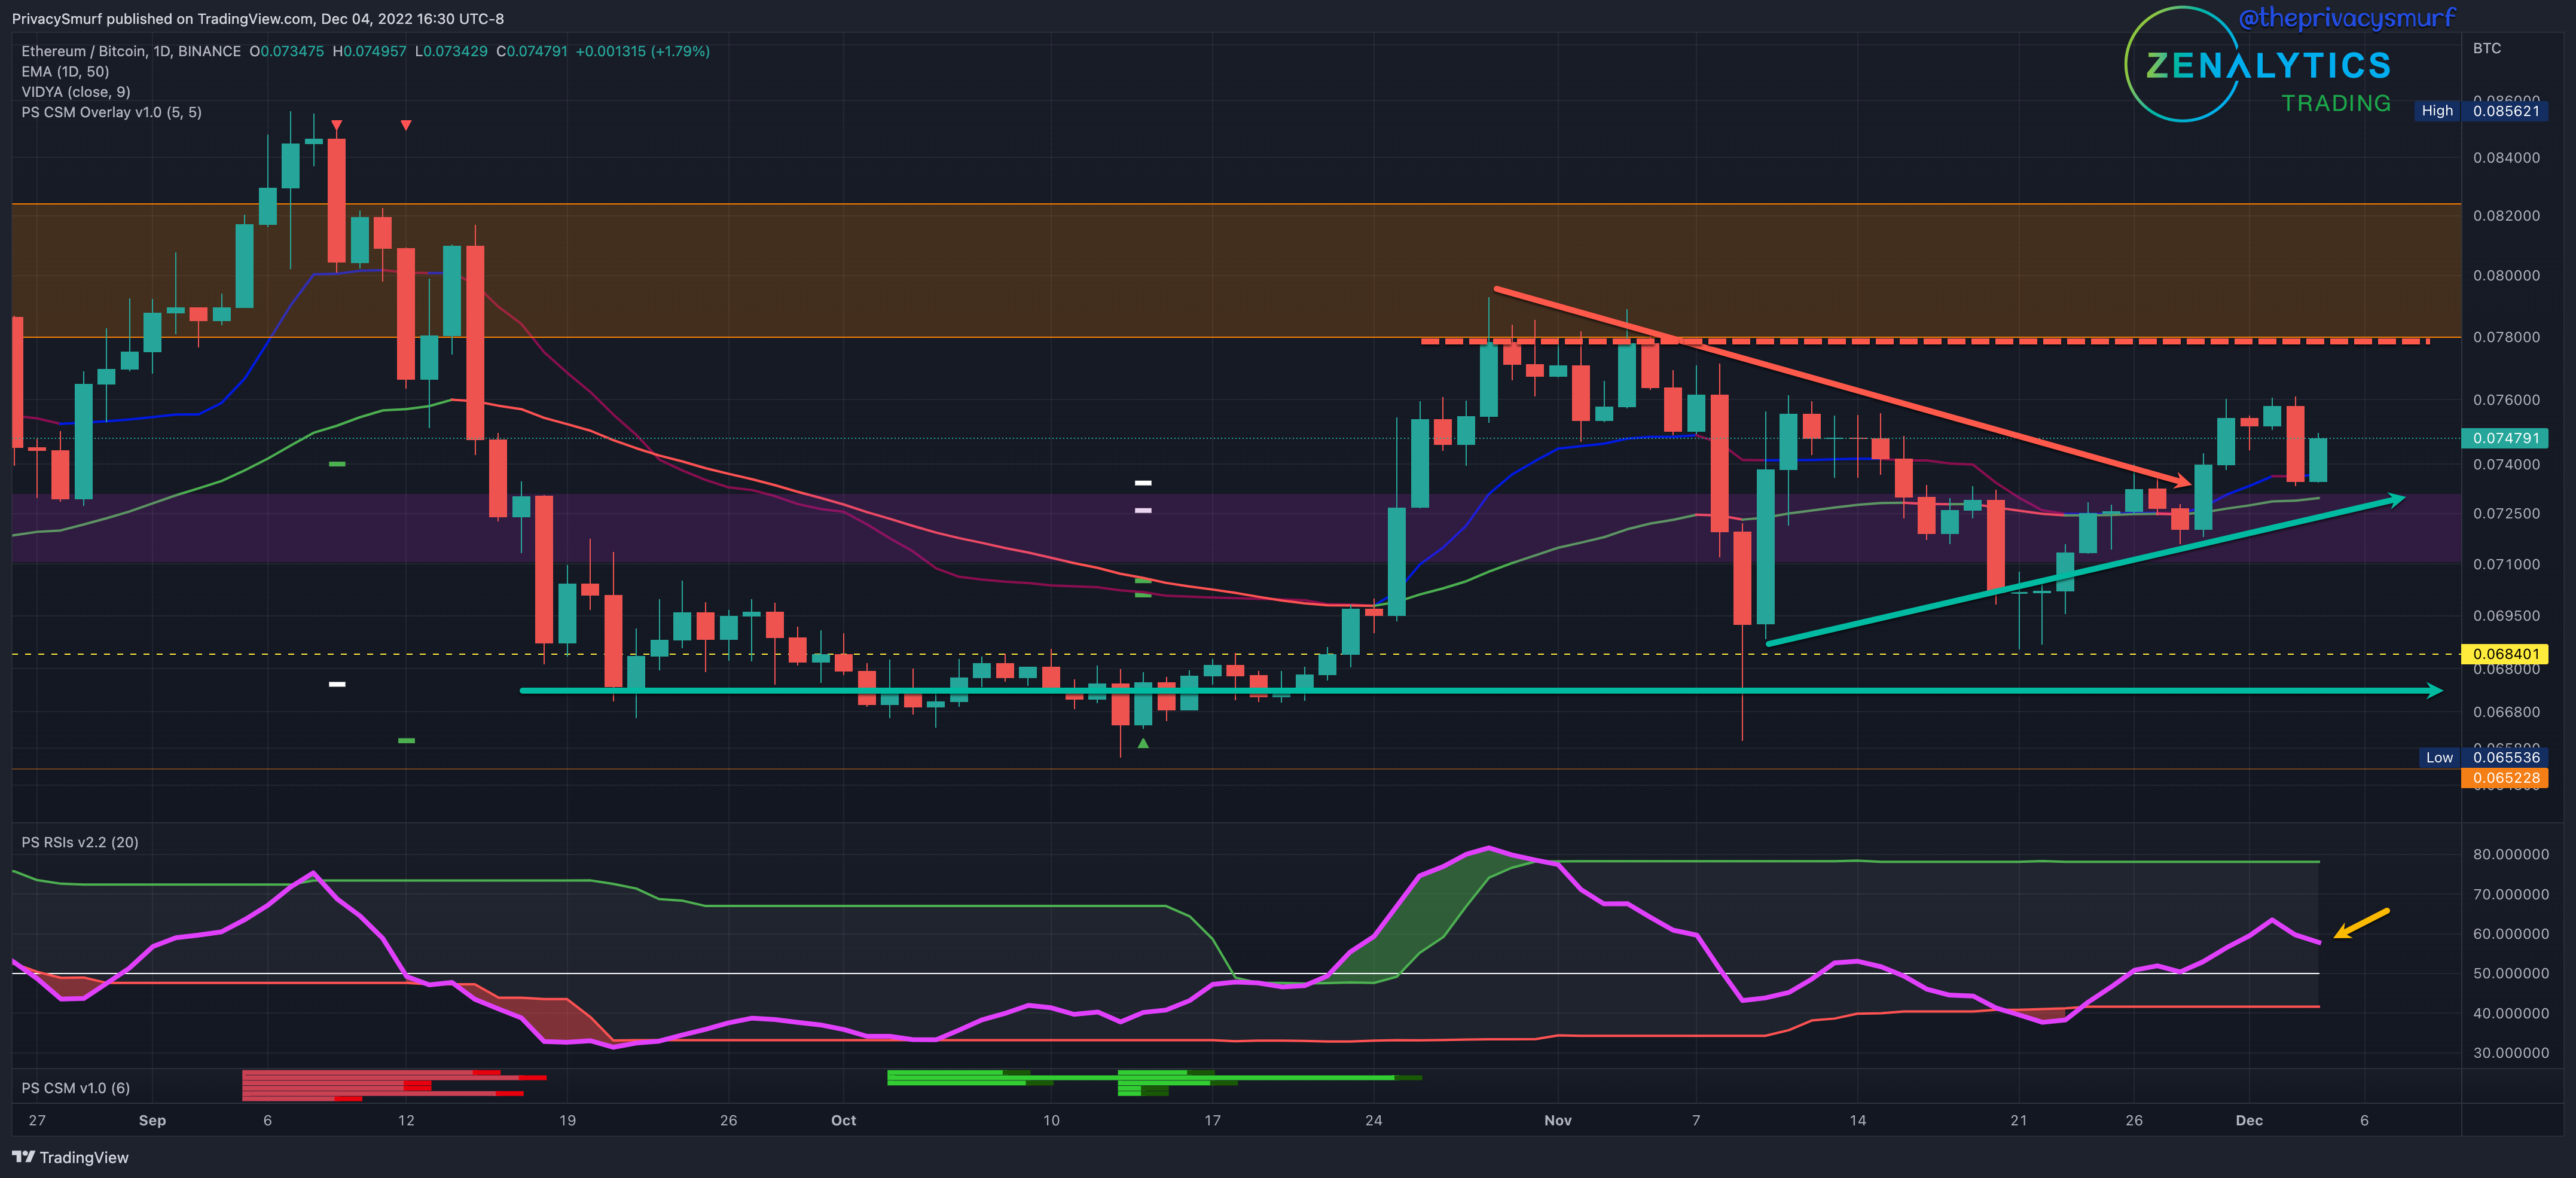
ETH/BTC Daily Chart
https://www.tradingview.com/chart/gTkSjkj6/
From last week:
“…big-picture compression pattern drawn… may see a bullish break and retest… expecting more bearishness and compression… a bullish break on the RSI and Price charts will be closely monitored...”
The big-picture compression pattern drawn with a descending trendline (red arrow) and lower-range support (green dashed line) broke out this past week. The RSI (yellow arrow) is currently measuring above the midline, suggesting a bullish influence on prices. Retesting the RSI to the midline may coincide with a new higher low and a continuation of the ascending green arrow trendline. Failure of the RSI to hold the midline, I would expect the price structure to break down and revisit a prior higher low. The pattern of higher lows illustrated by the ascending green arrow has continued and now has the additional support of the 50-Day EMA.
Given the current technicals for the week, I’m expecting further bullishness. I’ll look for charts that present the possibility of bullish breakouts for short-term bullish trades. Ideally, I’d buy an entry on a retest of the 50-Day EMA or, less ideally, a breakout above the 0.078 level. It is important to monitor for bearish divergences on intraday timeframes (2HR and under) when prices are approaching breakouts. These divergences will signal if resistances may hold or not. Until we are above the 0.078 level, I am hesitant to consider large and/or long-term bullish positions on ETH and alts. Exposure in short-term bullish positions is tolerable as long as the structure of higher highs and higher lows is maintained.
ETH/USDT Daily Chart
https://www.tradingview.com/chart/xbB6lkZu/

From last week:
“…slightly more bullish outlook… Early in the week may see a bullish break and test… I’m expecting ranging values with the potential for some bullish impulsivity. I’m still keeping the wide range of 1050 to 1350…”
We can repeat much of last week’s analysis, except it’s upside down.

The trend is now up as we have a new series of higher highs and higher lows. The RSI (yellow arrow) is above the midline suggesting a bullish influence on prices. The Correction Strength Meter (white arrow) still shows a bullish divergence on my custom indicator. Conditions for a larger and longer bullish reversal exist. The opposite compression pattern from last week now exists with an ascending trendline (green arrow) and higher-range resistance (red dashed line). Early in the week may see a bullish break and test. Monitoring intraday charts (2HR and under) will be important to give some impressions on whether resistance may hold. On a bullish break, I’d anticipate resistance to come in again around $1450 - $1500.
Given the current technicals for the week, I’m expecting more compression with the potential for some bullish impulsivity. I would expect a price range of around $1150 - $1350. My bias this week is bullish as we have established a series of higher highs and higher lows. Intraday breakouts without bearish divergence may be good plays to the long side with close-stop losses under the most recent lows. These breakouts carry high risk as we are at the top of the local range, but they offer a greater upside reward.
If intraday bearish divergences still exist during the brief ventures over resistances, the breakout failures and subsequent breakdowns from the most recent supports alternatively offer decent short-side trade opportunities.
@theprivacysmurf
interesting forecast, let's see what happens this week. At times the market seems unpredictable