

SS# 62: Eternal Light
SS# 62: Eternal Light
No, bad vibes can't stop this good vibration.

This post series is live on the new site.
https://zenalytics.info
If you haven’t registered as a free community member, please do so so you can get your membership perks as a current substack subscriber. Details are in the video below.
It feels like bad news comes after more bad news but don’t let it get you down and snuff out your positive light. All will be what it will be. Just make sure no positions you are in will wreck you, I’ll give you the analysis, and we can “keep it blazin’ baby.”
Side note, I love Tiny Desk. Best music series on youtube, IMO.
BTC/USDT Daily Chart
https://www.tradingview.com/chart/jjSdFW4b/

From last week:
“…I anticipate wicks above the 50-Day EMA... look to take more short-term longs on a retest of the $16.6 - $16.8k level…”
Quite a tempestuous week. In the middle of the week, prices spiked above the 50-Day EMA with intraday timeframe bearish divergences. This led to a retracement and eventual breakdown from the ascending trend line. The prices stabilized at the suggested 16.6k level; however, the RSI (white arrow) fell below the midline, suggesting a bearish influence on prices. I’d hesitate to enter new short-term longs at this moment from this level. An entry from the lower portion of the range would be ideal.
Given the week's current technicals, I still expect pricing in the $15800 - $17800 range. This would appear to be our trading range for a while longer. My bias this week is neutral to bearish since we have set a new lower low and have closed below prior support. Bullish divergences at the low end near $15800 will still be on my mind to take risky plays to the long side. At current levels, it’s better to wait to see how the price moves over the next few days, as there are arguments to be made equally in both directions.
ETH/BTC Daily Chart
https://www.tradingview.com/chart/gTkSjkj6/
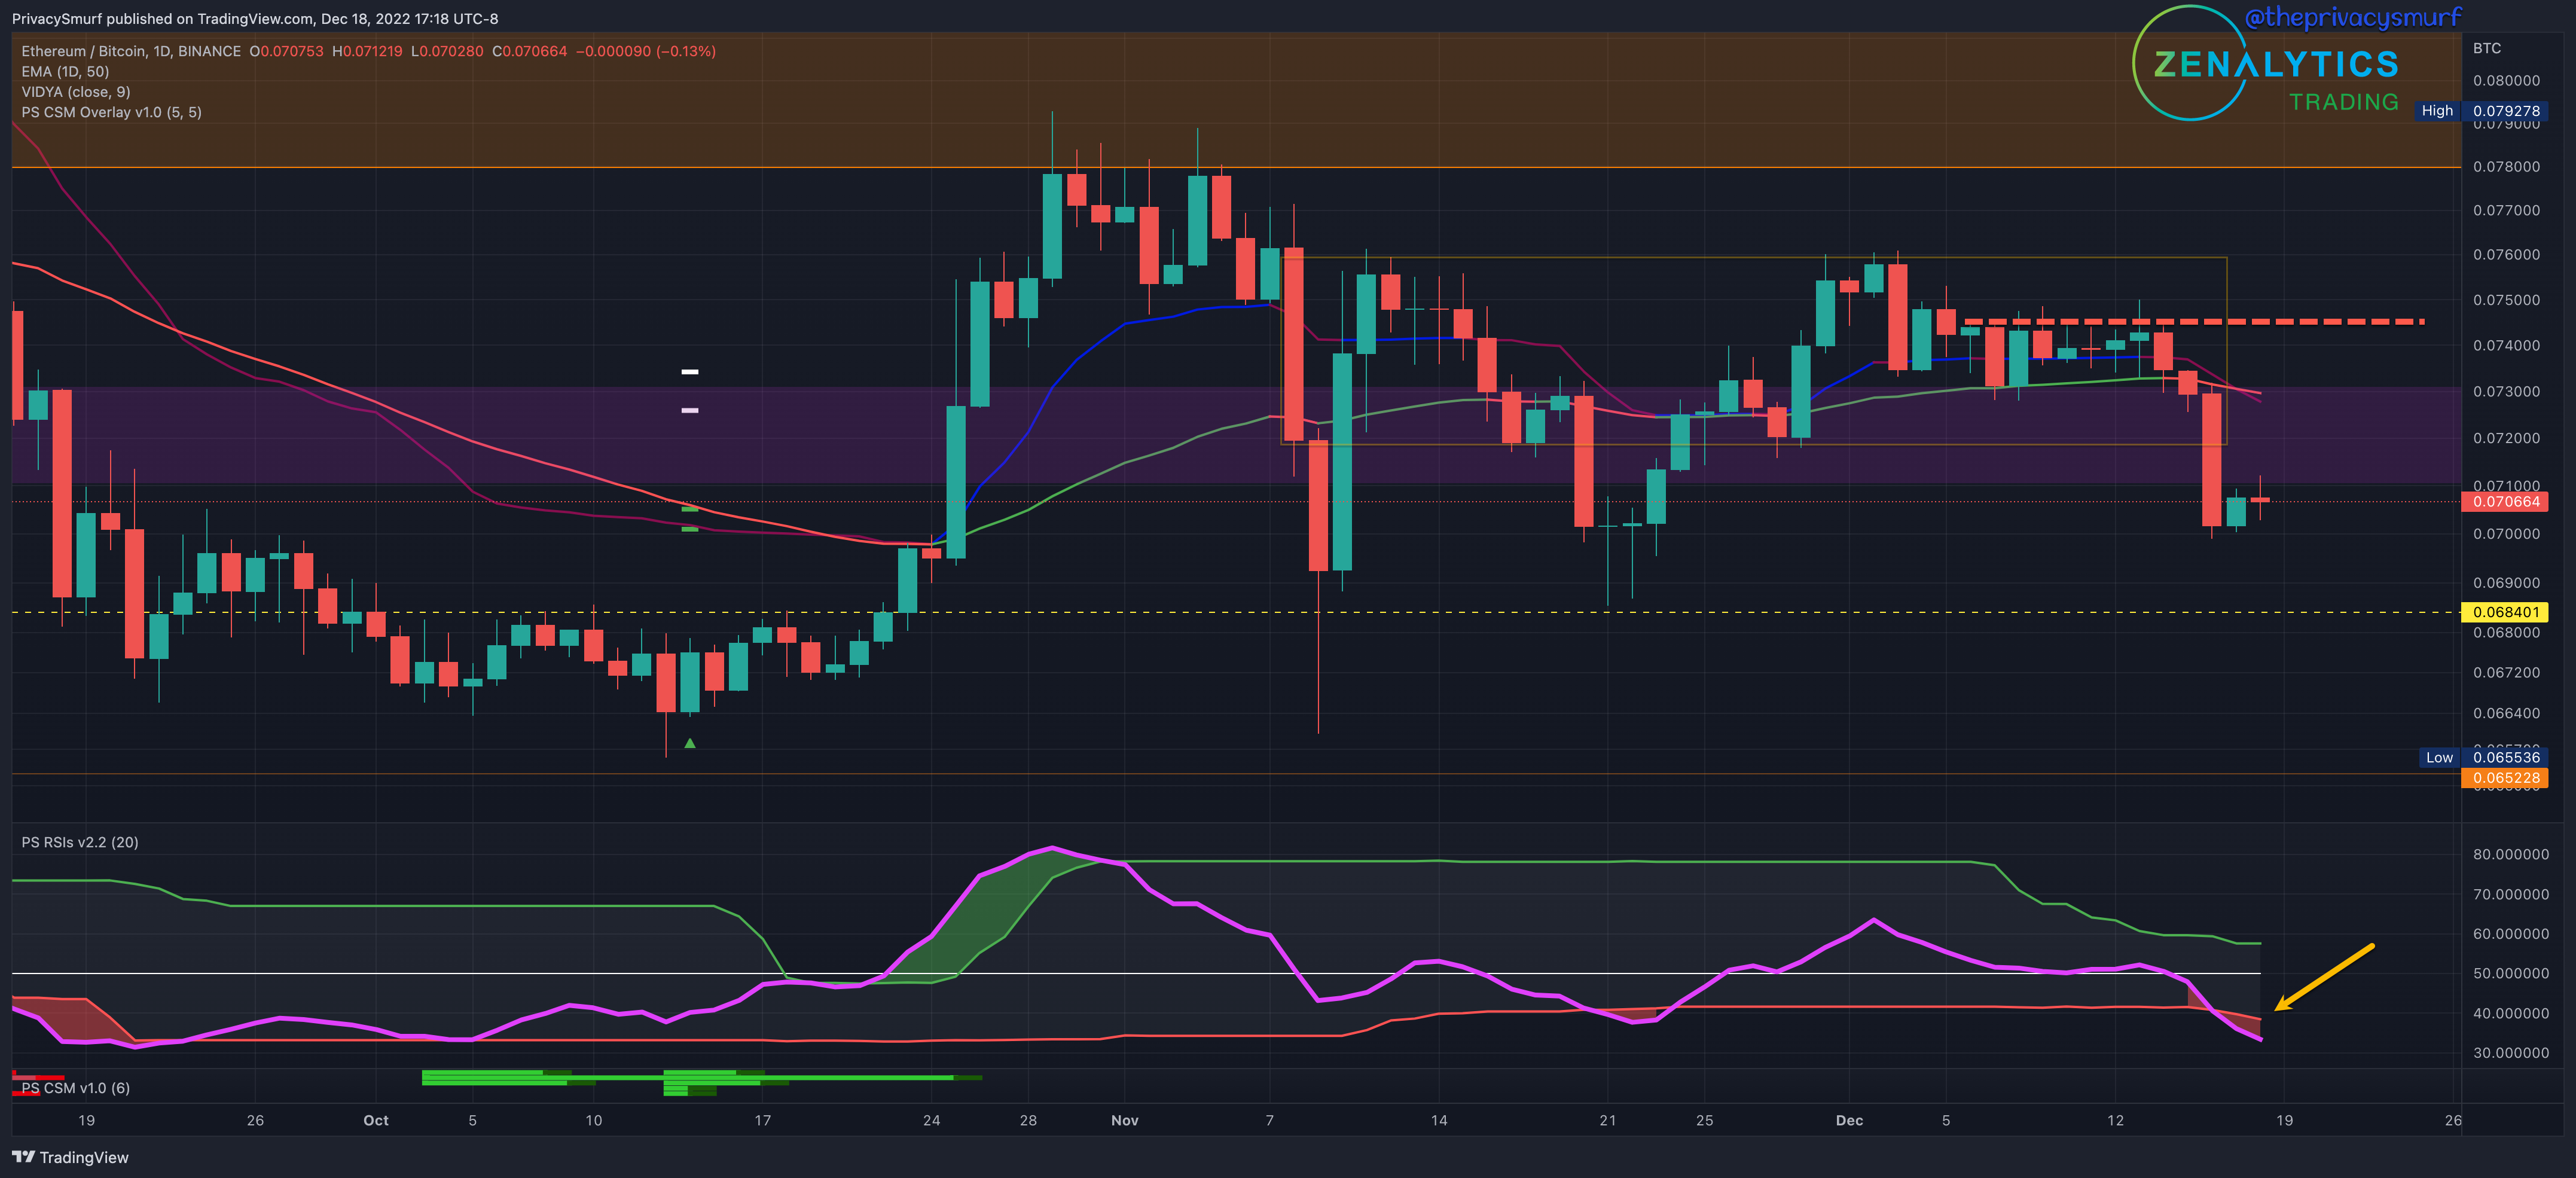
From last week:
“…I’m not looking to make decisions until the values get to the top or bottom of the box... monitor for bearish divergences on intraday timeframes (2HR and under) when prices are approaching breakouts or retesting the 50-Day EMA…”
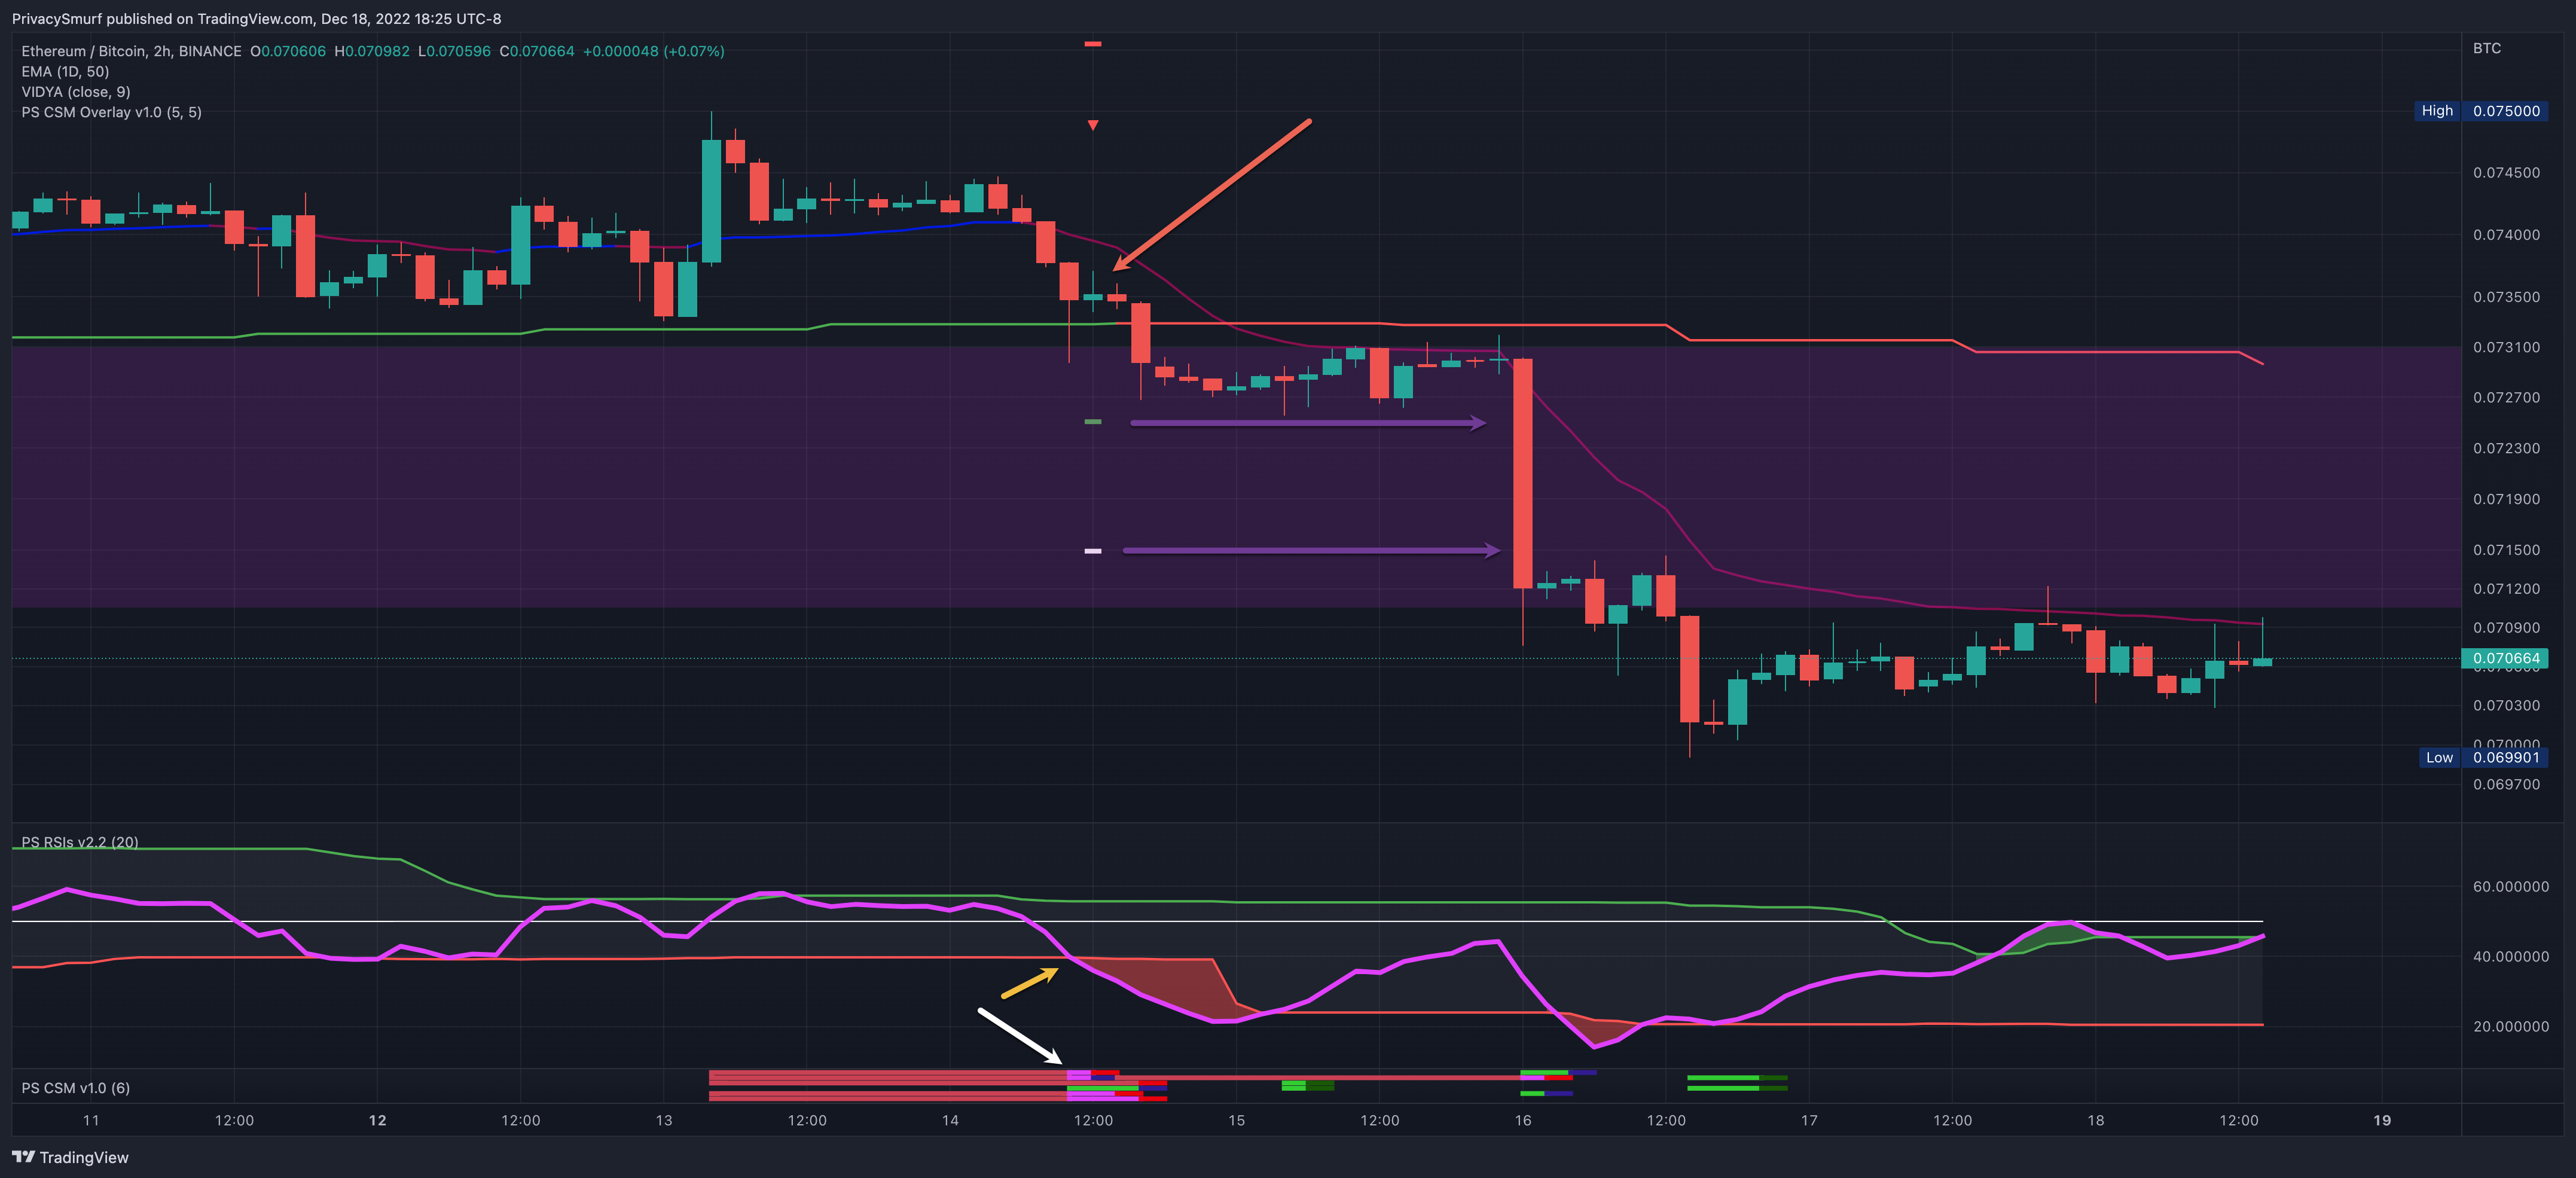
Patience paid off, intraday timeframes signaled the correct moves as suggested, and prices fell out of the shaded box from last week. The RSI (yellow arrow) broke down below the adaptive bottom band, typically accompanied by bearish impulsive price action. The 2HR chart pictured below shows the test of the 50-Day EMA. The RSI also showed the bearish break of the adaptive bottom band. My custom indicator, the Correction Strength Meter (white arrow), which identifies potential reversals, signaled the conditions for a bearish move and plotted the entry candle (red arrow) and targets (purple arrows) which were both reached.
Given the current technicals for the week, I’m not looking to make decisions. At current levels, it’s better to wait to see how the price moves over the next few days, as arguments could be made equally in both directions. I’ll wait for the RSI to move back inside the bands before I expect prices to stabilize. It’s possible we visit lower levels. In the event of lower lows, it’s not good to be exposed to ETH and altcoins. There is support at the 0.0684 level. Intraday charts (2HR and under) will be able to signal a potentially risky bullish entry before the daily chart builds out a higher high.
ETH/USDT Daily Chart
https://www.tradingview.com/chart/xbB6lkZu/
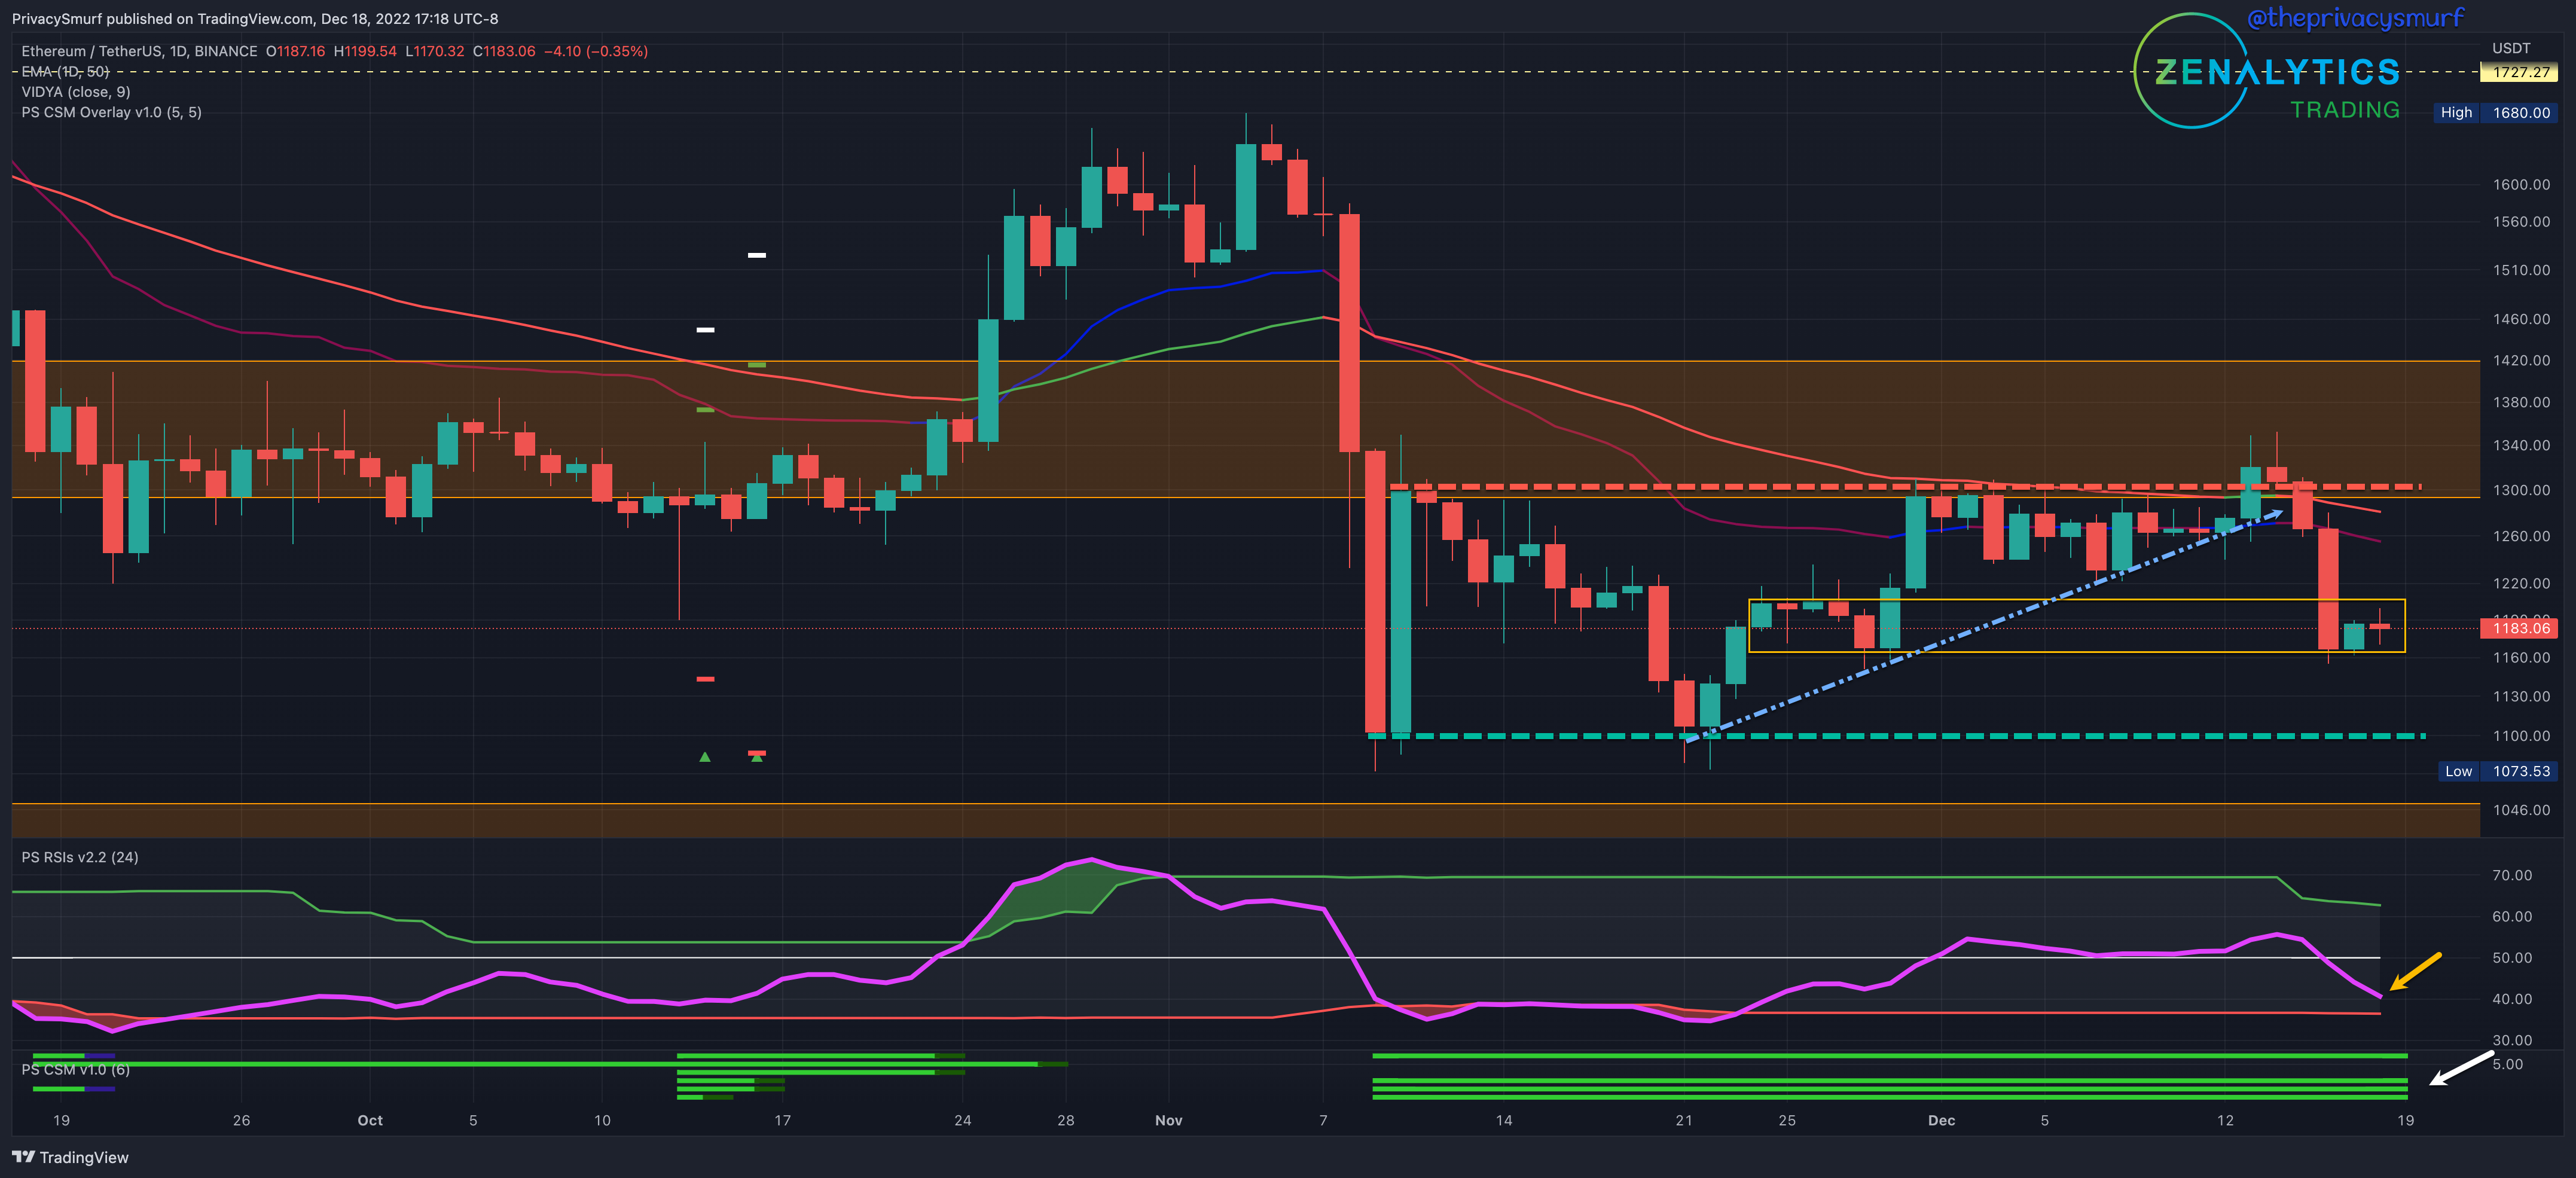
From last week:
“…expect a price range of around $1150 - $1350. …expecting volatility with whipsaw price action… looking for entries to the long side inside the yellow box…”
It’s always nice when things play out perfectly to expectations. In the early part of the week, we saw a spike above the range high and a swift drop down to the prior structure support box. With the RSI (yellow arrow) broken below the midline and the ETH/BTC chart not pointing to defined directionality, I’m a bit more hesitant to take a short-term long here. It’s a risky proposition, but if intraday charts show a bullish signal that I choose to take, I’d be looking to exit if the lower part of the yellow box is penetrated. The Correction Strength Meter (white arrow) still shows the potential for a bullish reversal, but no trading signal has shown up yet.
Given the current technicals for the week, I’m expecting ranging prices around $1100 - $1260. My bias this week is SLIGHTLY bearish. Ideally, there will be a high and a higher low on the daily chart over the week. The higher low, maybe testing the yellow box again, would be a comfortable short-term long for my trading styles. Alternatively, a test of the high range with bearish divergences on intraday charts will be an ideal bearish trade.
One side note, if you are a paid subscriber here, once you register with the new site, be sure to cancel your current paid subscription on substack. Everything will be managed in the future on the new site. Once you register, I’ll reach out to you via email to complete the transition. Thanks for your patience during the shift.
@theprivacysmurf