

SS #64: Road Song

Last Sunday newsletter, I warned impulsivity was on the horizon. Bitcoin Bulls hopped in the car, hit the road, ran over the bears, and never looked back.
BTC/USDT Daily Chart
https://www.tradingview.com/chart/jjSdFW4b/
From last week:
No posting last week due to burning my hand, which now looks like leather on the backside, but at least it doesn’t hurt anymore. Here’s a snipped from the 2023 Q1 Forecast. ”… Bullish alignment with the daily cycle in mid January will lead me to look for signals for potentially another bear market rally…”
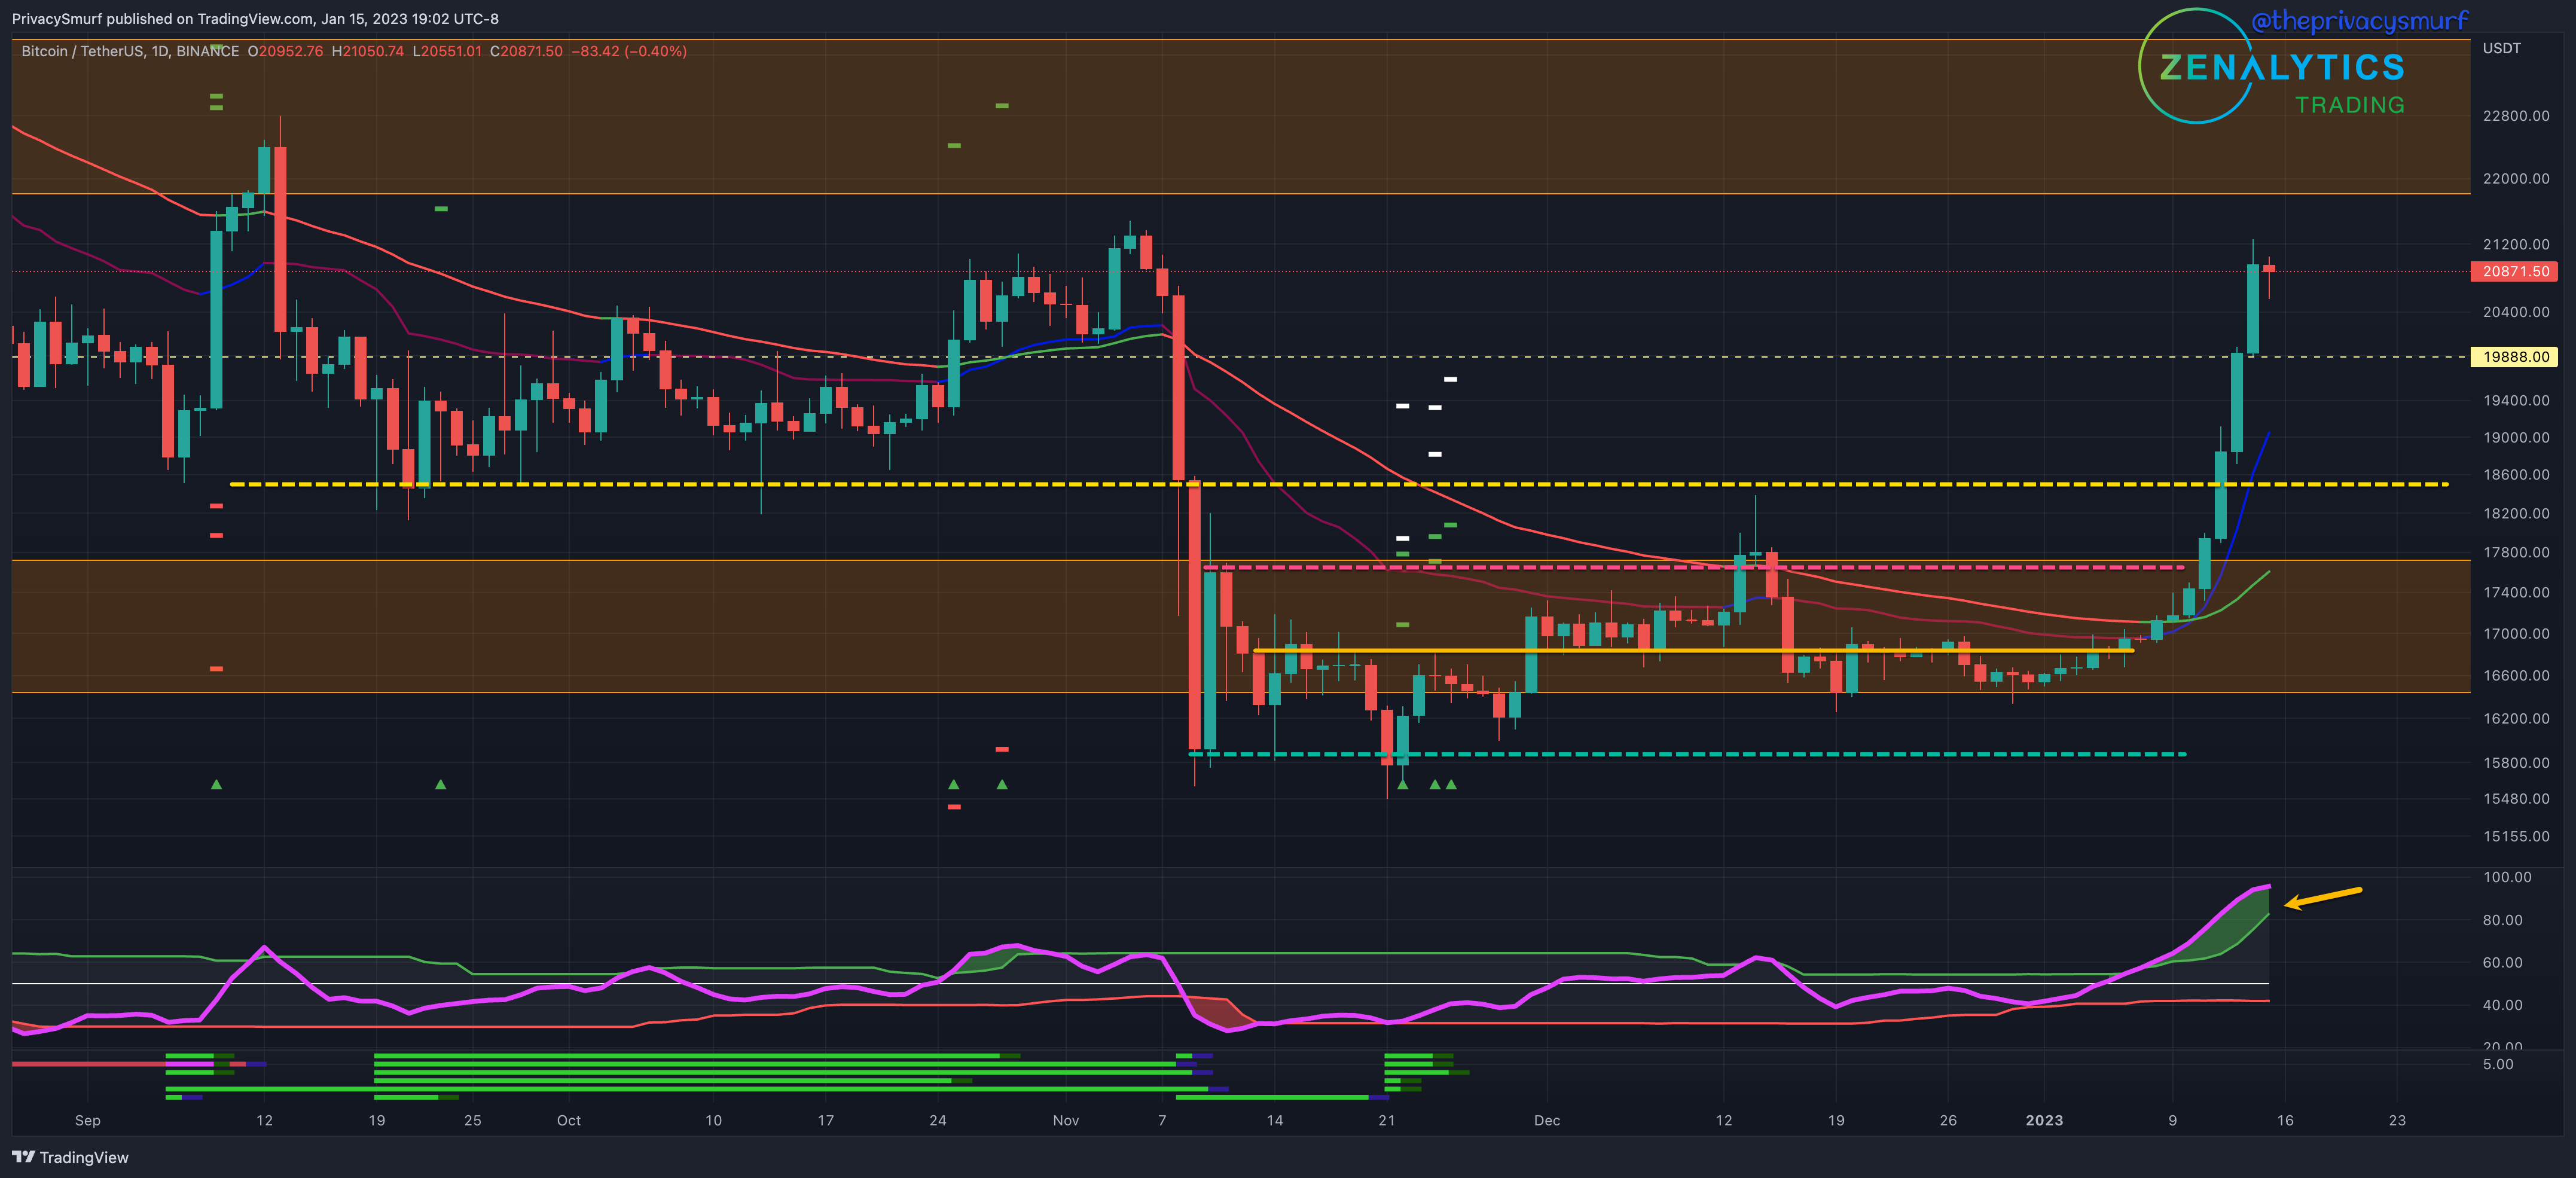
We’ve witnessed a dramatic shift in the daily market picture. The Cyclic Relative Strength Index oscillator (yellow arrow) from the last posting never managed to break below the bottom band and steadily rose up, breaking through the adaptive top band. The impulsive upwards price action followed. The 50-Day EMA and Variable Index Dynamic Average offered little resistance as the price rocketed through the prior range highs (red dashed line). I have drawn a horizontal yellow line at around $18600 to mark potential historical support. With the RSI still measuring above the top band, I’d not expect a deeper retracement to come until it curves back down in between the bands.
Given the week's current technicals, I would increase the ranges to pricing between $18500 - $23000 range. My bias this week is bullish, with a word of caution. This is due to the RSI’s presentation and the fact that prices have pushed higher with little retracement. Ideally, BTC consolidates above $20000 for a time and continues with a new breakout higher. Lower timeframe (around 2hr) for bullish divergences would be how I’d time getting back into the bullish trend. Also buying breakouts with a tight stop loss is also a high-risk high-reward option.
ETH/BTC Daily Chart
https://www.tradingview.com/chart/gTkSjkj6/
From last week:
No posting last week due to burning my hand, which now looks like leather on the backside, but at least it doesn’t hurt anymore. Here’s a snippet from the last post though. ”… I’m looking for potential, yet risky, breakout long plays on ETH and altcoins ONLY if the RSI matches with a bullish break of the midline… may be shifting to a more bullish presentation…”
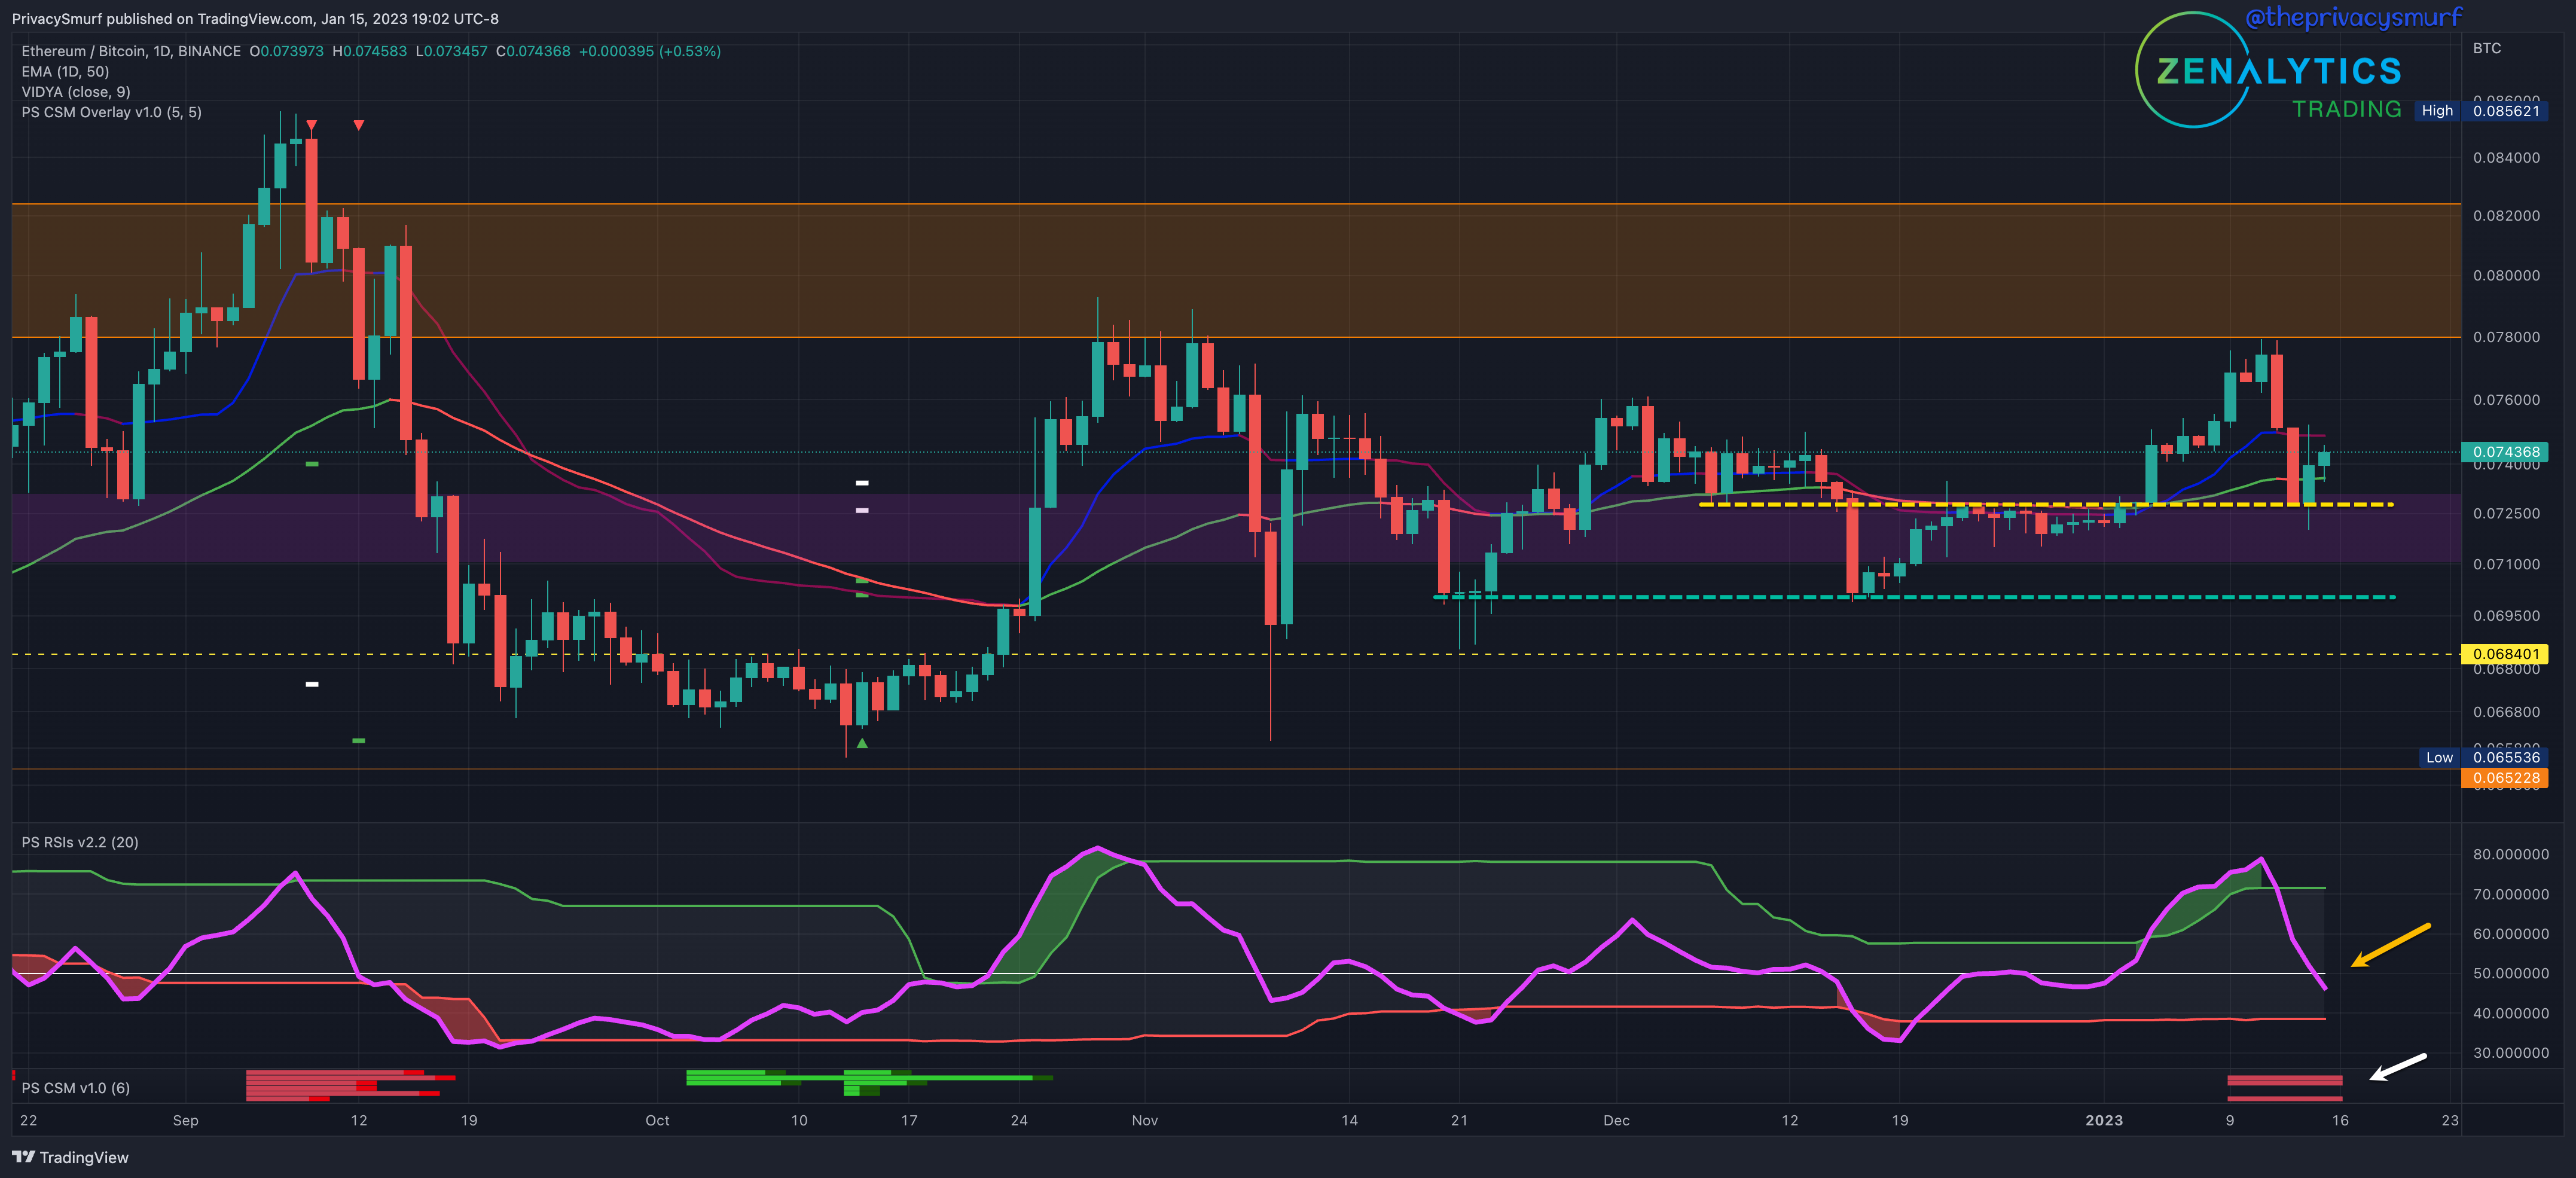
Breakouts were indeed on the menu. The RSI broke above the top band simultaneously as short-term support. Many coins provided breakout trade opportunities as they shifted from a bearish to a bullish structure. In a new small account, I have begun spot trading a breakout strategy that I intend to bring to a copy trading program for folks to follow. Below are all the positions I traded when they broke into bullish structure. Take note that the bulk of the trade execution ramped up in line with the ETH/BTC chart’s bullish break of resistance around the 8th after it started setting higher closes.

Back to the chart, the prior resistance zone continued to hold back a further rally, and a retracement to the broken level occurred. Currently, the RSI is testing below the midline (yellow arrow), and the Correction Strength Meter (white arrow) is plotting red, showing the potential for a bearish retracement, but no trading signal has been printed yet.
Given the current technicals for the week, I’m tightening stops on my open trades. If the RSI continues down, the price would likely follow on ETH and alts, and I’d close out of positions in profit. Any position that hadn’t hit targets I’d close before going negative (or further negative for already underwater trades). My bias this week is bullish, with a word of caution. This is due to the RSI’s presentation. Ideally, the RSI returns back above the midline, and the chart oscillates between the .073 and .078 levels providing multiple opportunities to range trade on alts that have established distinct support and resistance ranges. This is ideal because it would allow the market to build volume back up for another big run. If a bearish CSM trigger appears, I would anticipate a deeper retracement, watch for potential support at 0.071, and close out of alt positions on failure.
ETH/USDT Daily Chart
https://www.tradingview.com/chart/xbB6lkZu/
From last week:
No posting last week due to burning my hand, which now looks like leather on the backside, but at least it doesn’t hurt anymore. Here’s a snippet from the last post though. “…$1190 could be a springboard for a bullish trend if prices can close above $1228… conditions are starting to appear to suggest a short-term bullish shift. Ideally, the RSI will break the midline... start watching for long breakout trades and retracements to support short-term bullish swing trades.…”
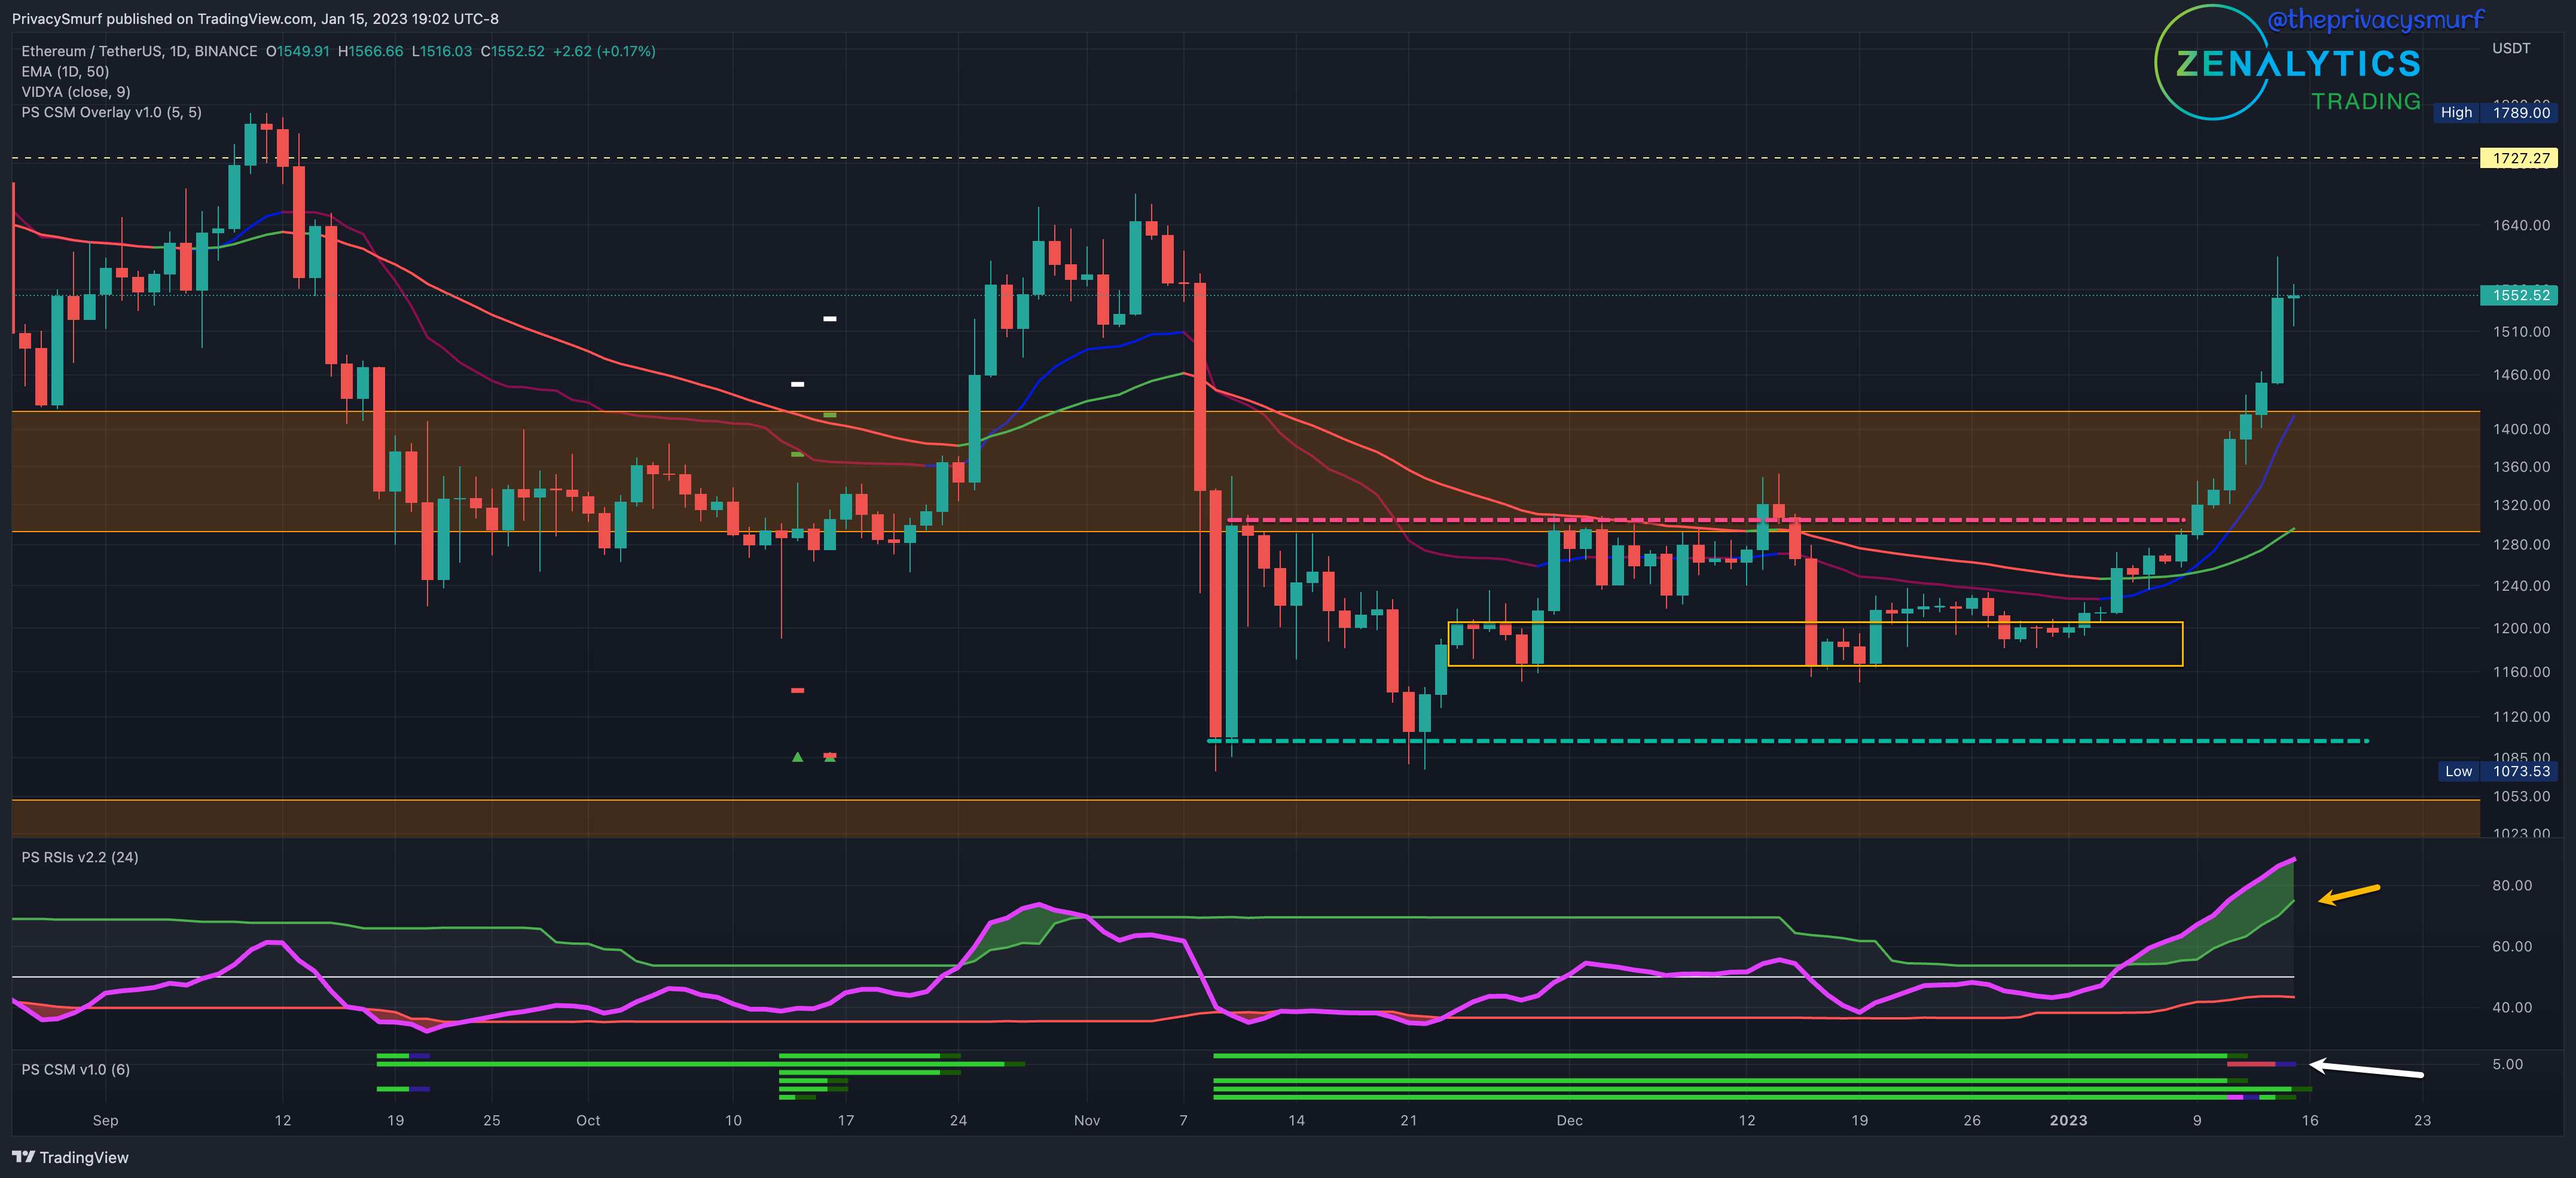
Picture the perfect breakout scenario after the higher low close at $1190. Prices set a higher high close at $1256, also above the 50-day EMA, with the RSI breaking above midline on January 4th, then above the adaptive top band the next day, and never looked back. My indicator, the Correction Strength Meter (white arrow), momentarily plotted red, suggesting conditions for a bearish reversal, but were promptly invalidated. The RSI (white arrow) is still above the adaptive top band suggesting the upside impulsivity may not be over yet. An older overhead resistance plots around $1730.
Given the current technicals for the week, I’m still expecting ranging prices around $1350 - $1640. My bias this week is bullish, with a word of caution. This is due to the fact that prices have pushed higher with little retracement. Keeping an eye on the RSI will be the key to identifying when a range high may be established, and consolidation may start if an intraday (around 2hr) bearish signal comes in the same day as the RSI falling back into the bands on the daily chart that may be a decent short position to evaluate. I’m not interested in opening a new position on ETH. A bullish swing entry on a retracement would be preferable from a risk-to-reward standpoint over a breakout at $1680 due to multiple overhead resistances that may slow down subsequent breakouts.
I held a zoom call while I was on the mend. I’ll post up the links from the segments throughout the week. The trade results pictured above are part of a Notion trade database/journal, which will be available for anyone to duplicate soon to track their own trades. It’s ideal for folks using my indicators and trading the methods I teach, but anyone can use it successfully. I’ve put a lot of effort into creating a cool product that can help you reveal a lot about your trading and strategies to help you improve if you put in the work to track your performance.
@theprivacysmurf