

SS #65: New Year

Happy Chinese New Year. This is why I’m a day late. I went out last night and had some drinks and great Dim Sum with some friends, no Water Rabbits, though. It’s been a day too. The dishwasher won’t latch for some reason. The dryer is not putting out much heat. Internet is still intermittent. It’s been a day of troubleshooting, and I’ve got so little patience, and I only managed to accomplish two-thirds of my to-do list today. Oh well. It is what it is. Gonna keep it short today.
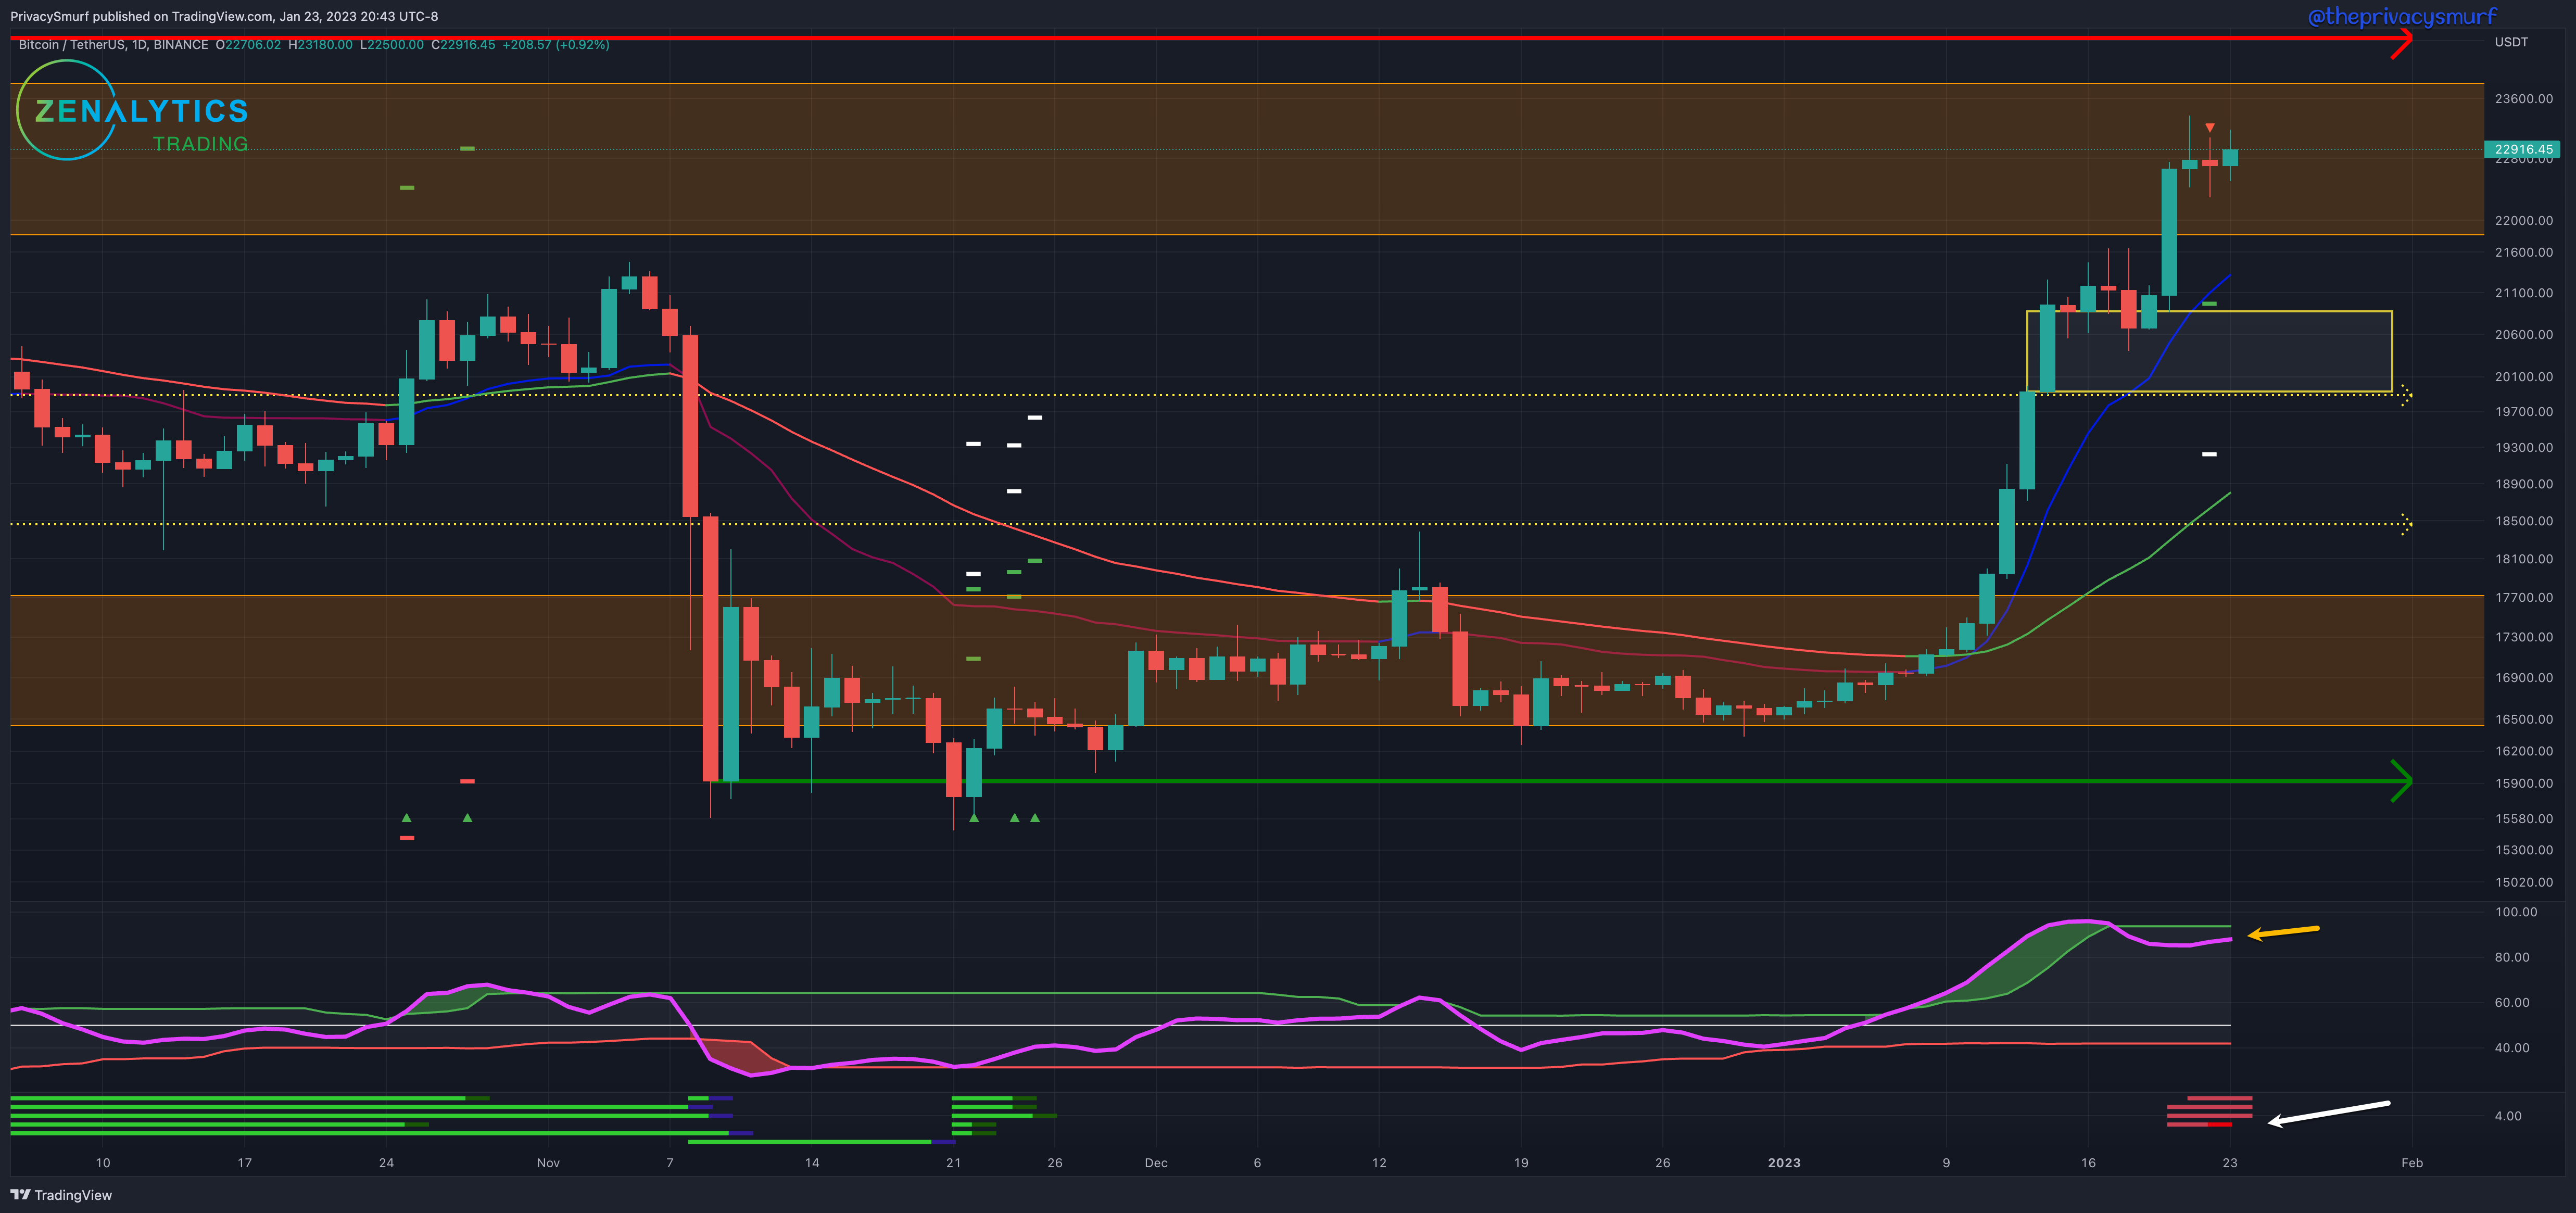
BTC/USDT Daily Chart
https://www.tradingview.com/chart/jjSdFW4b/
From last week:
”… increase the ranges to pricing between $18500 - $23000 range… bias this week is bullish... Ideally, BTC consolidates above $20000 for a time and continues with a new breakout higher…”
Given the week's current technicals, I would increase the ranges to pricing between $20000 - $25000. My bias this week is again bullish, with a word of caution. This is due to the RSI’s presentation and the bearish divergences developing in relation to price. Ideally, BTC consolidates above $22000 for a time and continues with a new breakout higher, with the RSI moving up again to create a new higher high to invalidate the divergence. In the event of a retracement instead of a breakout, the zone identified above ($20k - $21k) may be a good location to watch for bullish divergences on intraday timeframes (around 1HR - 2HR) to reenter the bullish trend. If daily closes set a new low under $21k without intraday bullish divergences, I’d be hesitant to buy into the pullback.
ETH/BTC Daily Chart
https://www.tradingview.com/chart/gTkSjkj6/

From last week:
”… If the RSI continues down price would likely follow on ETH and alts… In the event of a bearish CSM trigger… anticipate a deeper retracement… potential support at 0.071…”
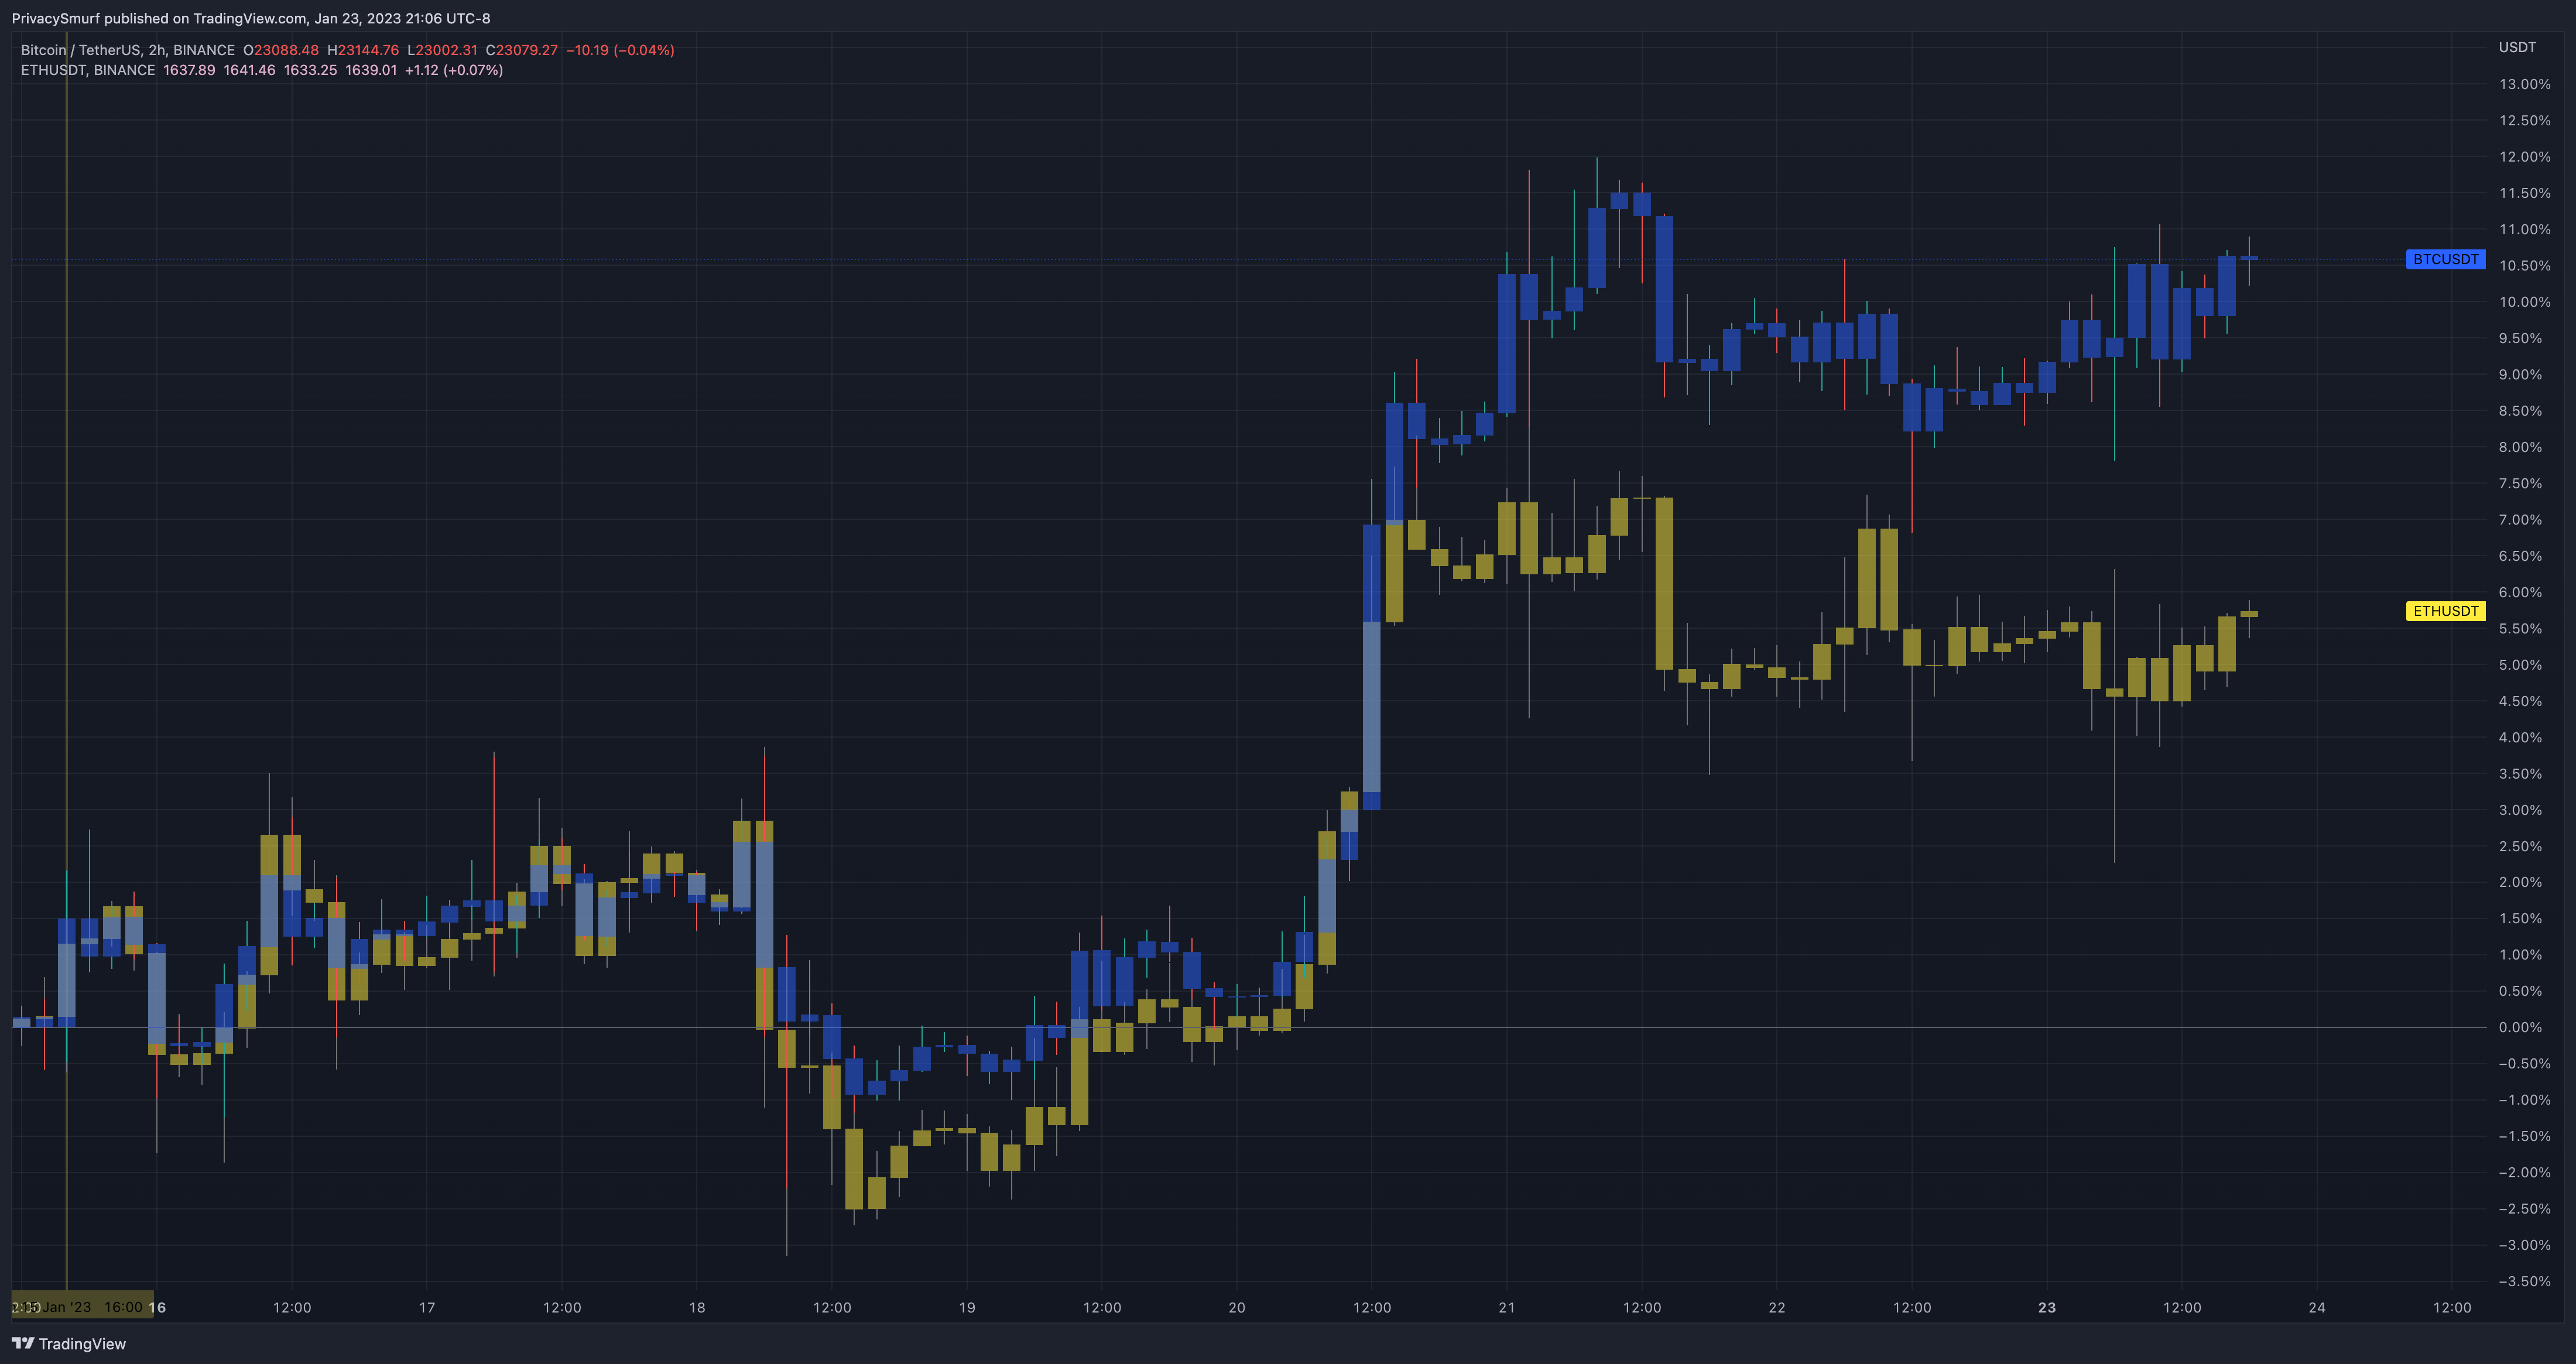
Exiting ETH and alt positions hasn’t come to pass yet, as the decline in the chart didn’t mean prices going down this time. Below I’ve highlighted this effect of the ETH/BTC chart. While the above chart shows the ETH/BTC ratio going down in a steady downtrend over the last two weeks, it’s translated to only a minor difference in value for both assets.
Given the current technicals for the week, the possibility of closing out of positions increases. With RSI breaking down from the bottom band (yellow arrow) there’s a suggestion of impulsive bearishness. My bias this week is neutral. This is due to the RSI’s presentation. Ideally, the RSI returns into the bands, and the support at 0.07 sees no daily closes below. With bearish divergences still present, I’m not currently considering new positions at these levels. I’d rather buy a higher breakout with better technicals than a support buy right now. In the event of a bearish CSM trigger (white arrow), I would anticipate a deeper retracement and watch for potential support at 0.068.
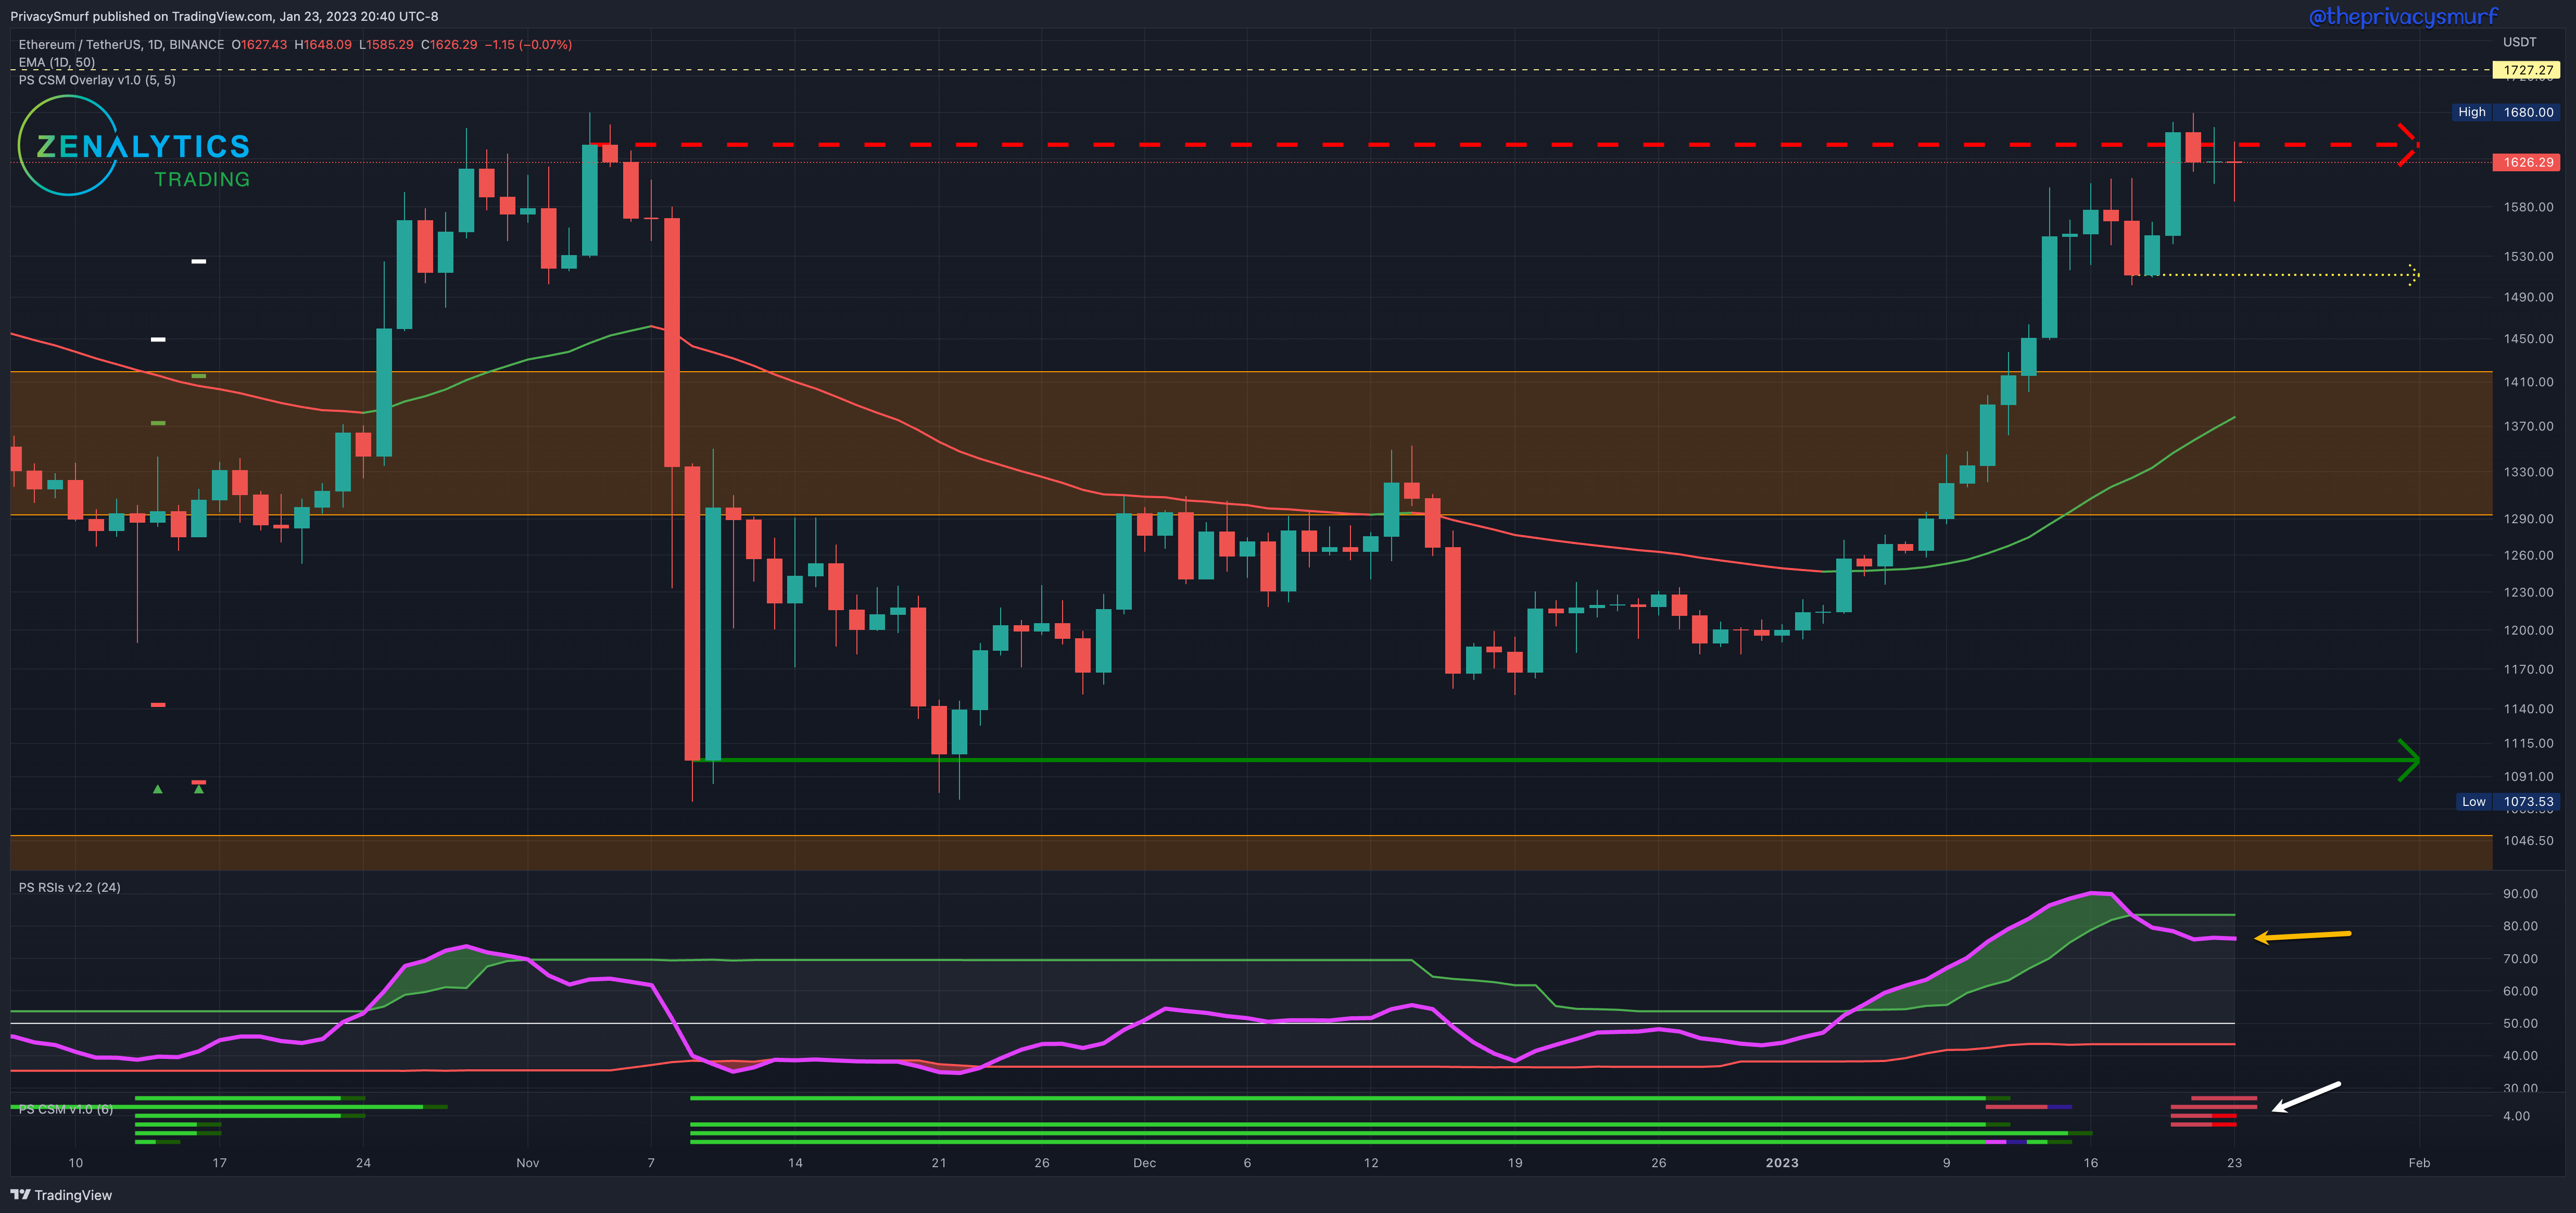
ETH/USDT Daily Chart
https://www.tradingview.com/chart/xbB6lkZu/
From last week:
“…still expecting ranging prices around $1350 - $1640… bias this week is bullish with a word of caution… RSI will be the key to identifying when a range high may be established… bullish swing entry on a retracement would be preferable… over a breakout at $1680 due to multiple overhead resistances…”
Given the current technicals for the week, I’m still expecting ranging prices around $1530 - $1730. My bias this week is neutral to bullish. I’m still not interested in opening a new position on ETH because there is now a bearish divergence (yellow arrow) on the chart on top of existing overhead resistances. A retracement no lower than $1530 would be preferable as long as intraday (1HR to 2HR) bullish divergences signaling the bullish reversal are supported by new buyers. I’d only take a bullish breakout if the RSI sets a new higher high and invalidates the bearish divergences on the CSM (white arrow).
Tomorrow (and the rest of the year) will be better. I’ll drop the Market Structure Monday post and the Trading Range Tuesday with a new coin.
@theprivacysmurf