

SS #66: Time (You and I)
SS #66: Time (You and I)
That's life.. if we had more time.

As we get to this point of all rallies elation is all over the place. It’s time to be wary. It would be nice if ‘we had more time’ with the bulls, but ‘that’s life,’ and all runs end at some point.
If you haven’t registered for my new site please do! You’ll get these posts and more.
Zenalytics Trading
BTC/USDT Daily Chart
https://www.tradingview.com/chart/jjSdFW4b/
From last week:
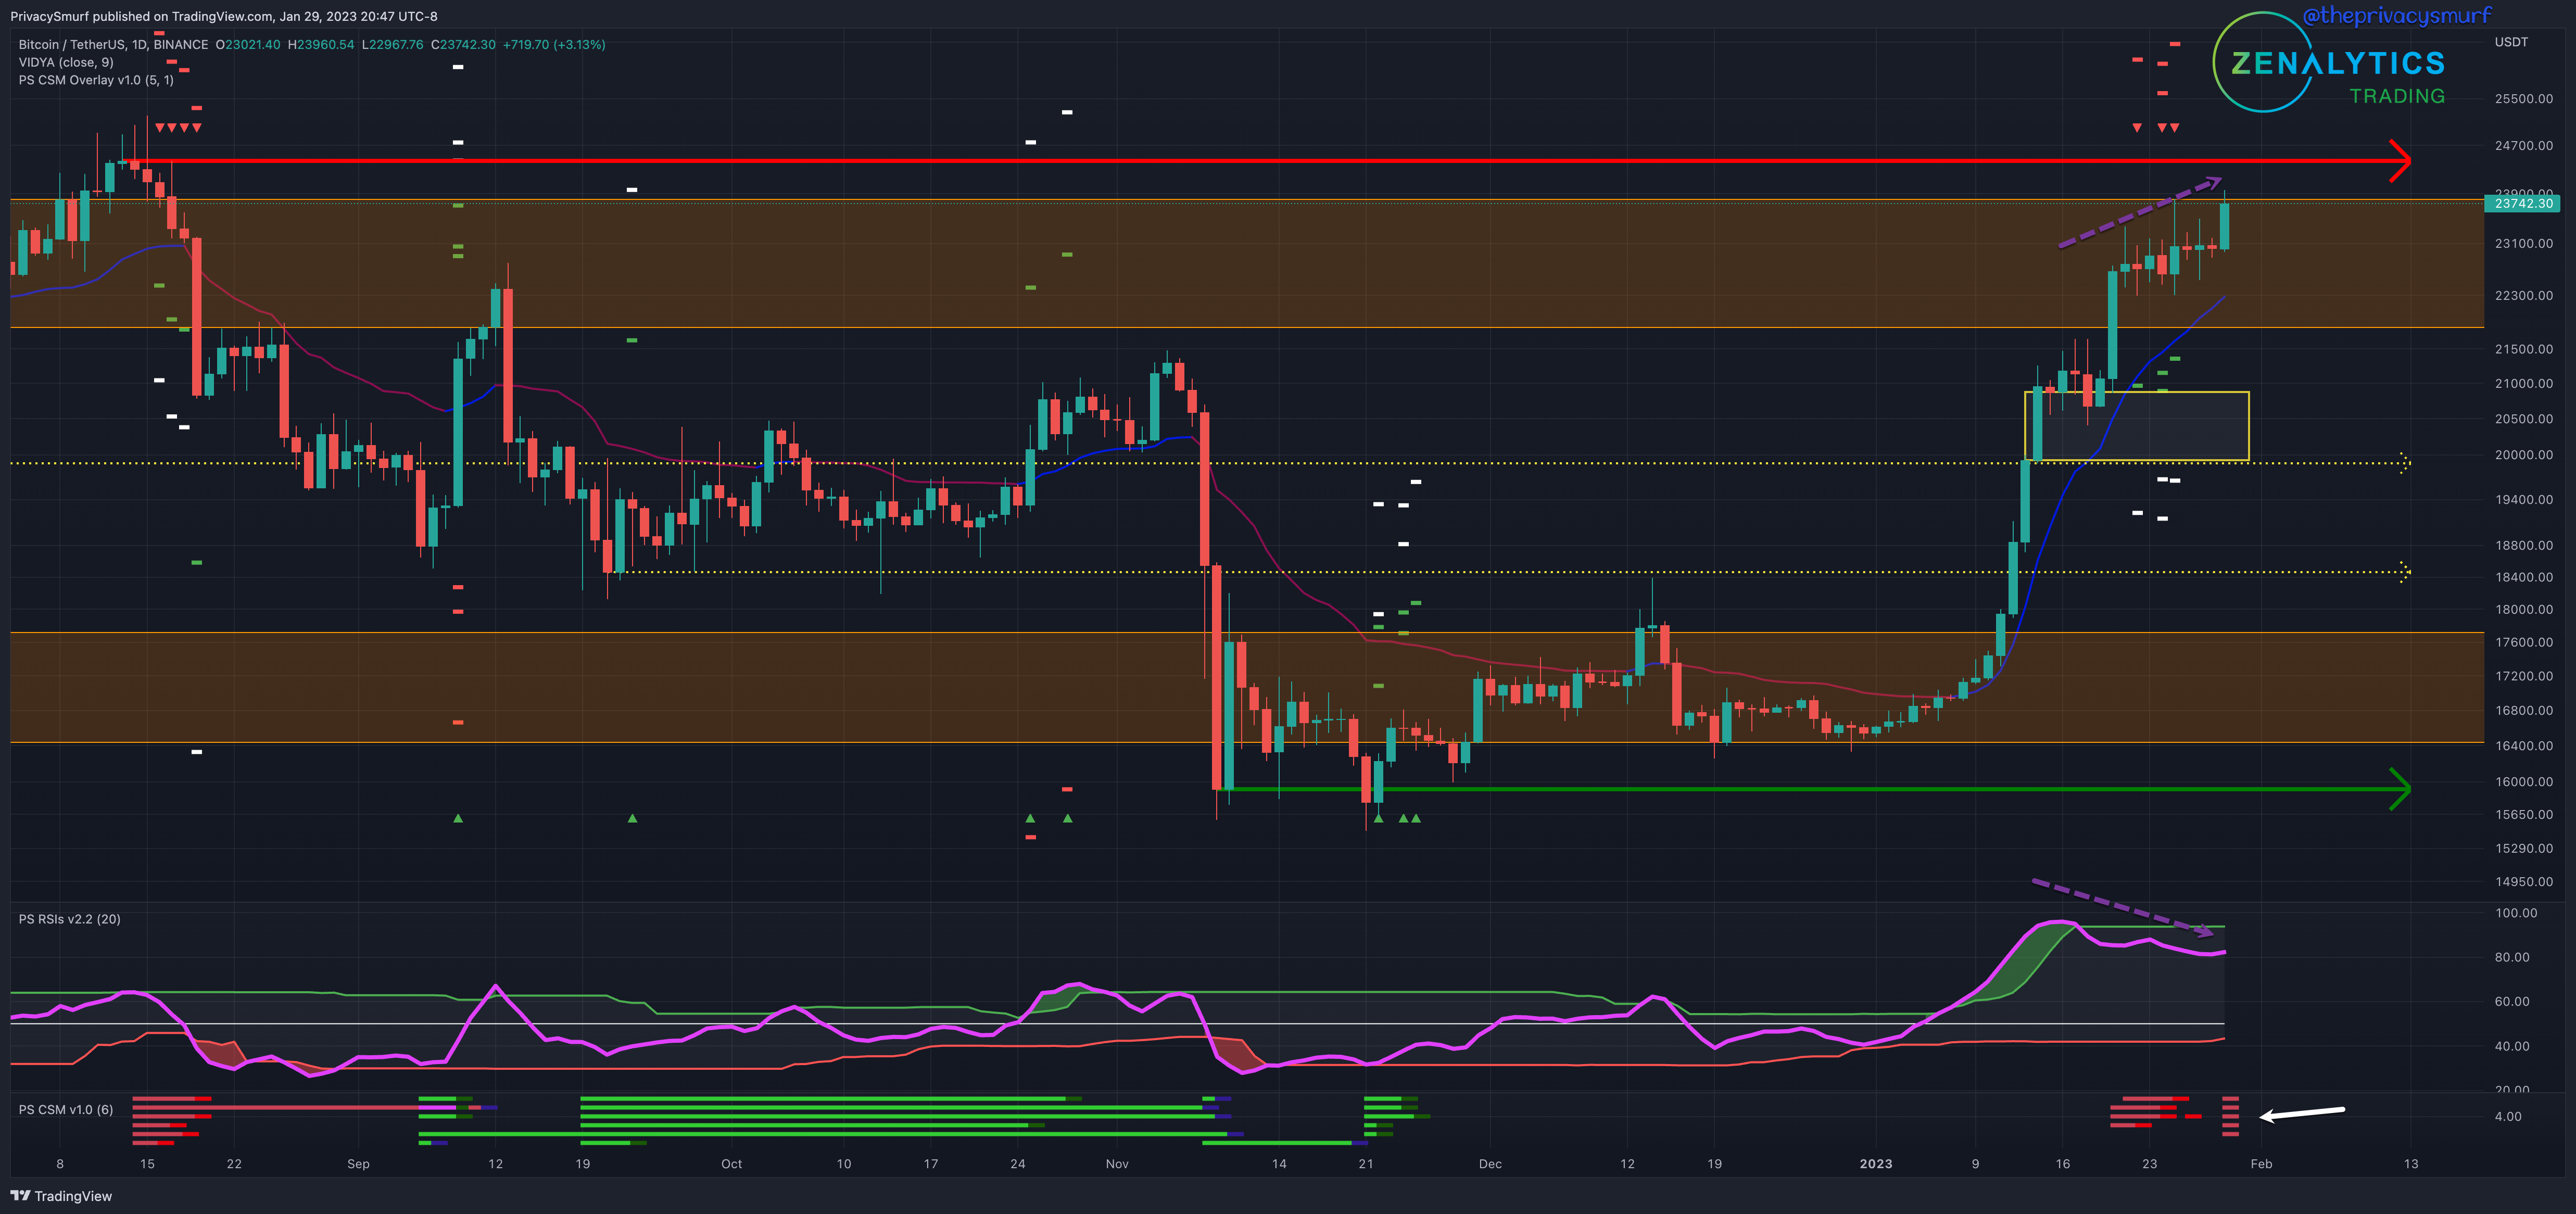
”… increase the ranges to pricing between $20000 - $25000… bias this week is again bullish.. BTC consolidates above $22000 for a time and continues with a new breakout higher…”
The BTC chart followed expectations last week. Prices were volatile but ranged until the end of the weekend when a bullish breakout closed above the consolidation levels. My hopes that the breakout would invalidate bearish divergences on the RSI by setting a new high were not realized. Instead, my custom indicator, the Correction Strength Meter (white arrow), showed a full bearish divergence with six red bars. This indicates that all relevant price action oscillators are in bearish divergence, illustrated with the purple dashed arrows. Prices achieved a new high, but oscillators did not match, placing a lower high - textbook bearish divergence. Unless new buyers step in and increase volume, prices will likely decline. I'm not looking to short from this level, but I'm taking profits and tightening stop losses on open positions.
Given the week's current technicals, I would leave the ranges as is, pricing between $20000 and $25000. My bias this week is neutral to bearish. This is due to the RSI’s presentation and the bearish divergences that exist in relation to price. Ideally, BTC breaks above resistances, and oscillators match with new higher highs to invalidate bearish divergences, but this is not my expectation this week. I’m expecting some retracement. We are entering a bearish daily cycle leg on top of these technical factors. Hopefully, prices don’t retrace and close lower than $21000. This would start to negate the bullish structure. I would consider reentering long positions for a short-term swing trade in the zone from $20000 to $21000. There would HAVE to be bullish divergences on timeframes 1HR to 4HR for me to take a support buy there, though. We are entering into a bearish daily cycle leg.
ETH/BTC Daily Chart
https://www.tradingview.com/chart/gTkSjkj6/
From last week:
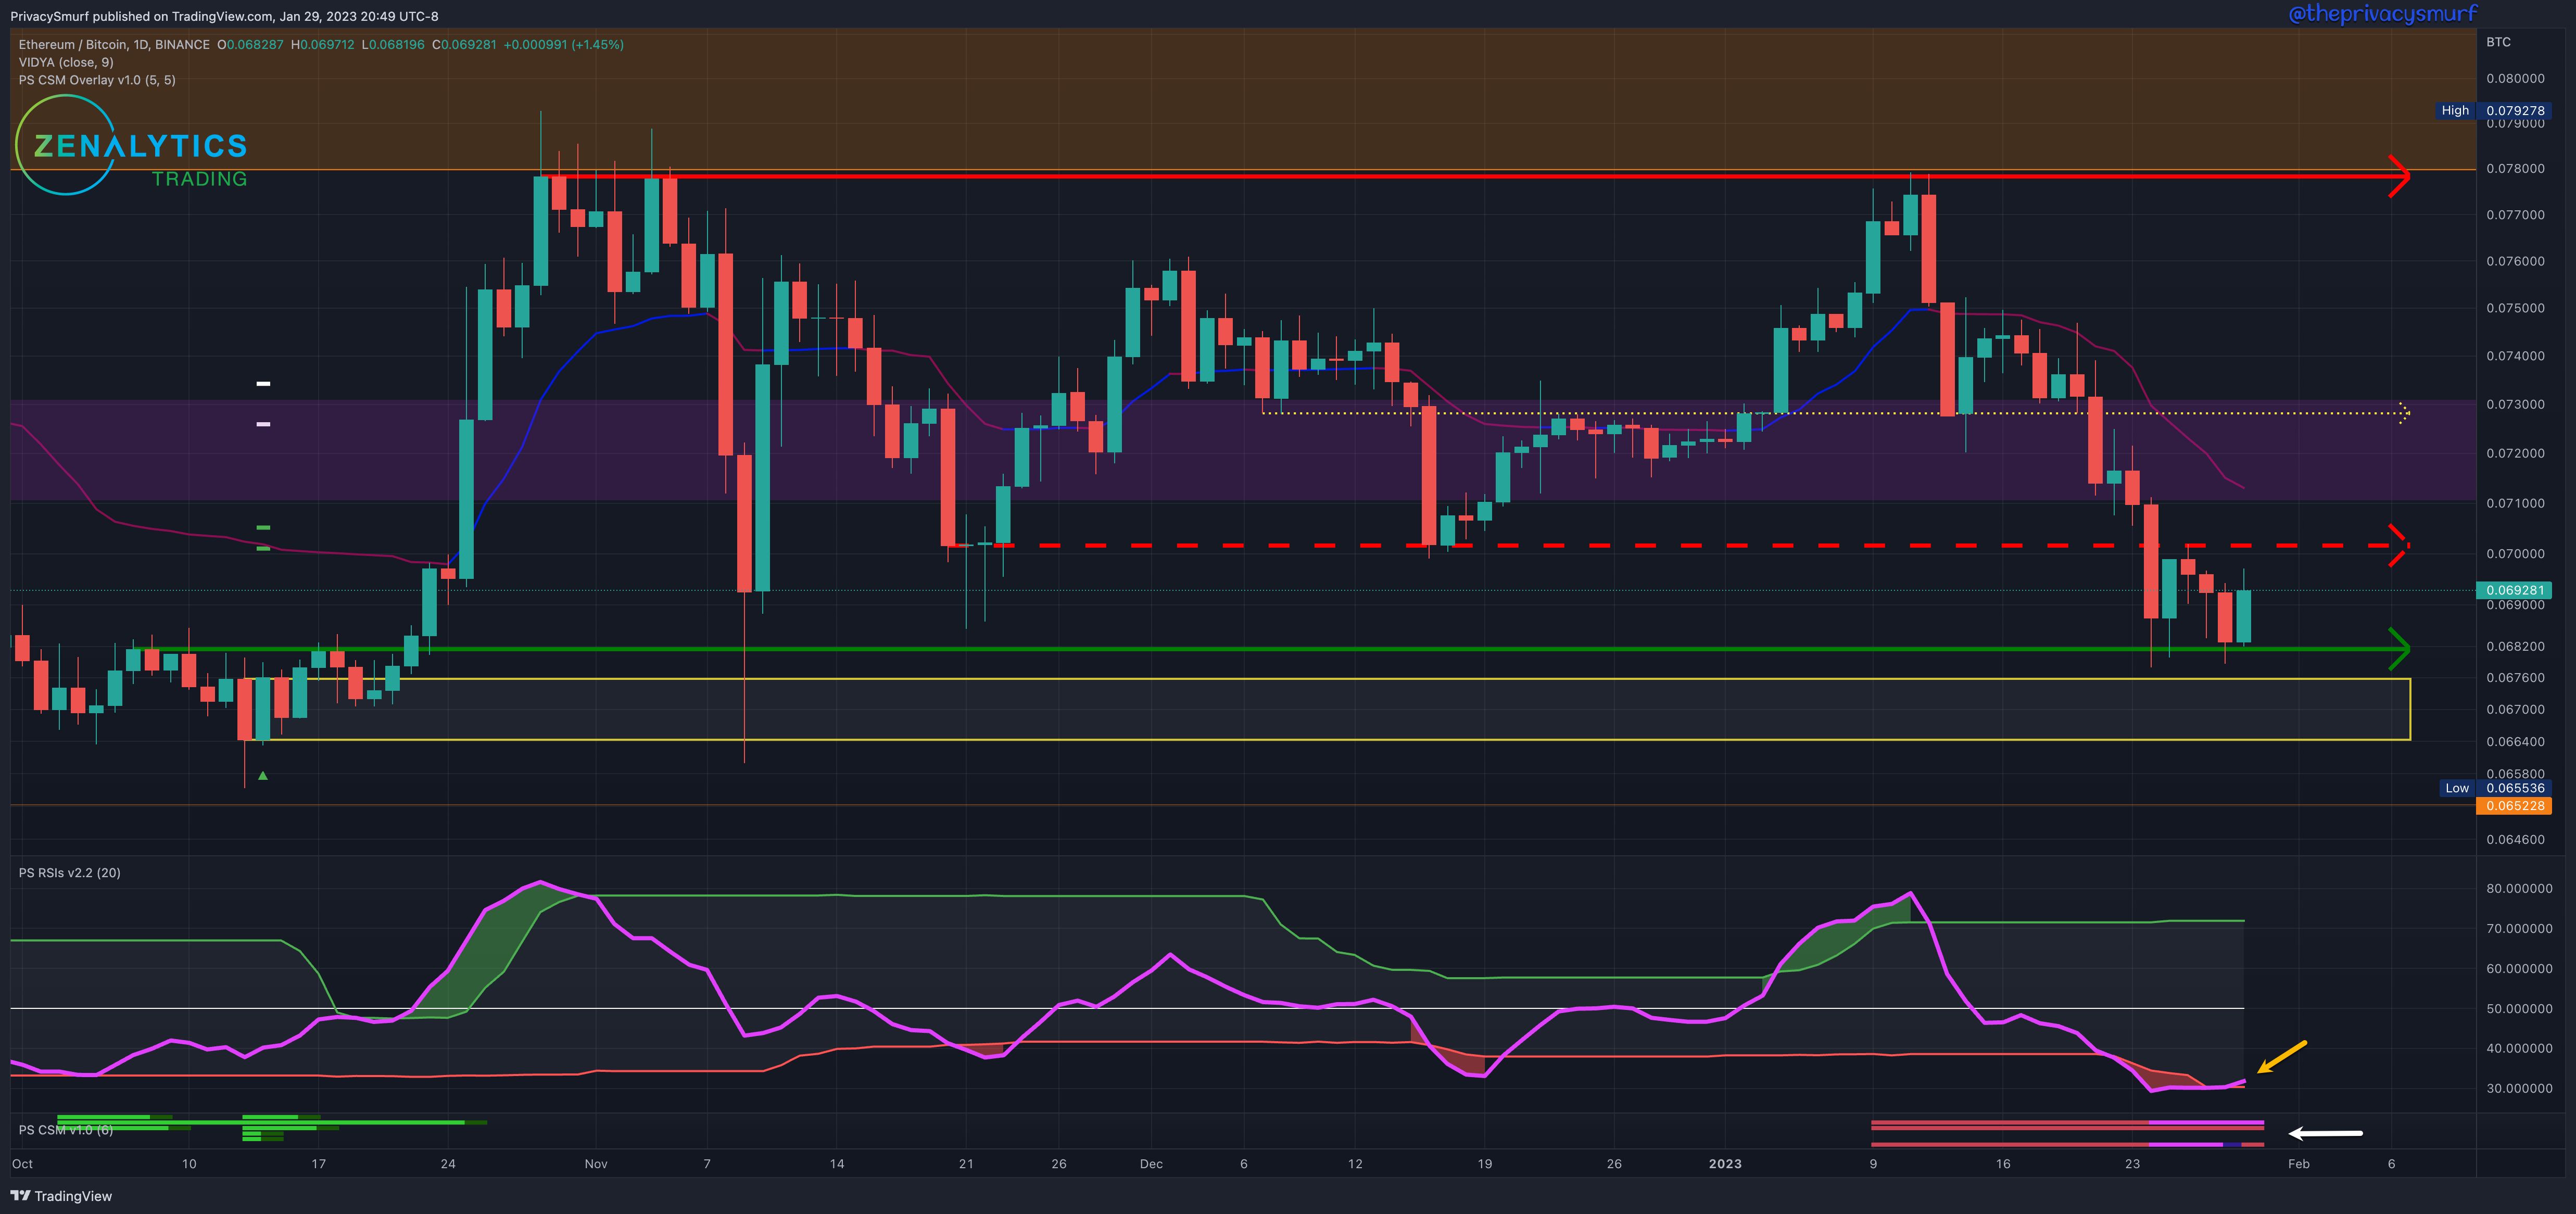
”… there’s a suggestion of impulsive bearishness… In the event of a bearish CSM trigger… anticipate a deeper retracement… watch for potential support at 0.068…”
Exiting ETH and alt positions has been occurring for me but at a trickle. It would appear that the rotation out of alts hasn’t fully come to pass, and many are lagging in the shift to bearishness. Slowly but surely, though, my trailing stops are being hit, and new smaller trades are stopping out quickly. This is not a sign of continued bullishness. The ETH/BTC chart still hasn’t triggered a bearish trade signal on the Correction Strength Meter (white arrow) but is still in bearish divergence, threatening an even deeper retracement. The trend on the chart is bearish, and failure from the low support zone at 0.0664 to 0.0676 would be a bad development. From there, I’d expect relatively larger losses from ETH and alts. The RSI turning back into the adaptive bottom band (yellow arrow) would suggest that the support level may be the range bottom, but it won’t take much to break below again and see some more impulsive bearishness. It’s something to monitor this week.
Given the current technicals for the week, the possibility of closing out of positions increases. I imagine I’ll be out of most positions by the end of the week. My bias this week is bearish to neutral. Ideally, the RSI stays inside the bands, and the support at 0.07 holds, and the chart oscillates between 0.068 and 0.072. In the event of a bearish CSM trigger, the low support zone may fail and the market sells off hard.
ETH/USDT Daily Chart
https://www.tradingview.com/chart/xbB6lkZu/
From last week:
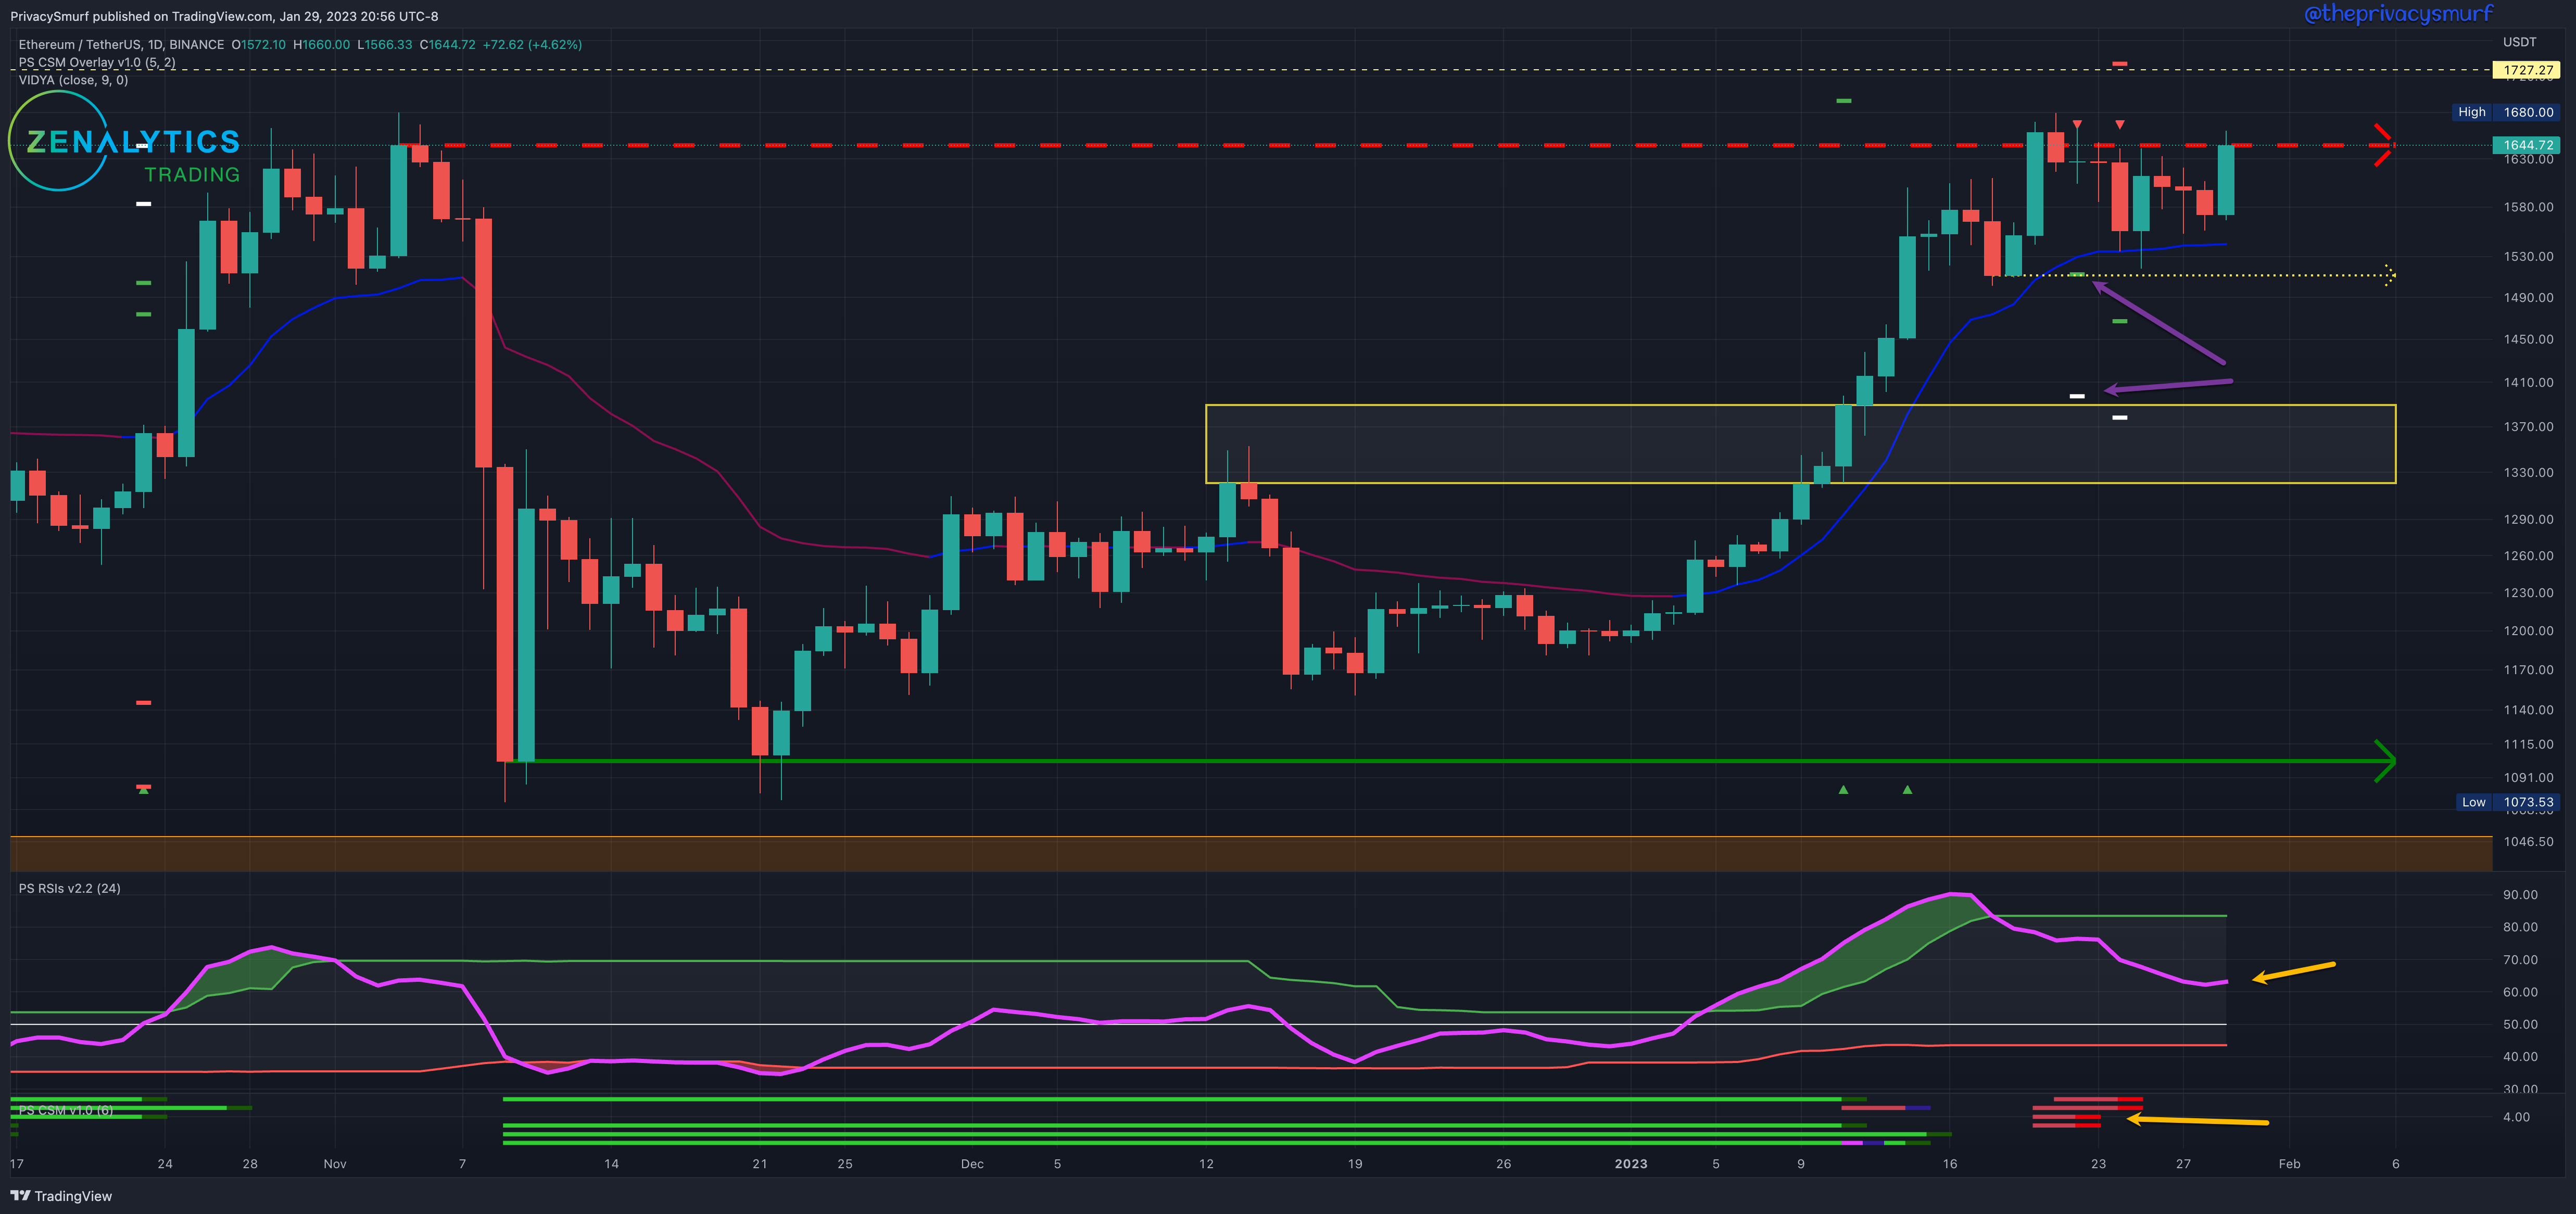
“…not interested in opening a new position on ETH… retracement no lower than $1530 would preferable… RSI will be the key to identifying when a range high may be established… as long as there is intraday (1HR to 2HR) bullish divergences signaling the bullish reversal…”
Early in the week, prices retraced down to the 1530 level offering a great intraday swing trade. Prices still, though, failed at the high resistances. The Correction Strength Meter (supposed to be white, but lower yellow arrow) shows bearish trades signaled with targets (purple arrows) around $1500 and the lower support zone at $1400. The RSI (top yellow arrow) is still trailing under price, so even if there is a price rally above the recent highs, it will set up in full bearish divergence similar to BTC’s current picture. A decline is probably coming.
Given the current technicals for the week, I’m lowering ranges to around $1450 - $1700. My bias this week is bearish to neutral. Similar to last week, a retracement no lower than $1530 would be preferable as long as there is intraday (1HR to 2HR) bullish divergences signaling the bullish reversal is supported by new buyers. That price action would still maintain a bullish structure, but the risk is increased with taking that position due to the waning bullish technicals. I am not expecting to take that trade setup at the moment. A bullish breakout from the recent highs I’d only take if the RSI sets a new higher high and invalidates the bearish divergences on the CSM (white arrow).
@theprivacysmurf