

SS # 67: Goddamit Golda
SS # 67: Goddamit Golda
Tell me good people, what do you want to know?

If you haven’t registered at the site I encourage you to do so. You’ll get this content on top of extra stuff. Sure you can just stay here for the weekly updates but there so much more being added all the time. If your goal is to take control of your profits, trade like I do, and maximize your learning potential for trading the markets you owe it to yourself to join in and follow along.
The signup link is in the drop-down of the introductory paragraph.
Here’s a clip of a new feature getting implemented soon along with a fancy notion trade journal that I’ve been screenshotting and updating in the discord.
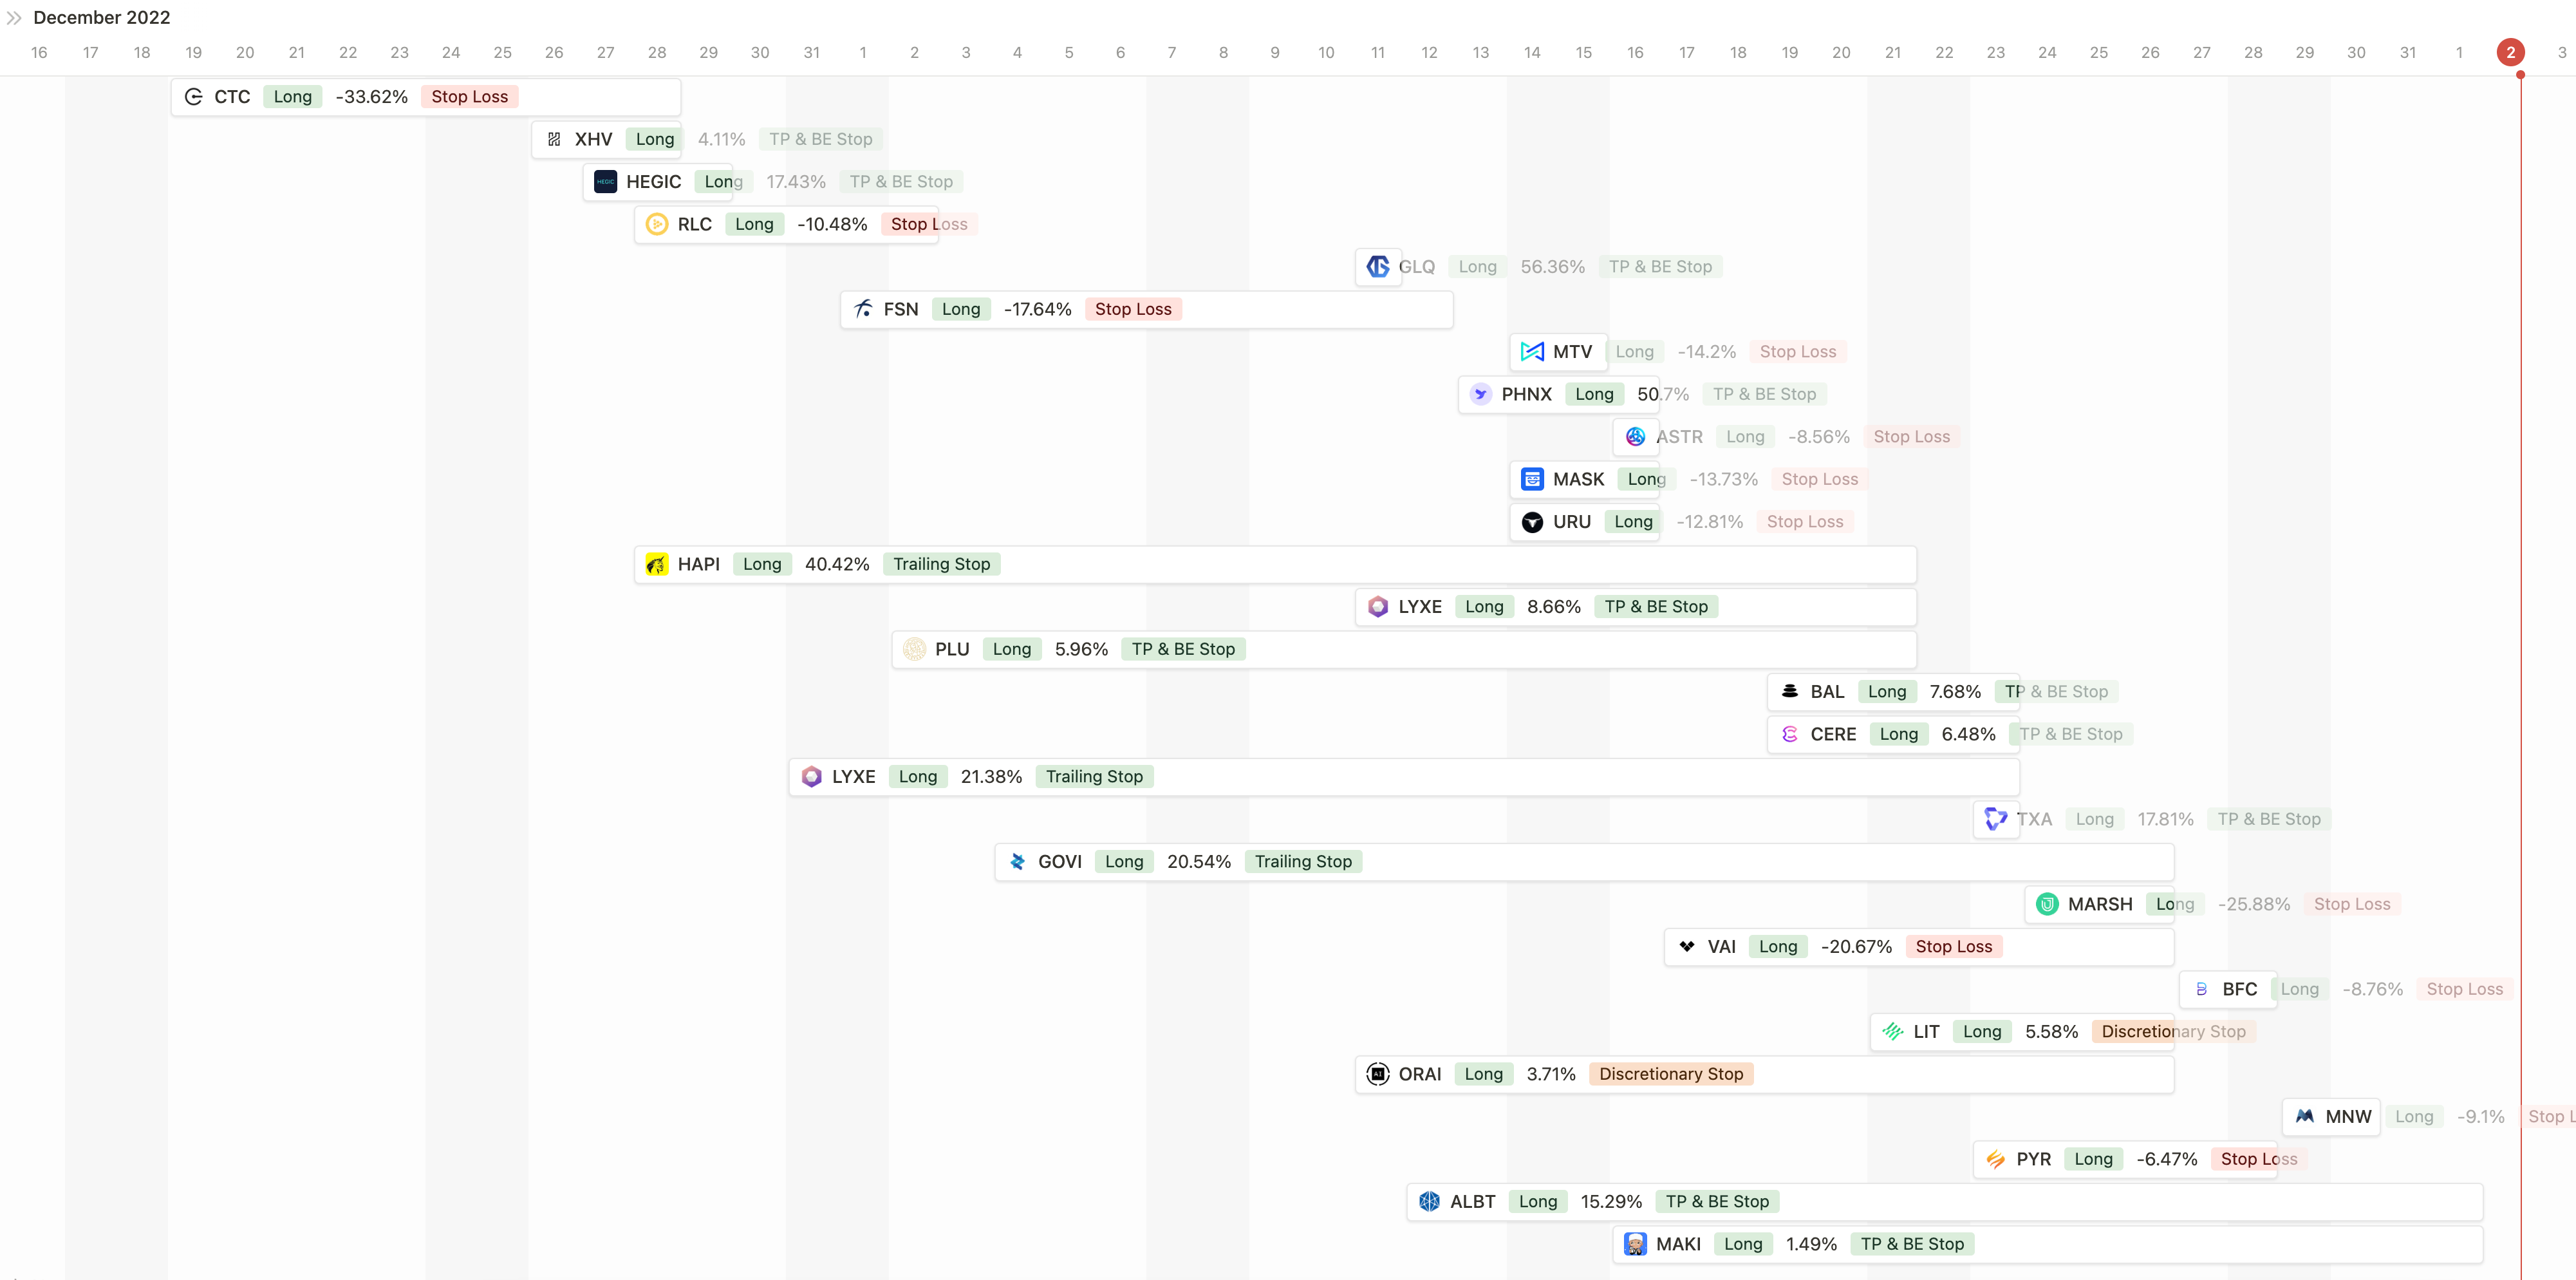

If you have suggestions for other tools/content tell me, ‘What do you want to know?’
Now back to your regular programming.
BTC/USDT Daily Chart
https://www.tradingview.com/chart/jjSdFW4b/

From last week:
”… leave the ranges as is… bias this week is neutral to bearish... BTC consolidates above $22000 for a time and continues with a new breakout higher…”
It was an uneventful week for Bitcoin. Technically, prices did reach a new high, but the bearish divergence with the RSI, marked by the yellow arrow, still exists. Momentum is not increasing with the price, suggesting that a retracement will still occur. The Correction Strength Meter on the bottom of the chart, labeled with the white arrow, is still showing bearish trade signals. The initial targets for that signal are marked by the purple arrows on the price chart. I would be looking for a retracement to that level. However, personally, I wouldn't be short until the structure is broken from the 22,300 level. The market is still overall bullish on a higher timeframe, so shorting the market isn't advisable until the structure is lost.
Given the week's current technicals, I would leave the ranges as is, pricing between $20000 and $25000. My bias this week is neutral to bearish. This is due to the RSI’s presentation and the bearish divergences that exist in relation to price. I will be watching for a retracement to the support zone near the targets of the CSM. However, personally, I wouldn't be short on an intraday timeframe until the structure is broken from the 22,300 level. The market is still overall bullish on a higher timeframe, so shorting the market isn't advisable until the structure is lost. Hopefully, prices don’t retrace and close lower than $21000. This would start to negate the bullish structure. I would consider reentering long positions for a short-term swing trade in the zone from $20000 to $21000. There would HAVE to be bullish divergences on timeframes 1HR to 4HR for me to take a support buy there, though. We are in a bearish daily cycle leg. It can translate to a decline or possibly just a period of consolidation before the bullish trend continues.
ETH/BTC Daily Chart
https://www.tradingview.com/chart/gTkSjkj6/
From last week:
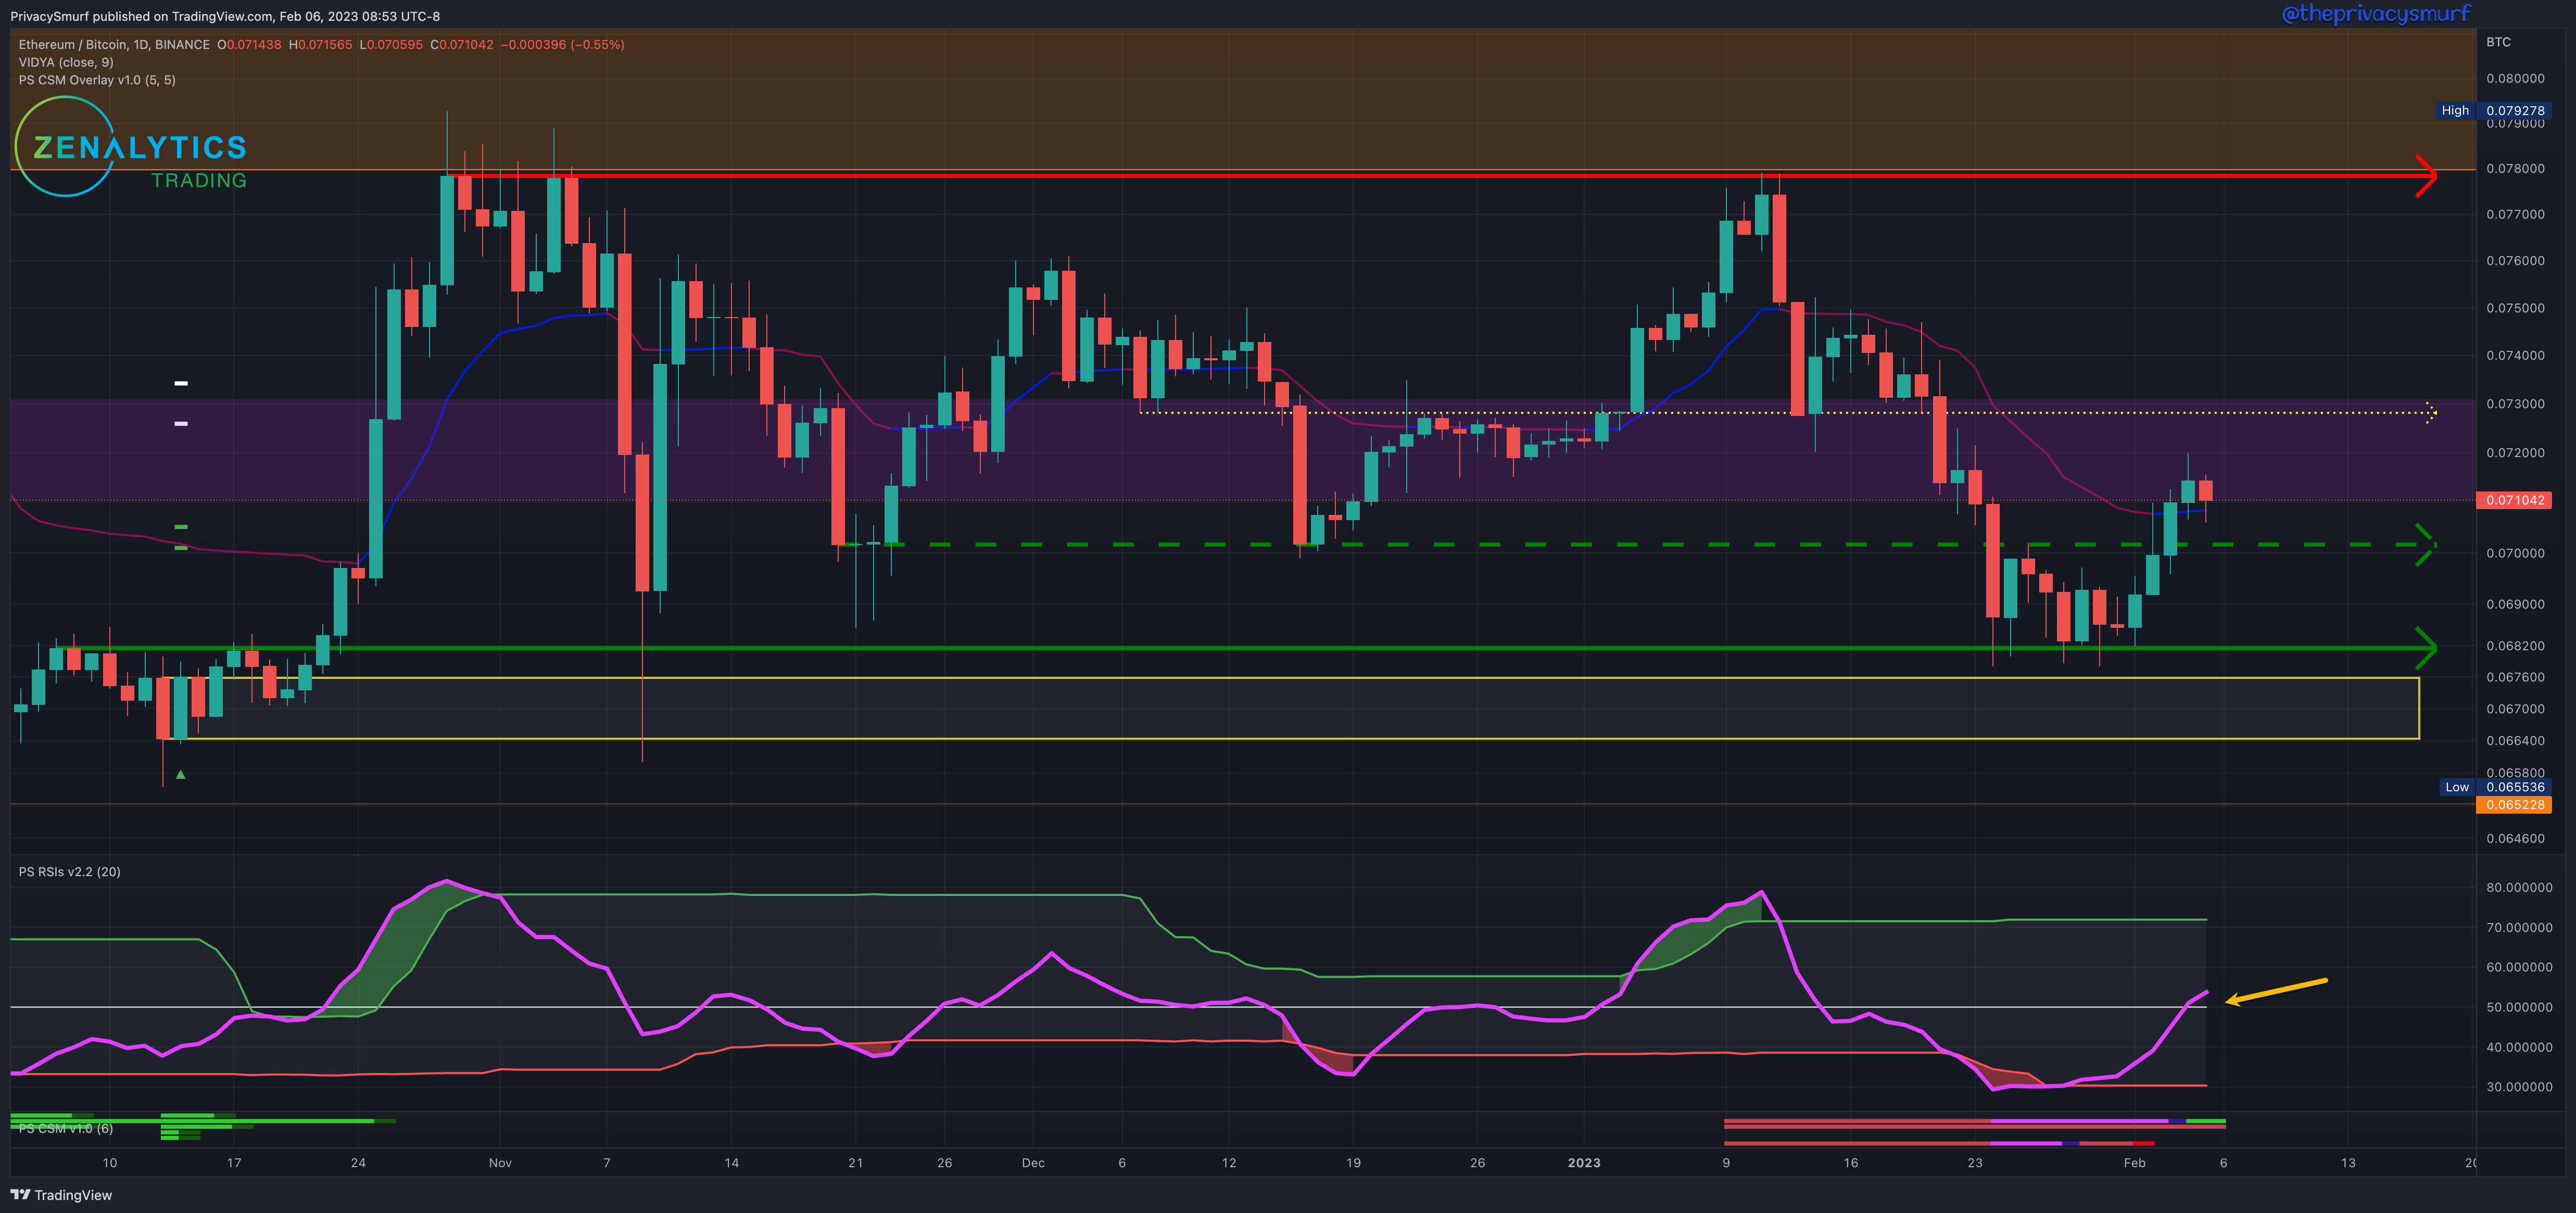
”… RSI turning back into the adaptive bottom band (yellow arrow) would suggest that the support level may be the range bottom… Ideally, the RSI stays inside the bands, and the support at 0.07 holds, and the chart oscillates between 0.068 and 0.072…”
The RSI marked with the yellow arrow curled back into the bands and support held. ETH increased in value relative to BTC most of the week. This was also reflected across the alt market. More positions hit profit targets and some moved back up from being slightly negative. The suggested ranges were on point but with the RSI testing above the midline this may suggest a shift toward bullish momentum. It’s something to watch during the week.
Given the current technicals for the week, just waiting and leaving ranges as they are at 0.068 and 0.073. Both directions are about as equally potential to me. I still am slowly trailing out of some positions despite the random bullish alts. A bullish scenario would be the RSI staying above the midline and testing 0.073. I’d take breakouts on ETH and alts then if the RSI is breaking above the top band. A bearish scenario would be a failure under 0.07 and the RSI returning below the midline. I wouldn't look to be short though until 0.0682 failed. It has the potential to be a support restricting downside potential. My bias this week is neutral. Ideally, the RSI stays above the midline, retraces slightly creating a higher low then returns up and tests the 0.073 level.
ETH/USDT Daily Chart
https://www.tradingview.com/chart/xbB6lkZu/
From last week:
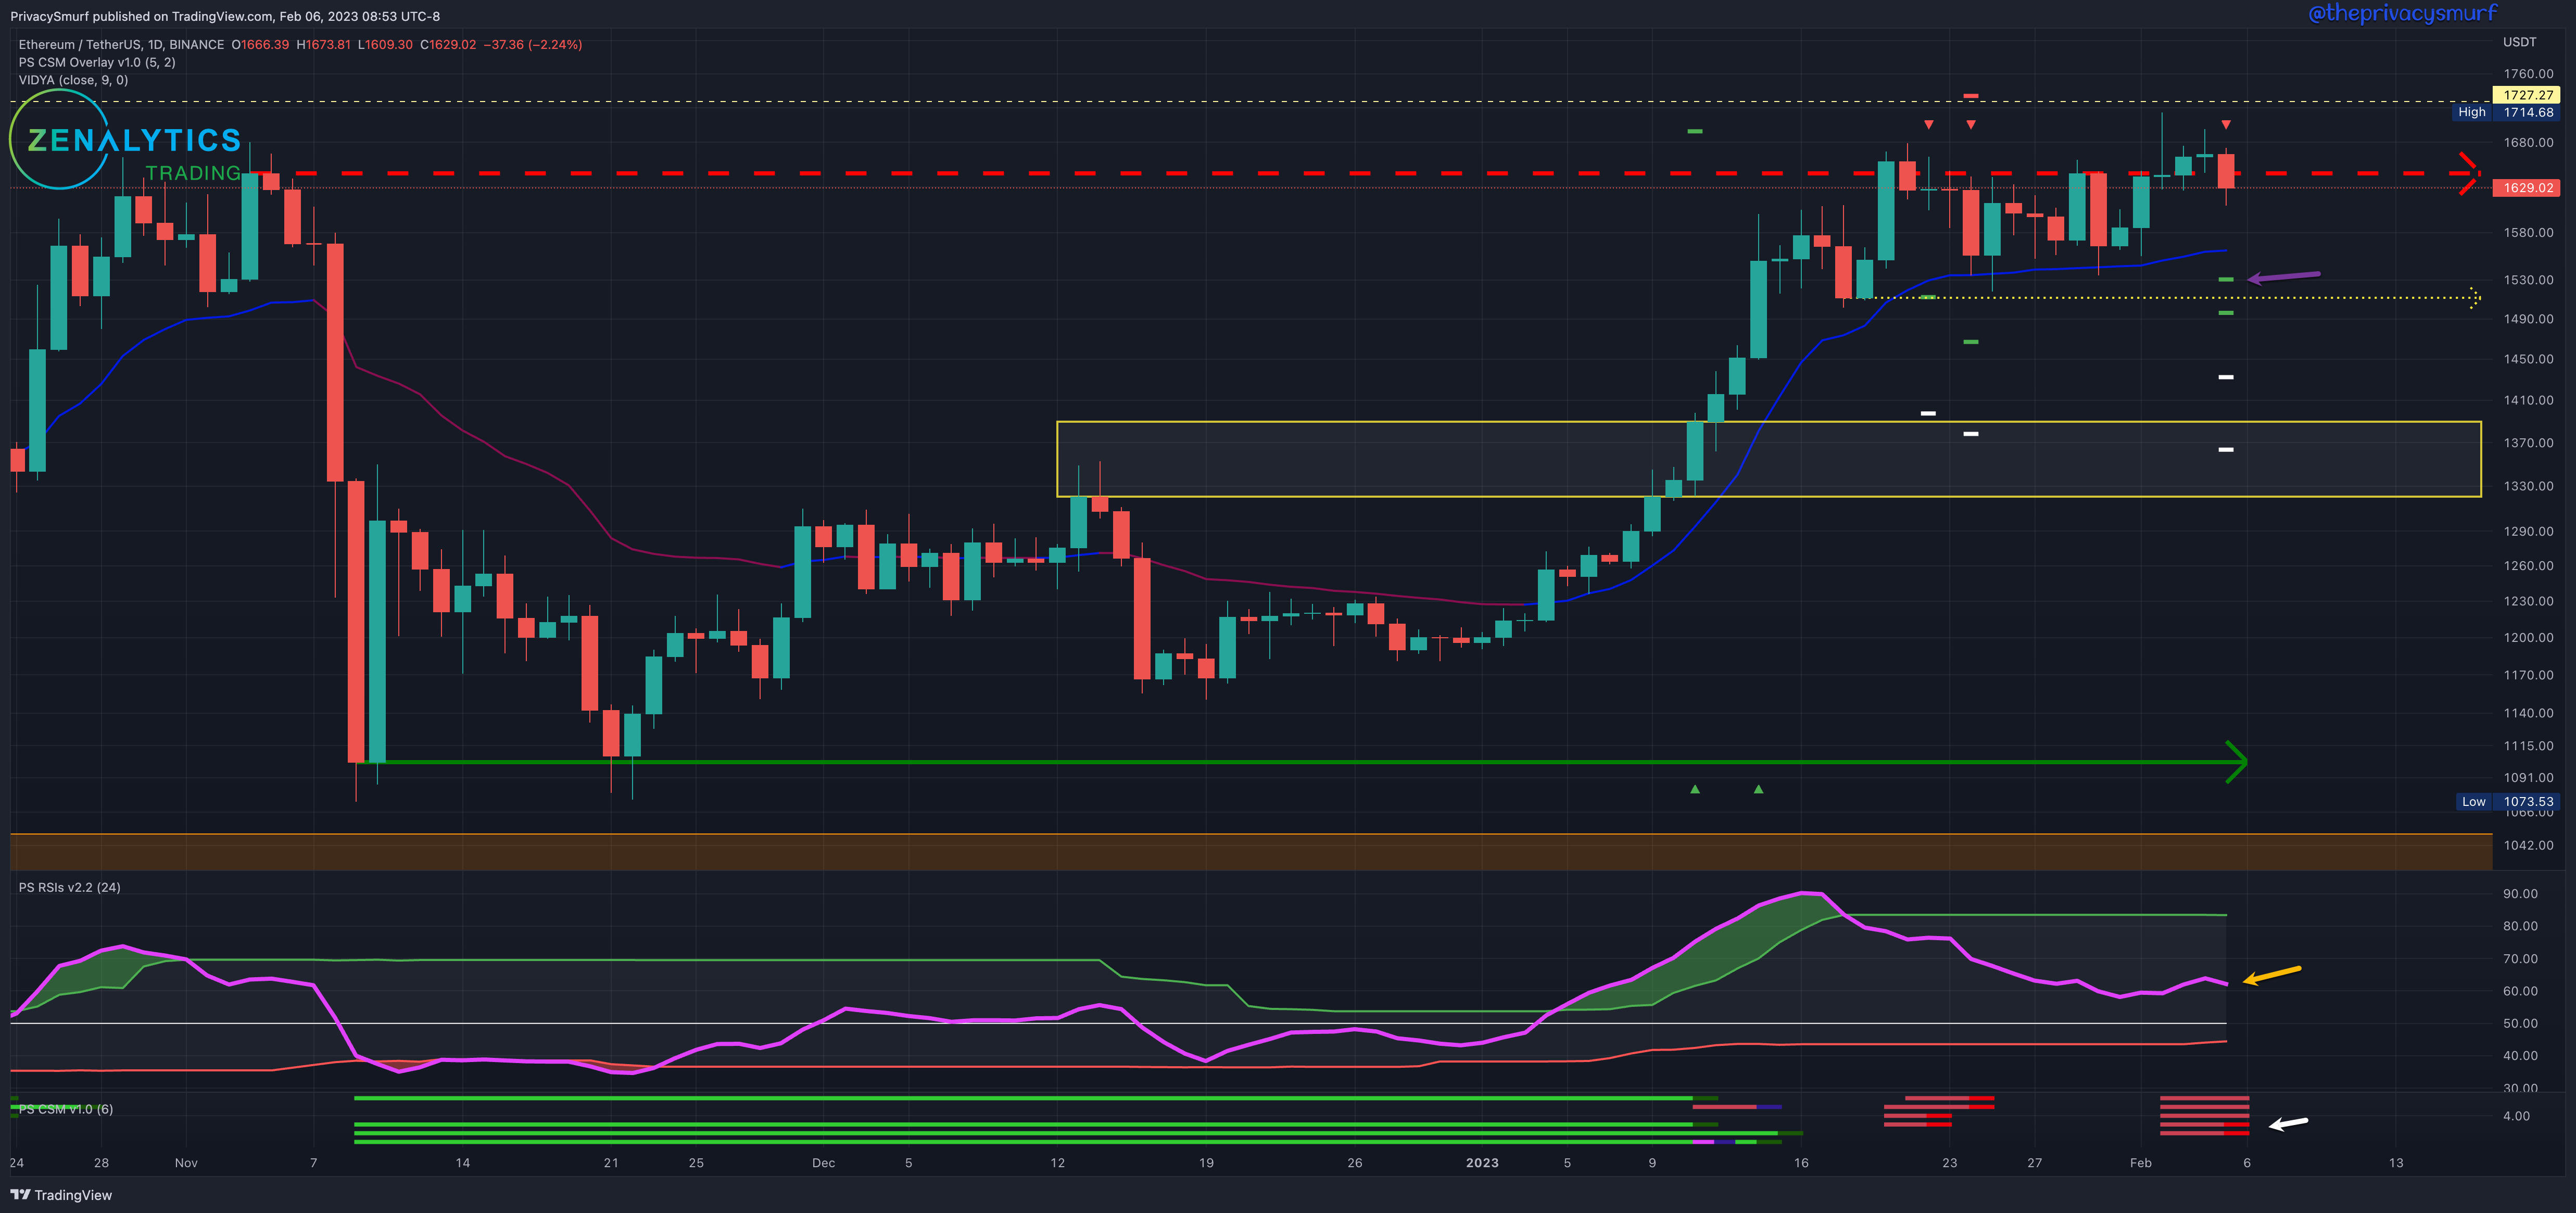
“…bullish breakout from the recent highs I’d only take if the RSI sets a new higher high…”
Broken record. Last week still rings true. Early in the week, prices retraced down to the 1530 level offering a great intraday swing trade. Prices still, though, failed at the high resistances. The Correction Strength Meter pointed out by the white arrow shows bearish trades signaled with targets by the purple arrows around $1500 and the lower support zone at $1400. The RSI pointed out with the yellow arrow is still trailing under price, so even if there is a price rally above the recent highs, it will set up in full bearish divergence similar to BTC’s current picture. A decline is probably coming. The full bearish signal on all oscillators didn't come in. All but one are in bearish divergence though.
Given the current technicals for the week, I’m keeping the same ranges at $1450 - $1700. My bias this week is bearish to neutral. A retracement no lower than $1530 would be preferable as long as there is intraday (1HR to 2HR) bullish divergences signaling the bullish reversal is supported by new buyers. That price action would still maintain a bullish structure, but the risk is increased with taking that position due to the waning bullish technicals. I am not expecting to take that trade setup at the moment. I’m also not interested in shorting the market until the structure at 1500 is lost. Again, a bullish breakout from the recent highs I’d only take if the RSI sets a new higher high and invalidates the bearish divergences on the CSM.
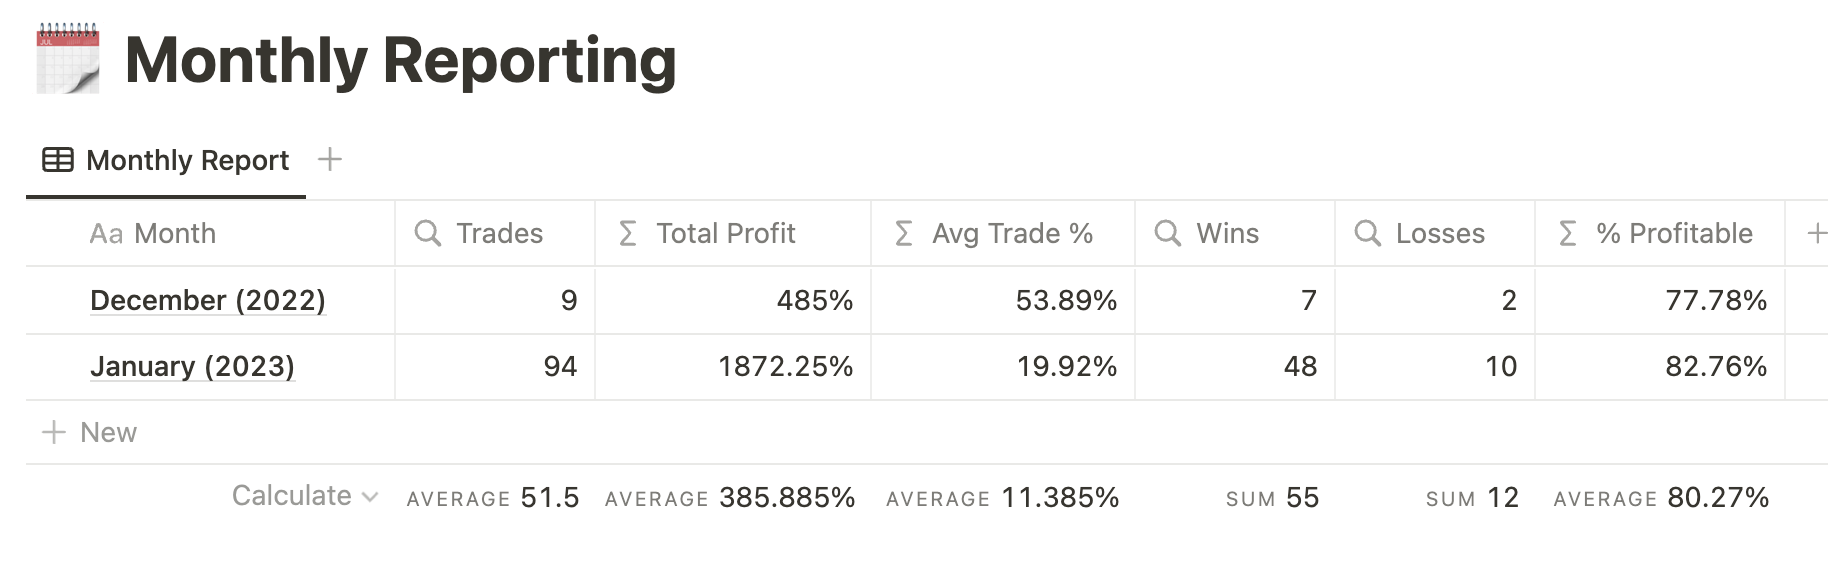
I’m up over 600% on spot positions of a few AI coins since December and early January. It’s slightly promising that AI coins that were leading the market earlier on are having new breakouts over the last few days after consolidating, but the ones that lead the longest are on their third and fourth runs. It’s possible as they become more “known” to retail traders large holders use that hype for exit liquidity. I’m still expecting a slowdown in the market since BTC and ETH still aren’t moving to new highs with all these alts.
@theprivacysmurf
Hi, can I join for the paid subscription?