

SS #68: Hydroplane

If you haven’t signed up for the new site please do. It’s where all my other content, free and paid has moved to.
zenalytics.info
I have been working on a big joint notion/python project that has really required a ton of my brain space. Yesterday I finished the bulk of it, put it together, and ran it and everything works. Today was such a weird day because my brain has been so focused and bogged down all day and night with coding and thoughts about coding. It was intense. Today I didn't have to do any of that. It was such a strange empty feeling inside my head. It’s like I just slid out and crashed a car. I’m just sitting in the car with my hands still on the steering wheel just staring out blankly into a void trying to collect myself after a violent reset.
BTC/USDT Daily Chart
https://www.tradingview.com/chart/jjSdFW4b/
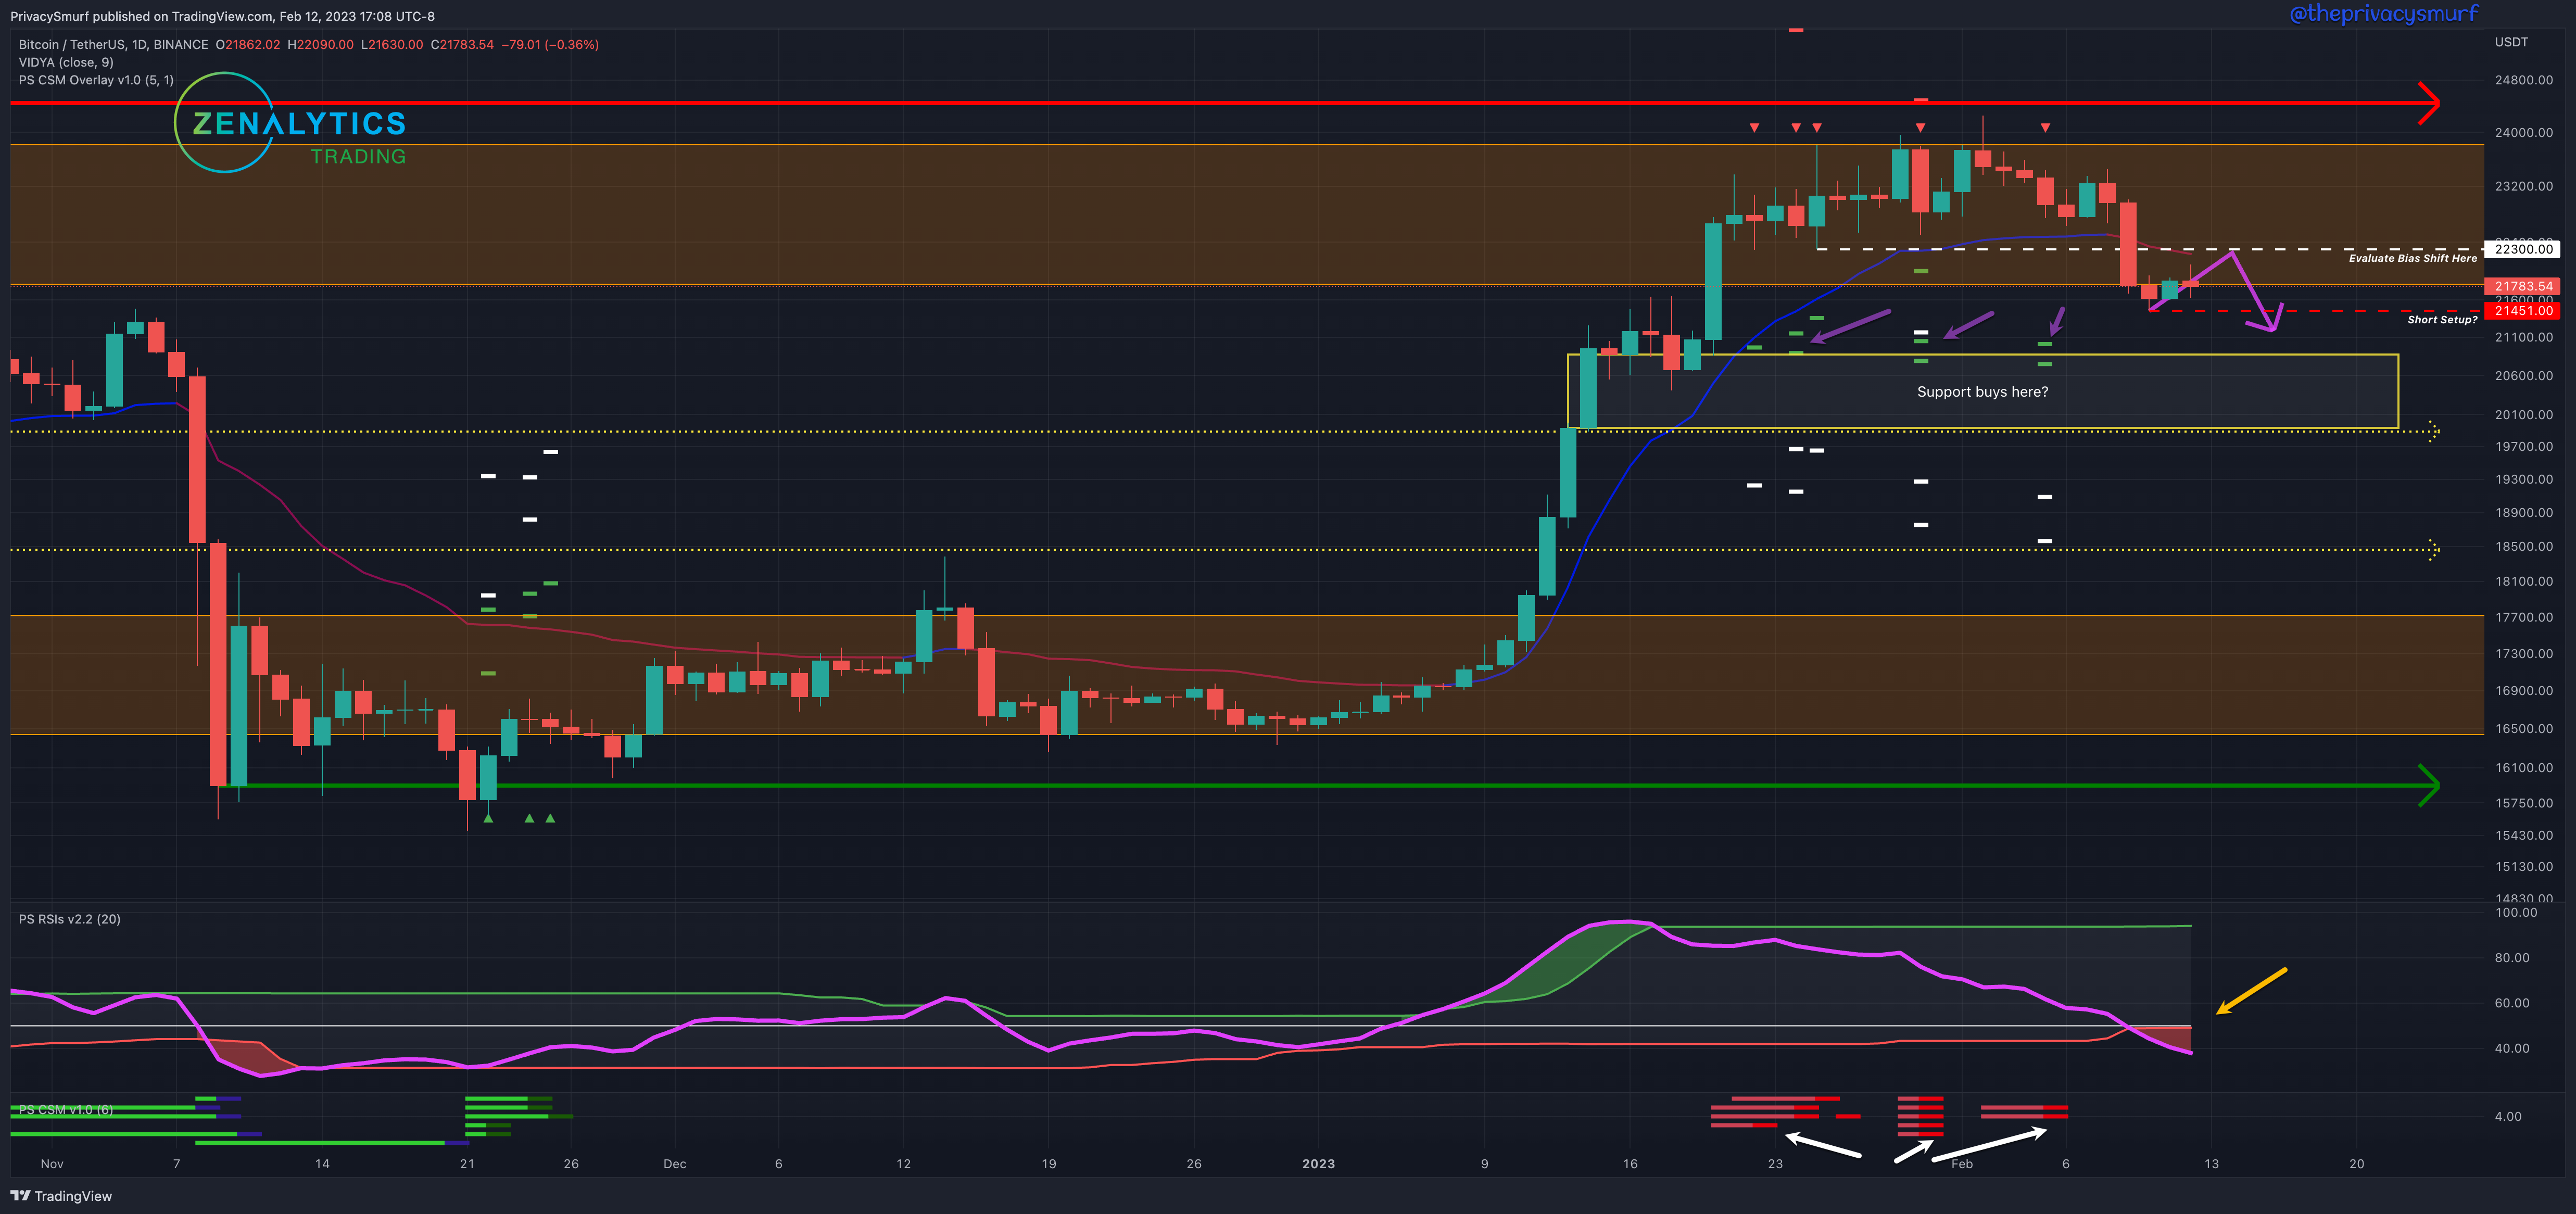
From last week:
”… leave the ranges as is… between $20000 and $25000… bias this week is neutral to bearish... watching for a retracement to the support zone…”
The retracement I’ve been expecting finally came. It was an inevitability. My indicator the Correction Strength Meter (white arrows) has been plotting bearish trade signals for weeks now. Midweek a large red day took out the prior lowest lows at $22.3k. The RSI (yellow arrow) shortly after crossing below the midline and the adaptive bottom band. This suggests to me that there is more bearish impulsivity on the horizon. I wouldn't expect a range bottom to be forming until the RSI can curl back up into the bands.
Given the week's current technicals, I would leave the ranges as is, pricing between $ 20k and $25k. Even so, I’m not anticipating prices above $23k but it’s always possible. My bias this week is bearish. This is due to the RSI’s presentation. I will be watching for a retracement to the support zone near the targets of the CSM (purple arrows). An ideal short would be to push back up to the $22.3k level with lower timeframe intraday bearish divergences (2HR-4HR). Same as last week, hopefully, prices don’t retrace and close lower than $21k. This would start to negate the bullish structure. I would consider reentering long positions for a short-term swing trade in the zone from $20k to $21k. There would HAVE to be bullish divergences on timeframes 1HR to 4HR for me to take a support buy there, though. With the RSI not showing signs of upwards correction yet I’m becoming less optimistic about closing prices staying over $21k but we’ll see.
ETH/BTC Daily Chart
https://www.tradingview.com/chart/gTkSjkj6/
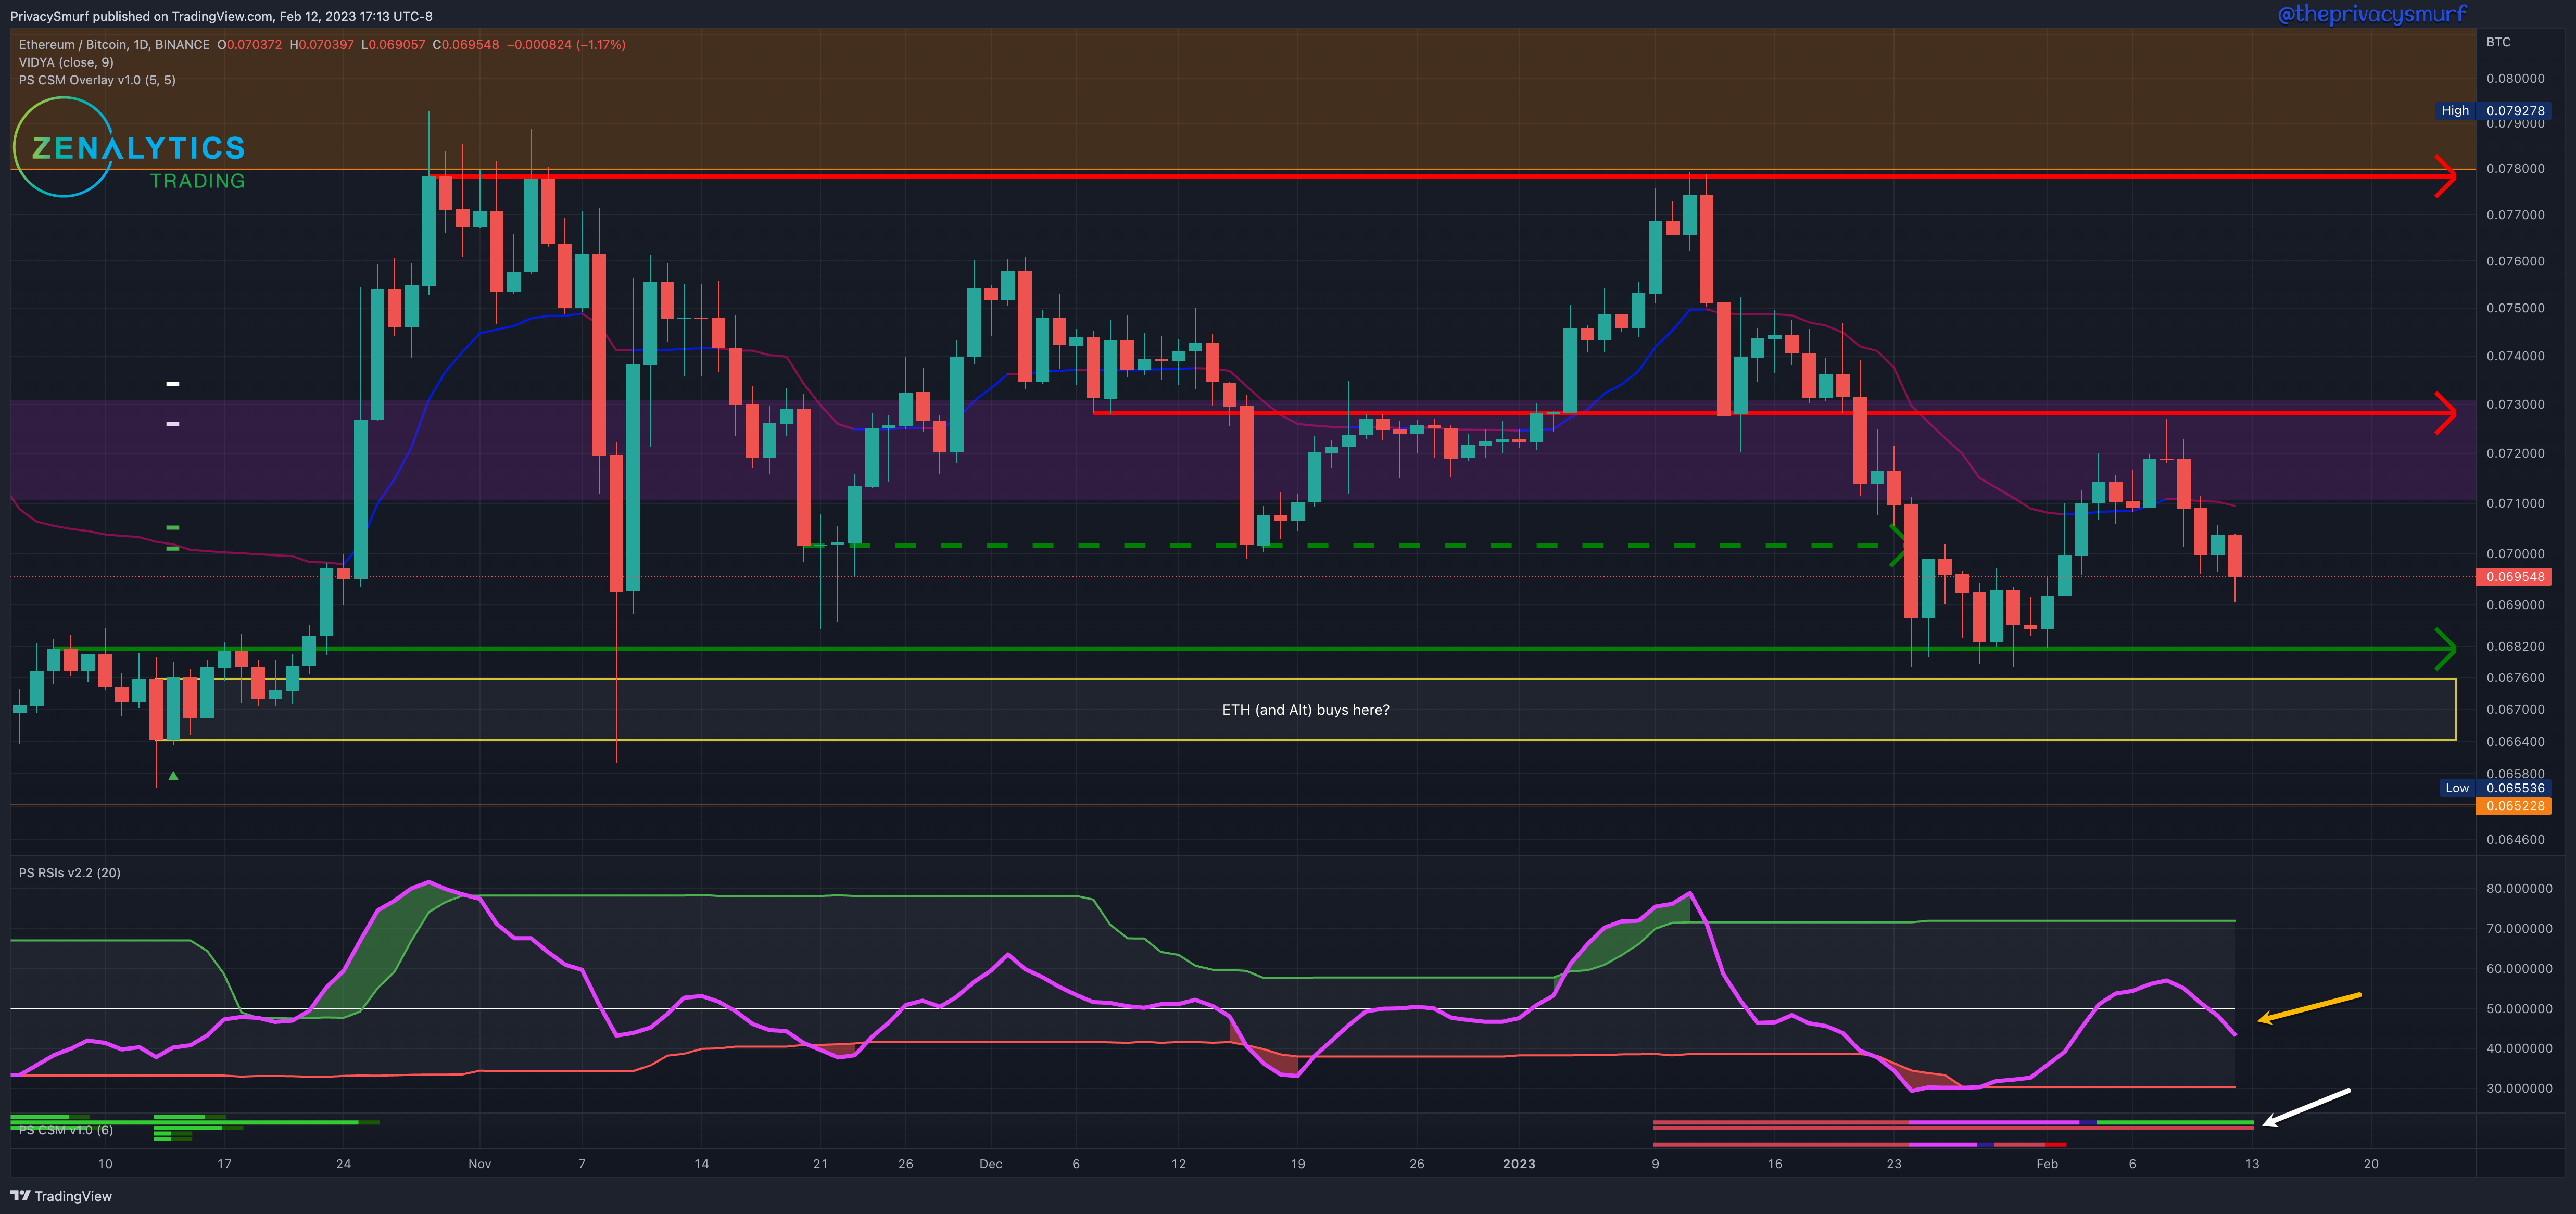
From last week:
”… leaving ranges as they are at 0.068 and 0.073… Both directions are about as equally potential… bias this week is neutral…”
Taking no new positions was not a bad choice for the week as the chart tested the high of the range and then plummeted toward the low. The RSI (yellow arrow) managed to stay above the midline for a few days and failed back below the end of the week. Being below the midline suggests bearish pressure remains on prices. The Correction Strength Meter (white arrow) also shows the mixed signals plotting both green and red (bullish and bearish divergences) on separate oscillators. Range trading on ETH and Alts may be the plays to do for the next week or two. Trend-following methods may not be reliable.
Given the current technicals for the week, I’m leaving ranges as they are at 0.068 and 0.073. It’s a waiting game now and buying supports and selling resistances biding time until we break below and cause bullish divergences or break higher and invalidate bearish divergences. My bias this week is still neutral. I’m not expecting a new trend to form yet. This may end up being a higher low if we pivot straight up from here, but I’m watching for cues on the 2HR-4HR timeframes for bullish divergences though. If those trigger trade conditions, this may be a lower high for an eventual new bullish trend shift. It’s a risky trade though that I personally wouldn't take given the signal would likely appear smack in the middle of the daily trading range and would have no supports nearby to back up the trade idea.
ETH/USDT Daily Chart
https://www.tradingview.com/chart/xbB6lkZu/
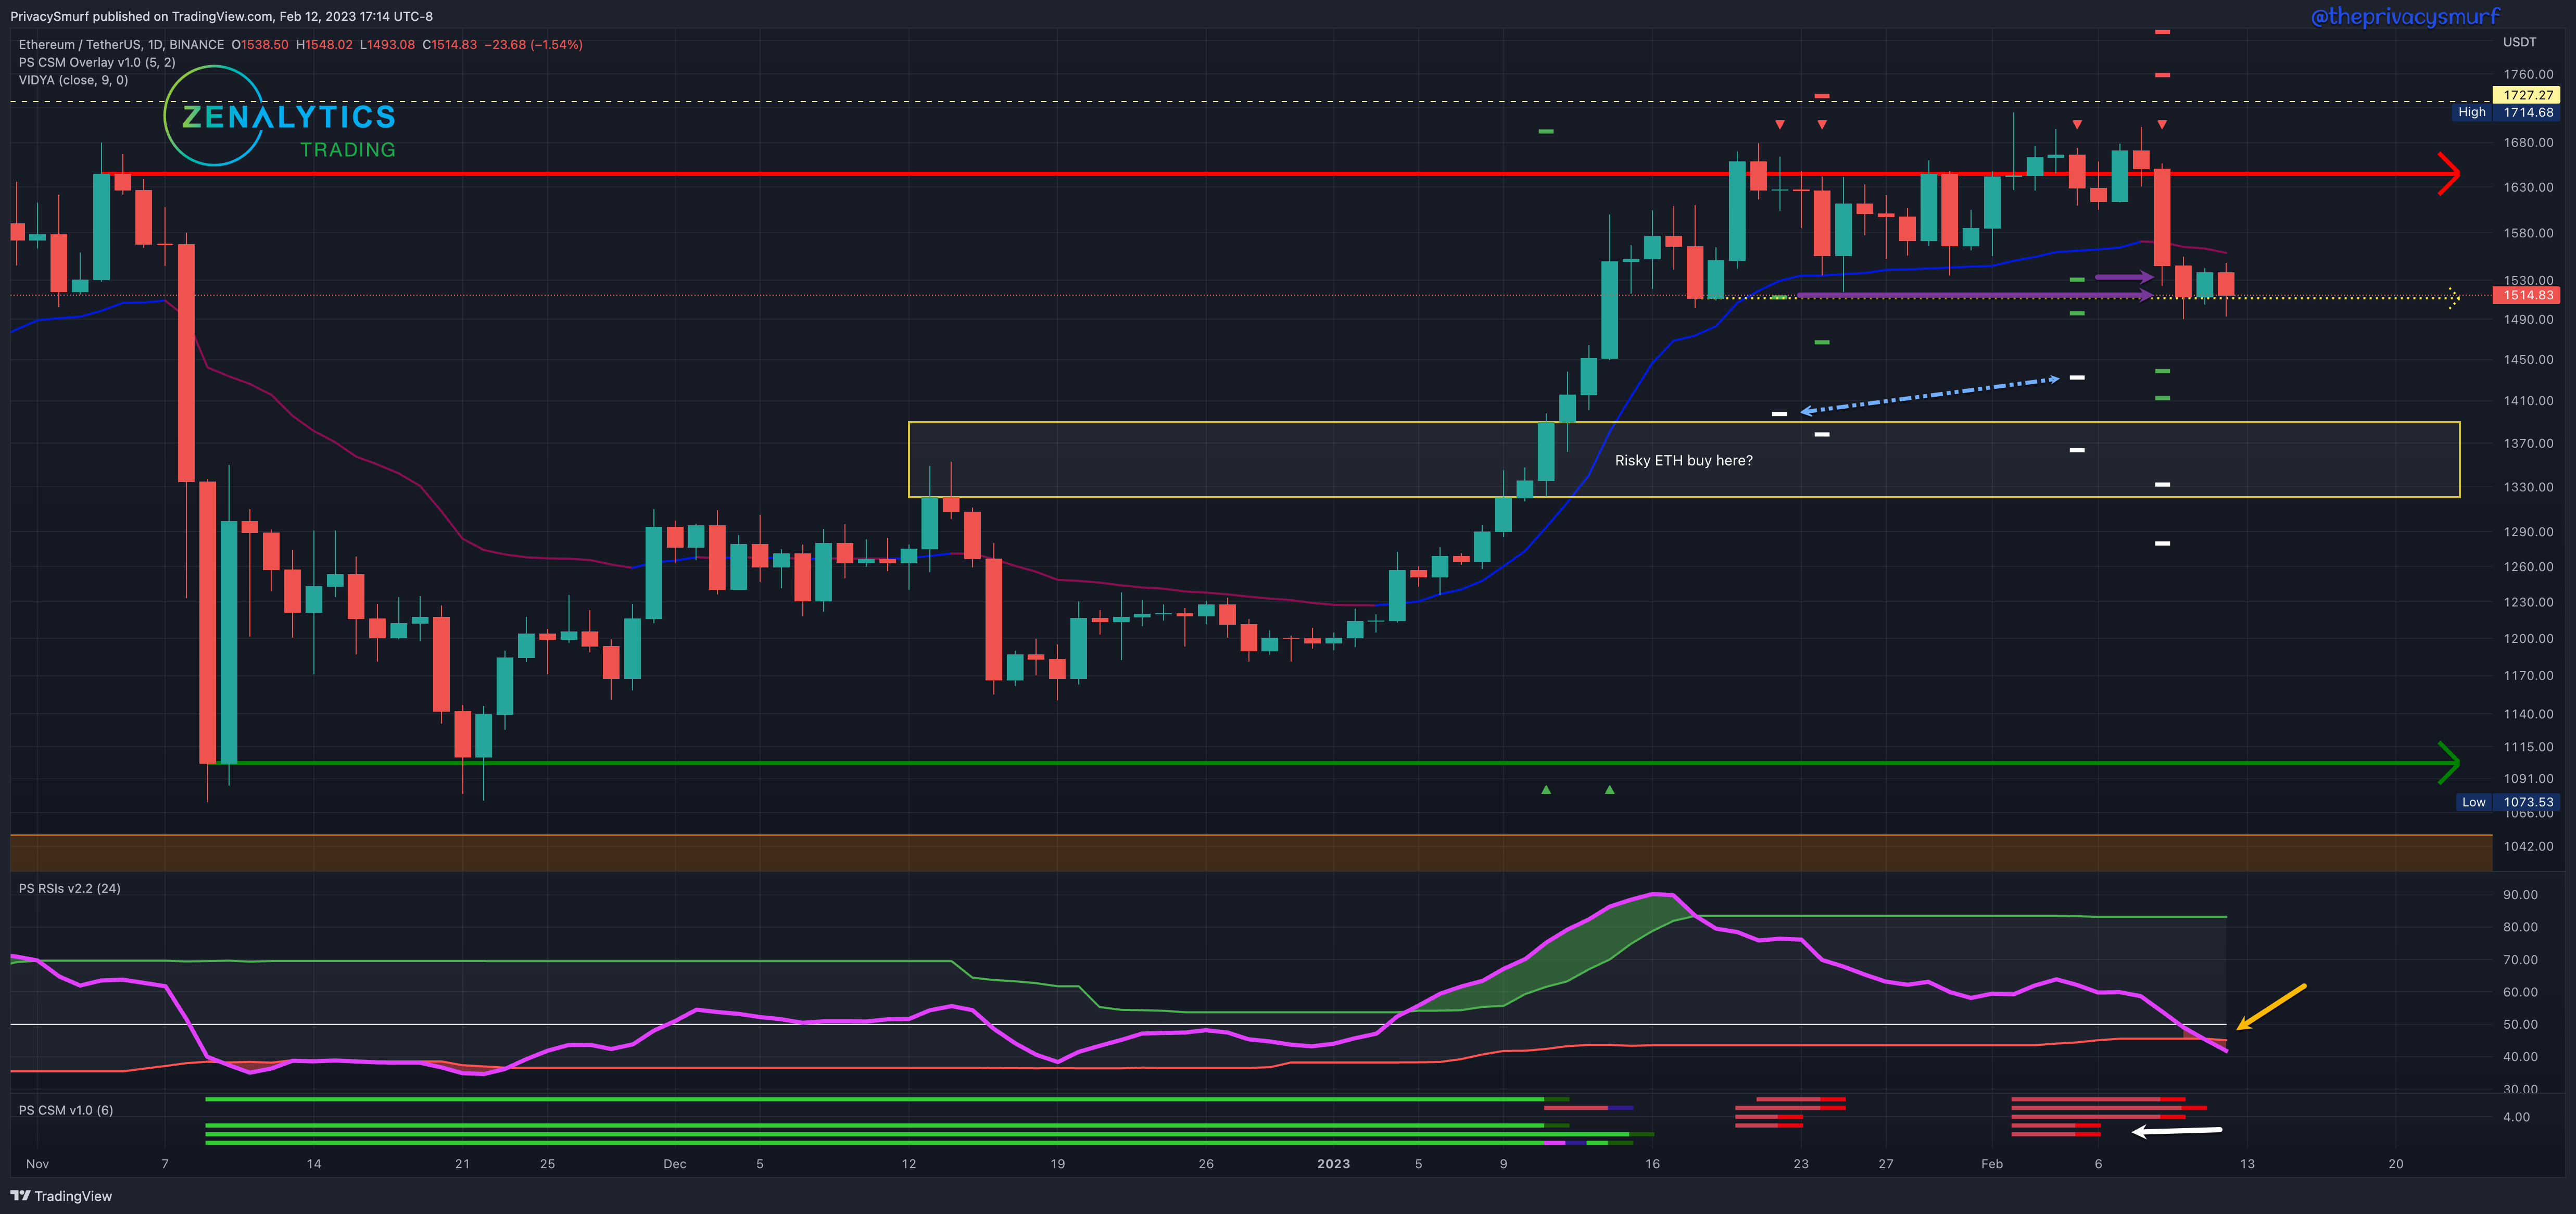
From last week:
“… bearish trades signaled with targets by the purple arrows around $1500… A decline is probably coming…”
Same as with BTC, the expected decline showed up this week. The higher level resistance held and prices plummeted midweek. Initial bearish targets from the CSM were hit (purple arrows). Prices are sitting just above the last lowest close before the structure is lost at $1514. The secondary targets from the CSM (blue dashed arrows) sit just above a zone created from the last resistance breaking which may now be potential support.
Given the current technicals for the week, I’m lowering the bottom of the range making the range $1400 - $1700, although I’m not anticipating prices above $1640. It’s always possible though. My bias this week is bearish. With the RSI now below the midline and breaking below the bottom band, there is an expectation of bearish impulsivity to come unless the RSI can curl back into the band in the next day or two. The bullish price structure I don’t expect to hold as lower intraday timeframe bullish divergences have either hit targets or been invalidated. The buy side is not present on ETH at the moment. It’s something to monitor though on the lower timeframes 2HR and under when prices dip below $1490 again. A risky buy may be on the table if prices dip below $1400 as prices may rebound from the former resistance.
With many of the coding projects complete, I’ll start sharing them with some videos. I think an easy way to do that until I get good enough to make web apps is to make an interactive notebook in google colab. Don’t worry. I’ll include some videos.
@theprivacysmurf