

SS #69: All the Boys I Know
SS #69: All the Boys I Know
Chasin out waves...

If you haven’t signed up for the new site please do. It’s where all my other content, free and paid has moved to.
zenalytics.info
Slowly I’m closing out of trades. Only 1 left from December and about half from January are still open but gradually moving to trailing stops. I did jump into a few more breakout trades here in the middle of the month but I’m not sure those will all end up with big runners like earlier in the year. It’s been interesting this year. The small and microcaps have been where all the action is. I mainly stick to the larger stuff but sometimes you just have to be where the movement is.
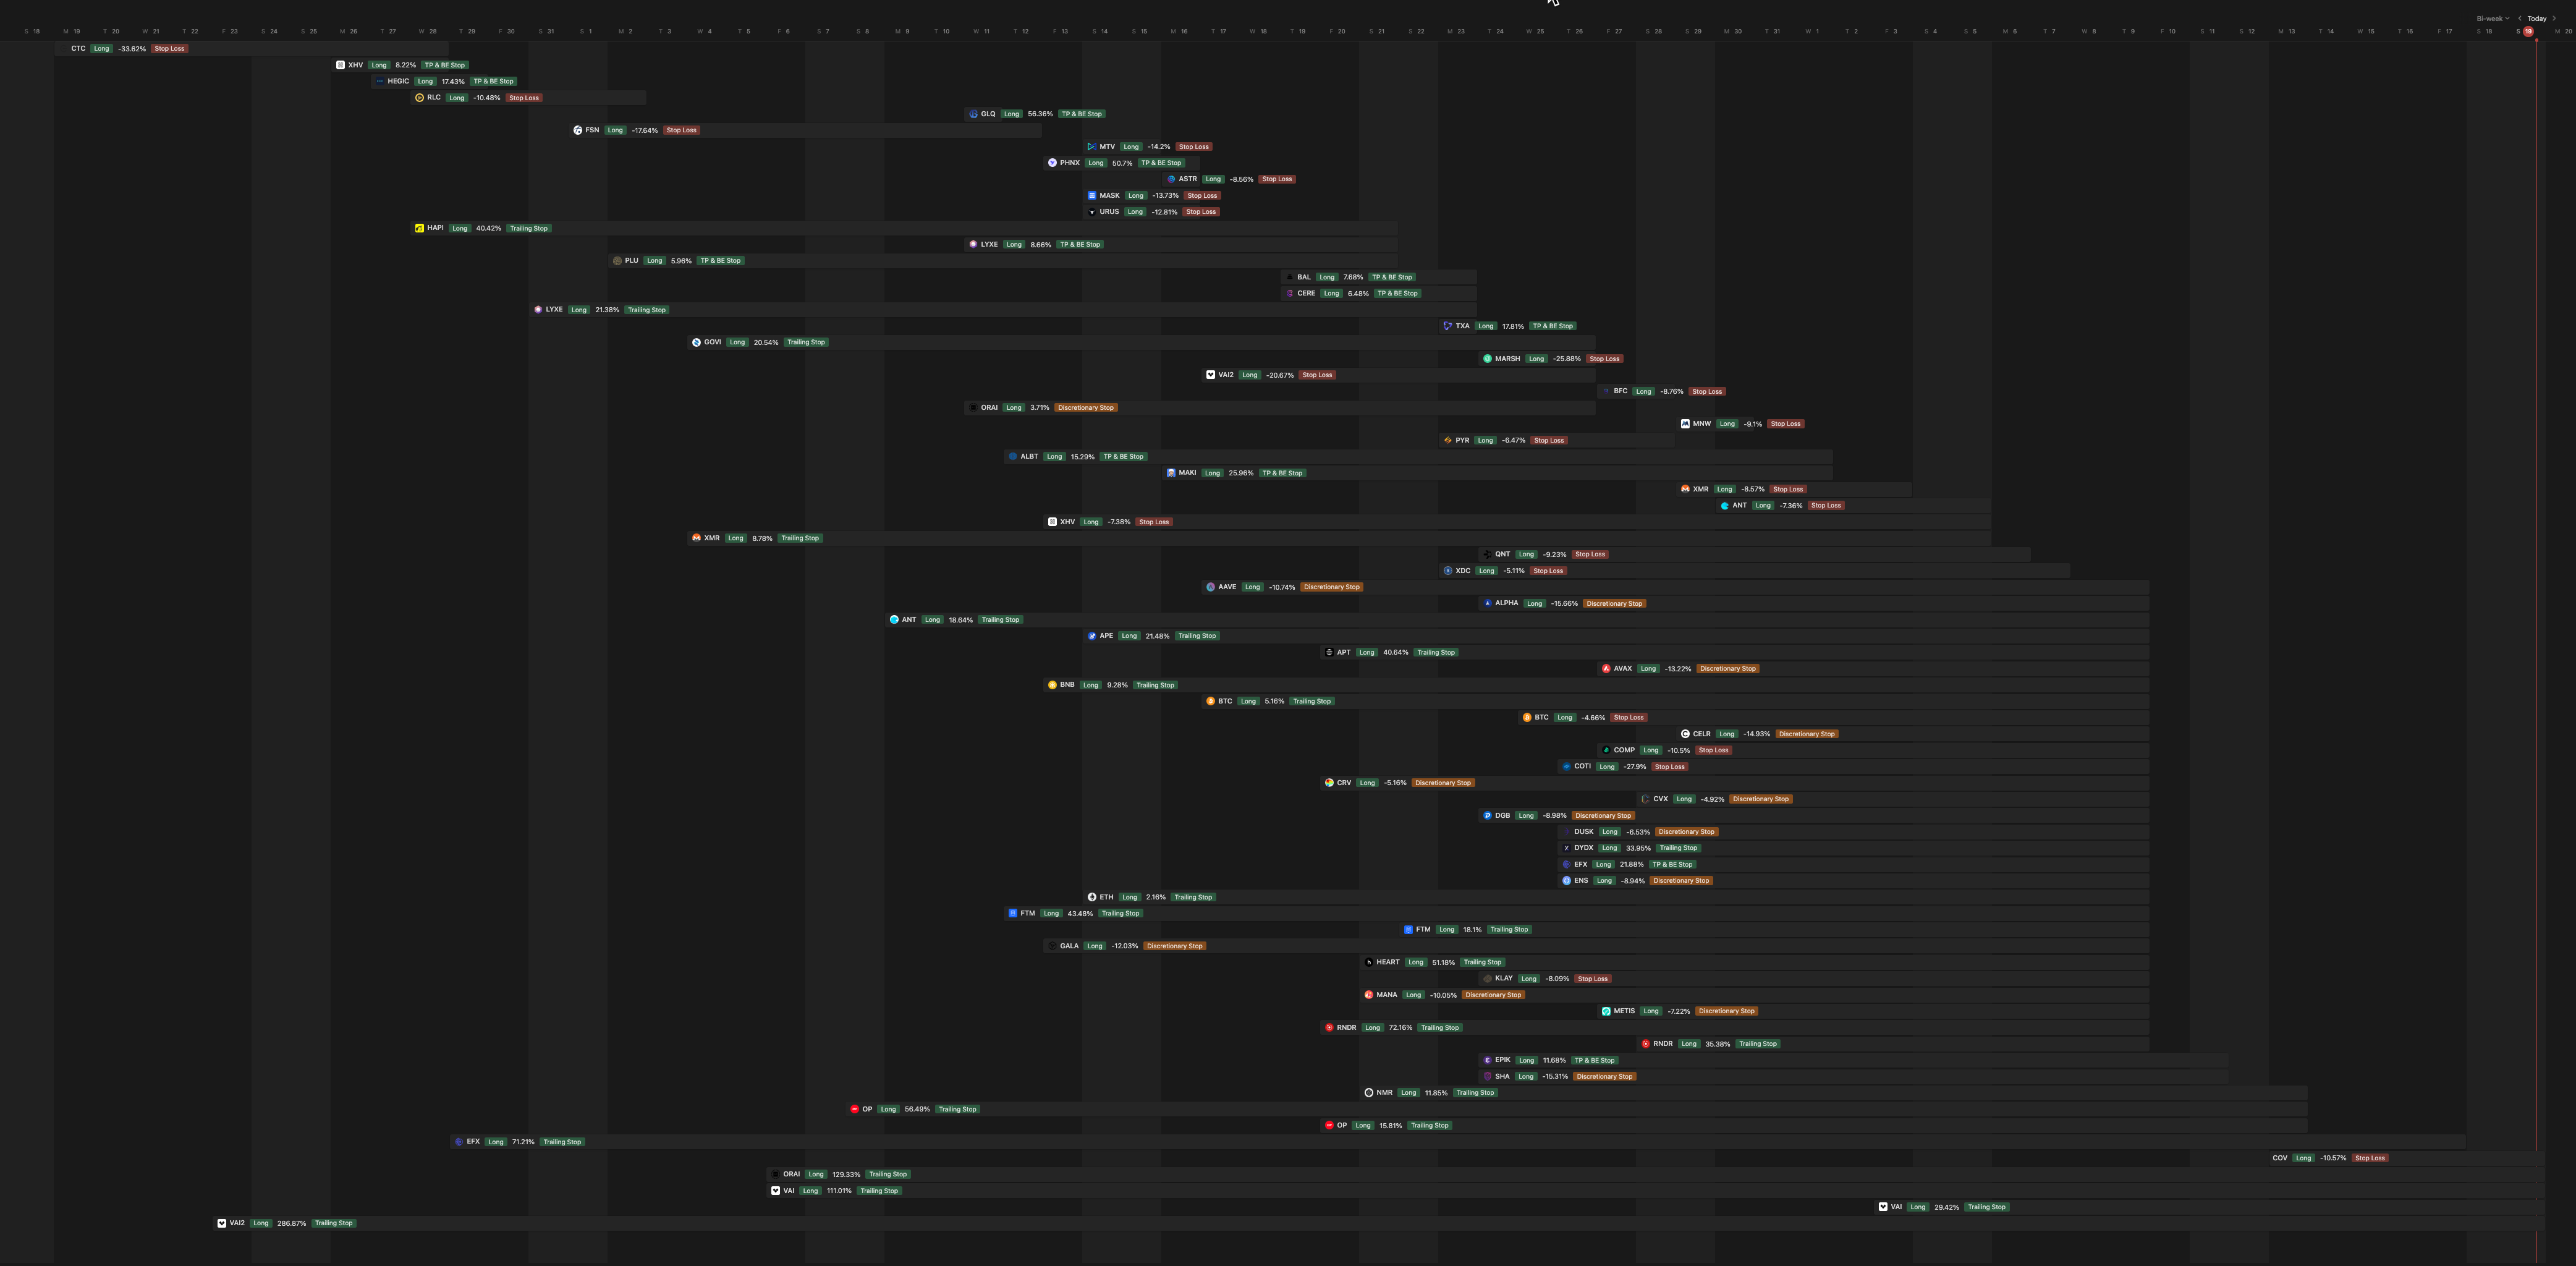
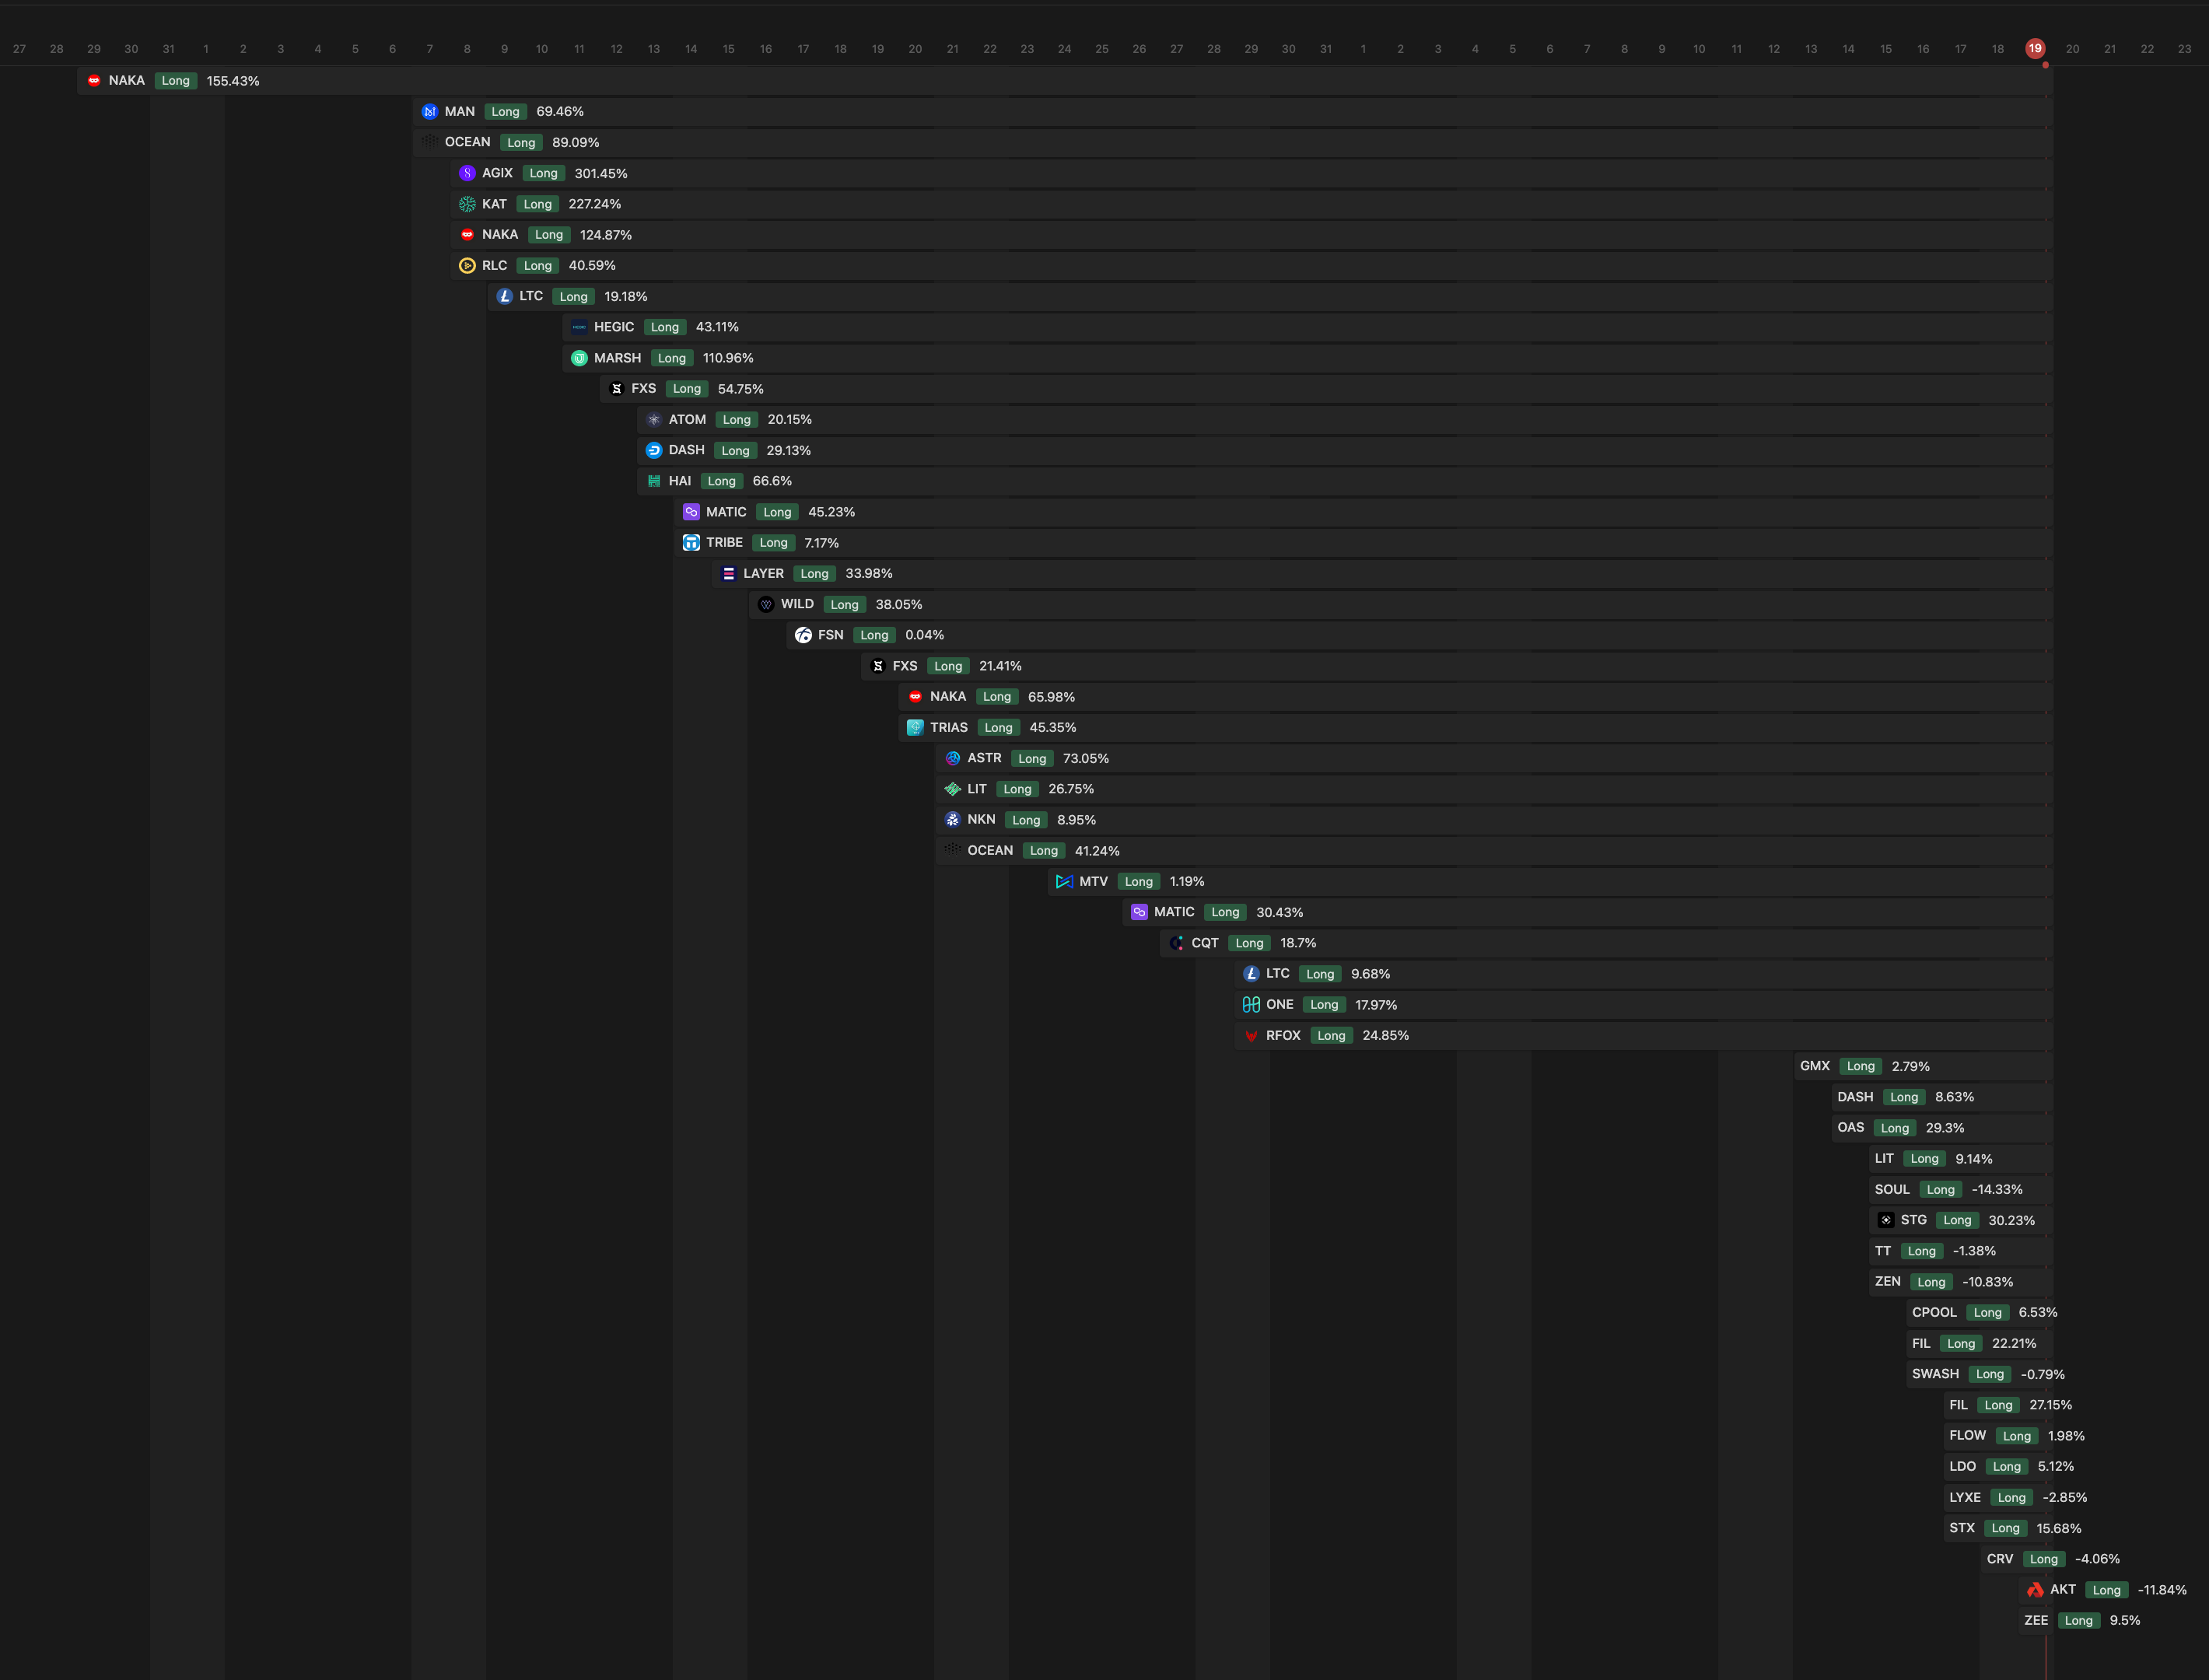
I date all the altcoins…
BTC/USDT Daily Chart
https://www.tradingview.com/chart/jjSdFW4b/
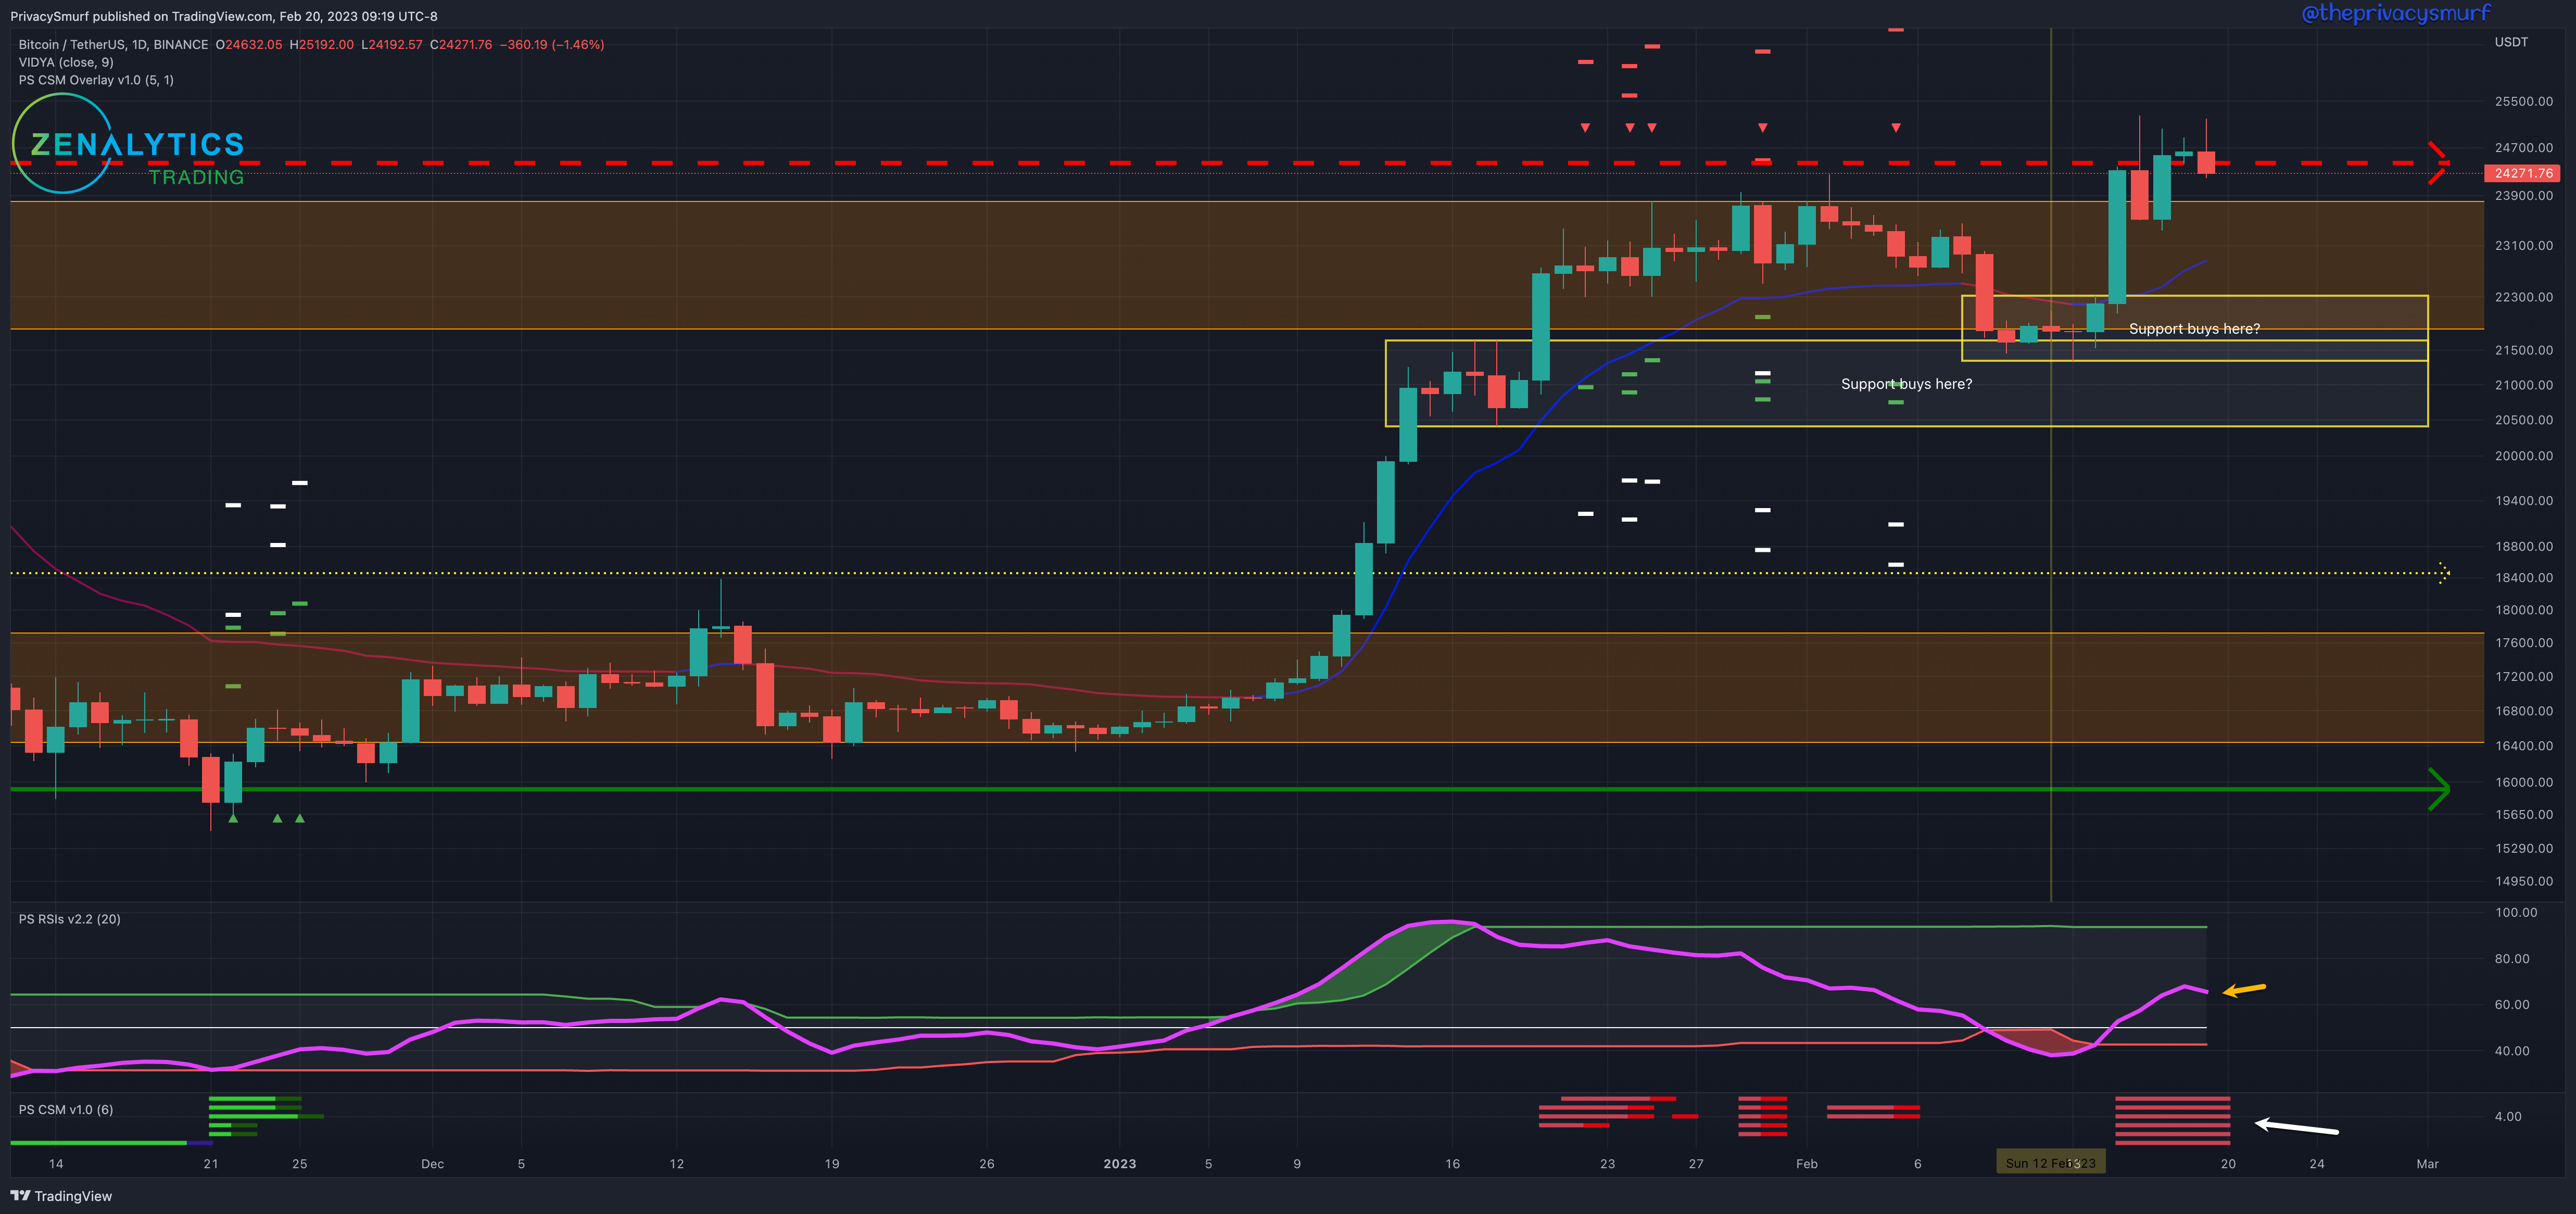
From last week:
”…I wouldn't expect a range bottom to be forming until the RSI can curl back up into the bands… leave the ranges as is… between $20k and $25k…”
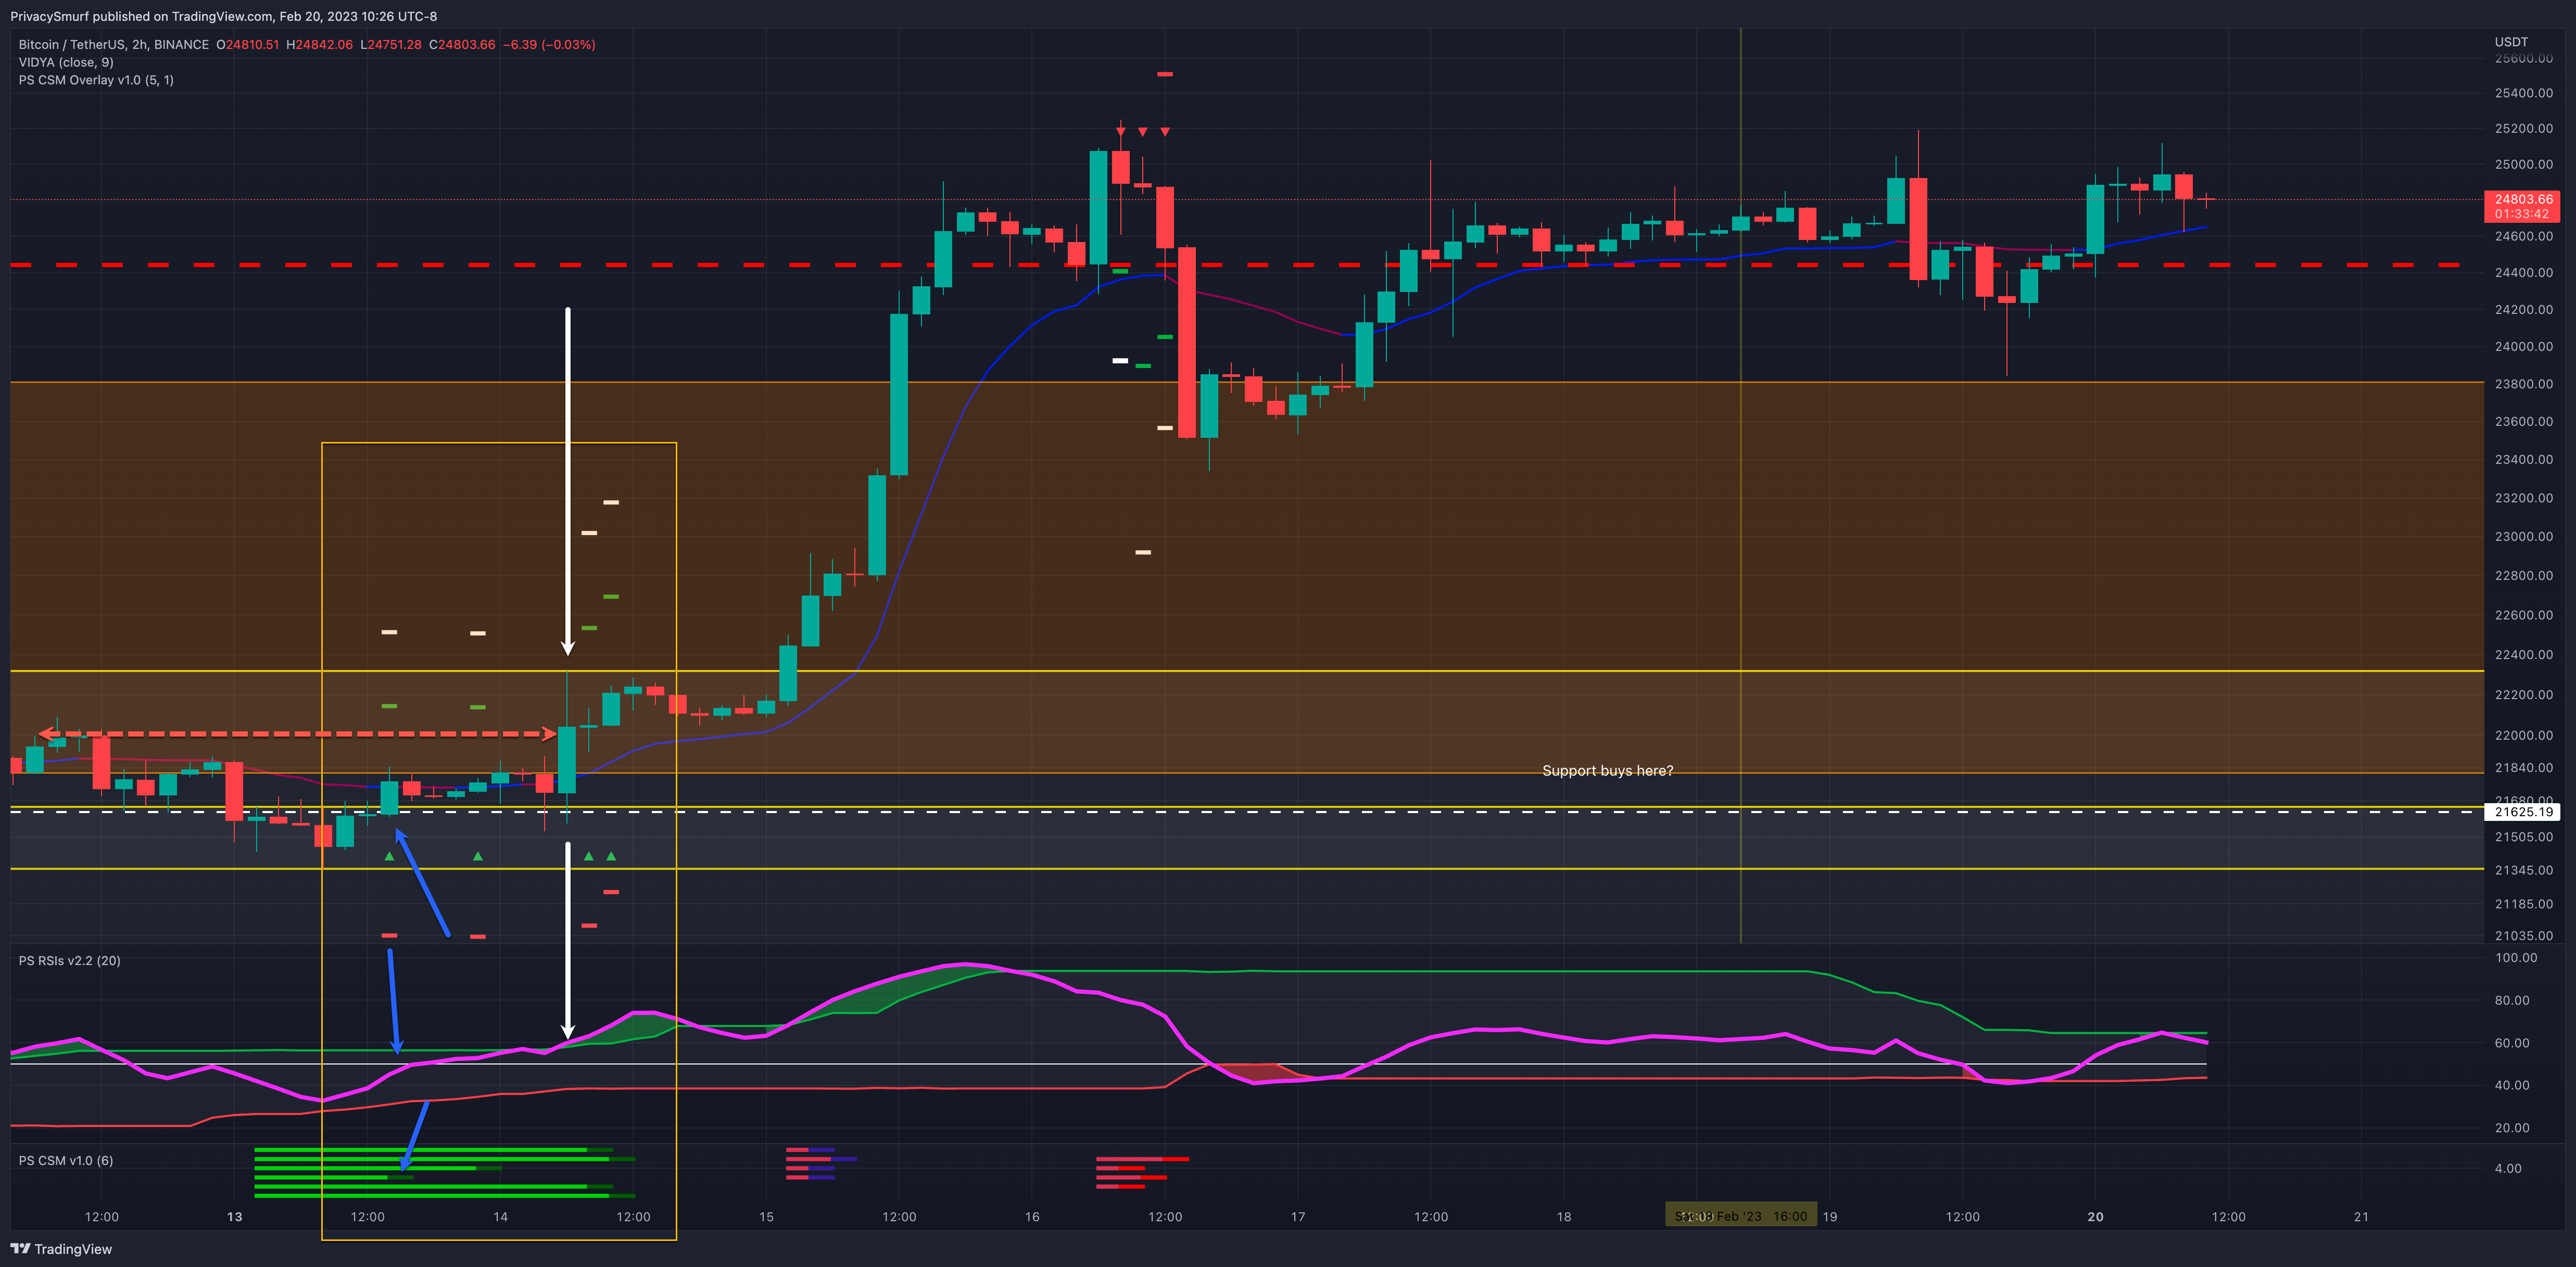
Bearish expectations didn't play out last week, but even so the signs of that invalidation did show. Early in the week, the RSI (yellow arrow) curled up back in between the bands. This suggests the normalization of price fluctuations and I generally assume the range low has been formed. The 2HR timeframe provided ample opportunity to take advantage of a precision entry of this daily chart event. The blue arrows show the first, yet risky bullish trade setup. My indicator the Correction Strength Meter signals a bullish trade (bottom blue arrow) while the RSI was in an optimal setup, the top band close to the midline with the possibility of the RSI breaking above both simultaneously. At this point, the RSI on the daily chart had still not moved back into the bands so this presents a riskier multi-timeframe setup. However, later on in the 2HR timeframe at the white arrows, the RSI breaks above the top band suggesting bullish impulsivity. At the same time on the price chart, a bullish engulfing candle plots that also closes above a prior resistance creating a higher high close. At this point, the RSI on the daily chart is also back inside the bands. This multi-timeframe confluence creates a low-risk opportunity for a precision entry on the daily timeframe chart.
While the daily chart may be invalidating the current resistance around $24.5k the prices are still bearish and divergent from the RSI. This suggests an eventual decline unless momentum continues to increase. The latest high also reset up a full bearish divergence on all oscillators shown by the CSM at the bottom of the chart (white arrow).
Given the week's current technicals, I’m increasing the ranges to pricing between $21k and $27k. This is a wide range and I’m not really expecting the upper ends of it but regardless of the bearish divergence one can’t ignore that prices are setting higher lows and higher highs. A retracement is on the horizon but that doesn't discount that one needs to trade what’s happening on the charts. Prices can remain irrational more than we think so just because I’m expecting a retracement doesn't mean we can’t blast up to the stop losses of shorts to capture liquidity for the downside move. My bias this week is bullish with caution. This is due to the RSI’s presentation. I will be watching for a retracement to the support zones. Ideally, prices don’t retrace and close lower than $25.3k. This would start to negate the bullish structure. I would consider reentering long positions at that level for a swing trade given lower timeframes 20min to 2HR have bullish divergences percent at that time. I’ve added two lower zones that I’d consider buying into the larger daily trend if a retracement ended up deeper but they become riskier entries since the bullish structure would be lost. There would HAVE to be bullish divergences on higher intraday timeframes 4HR to 6HR for me to take a support buy there.
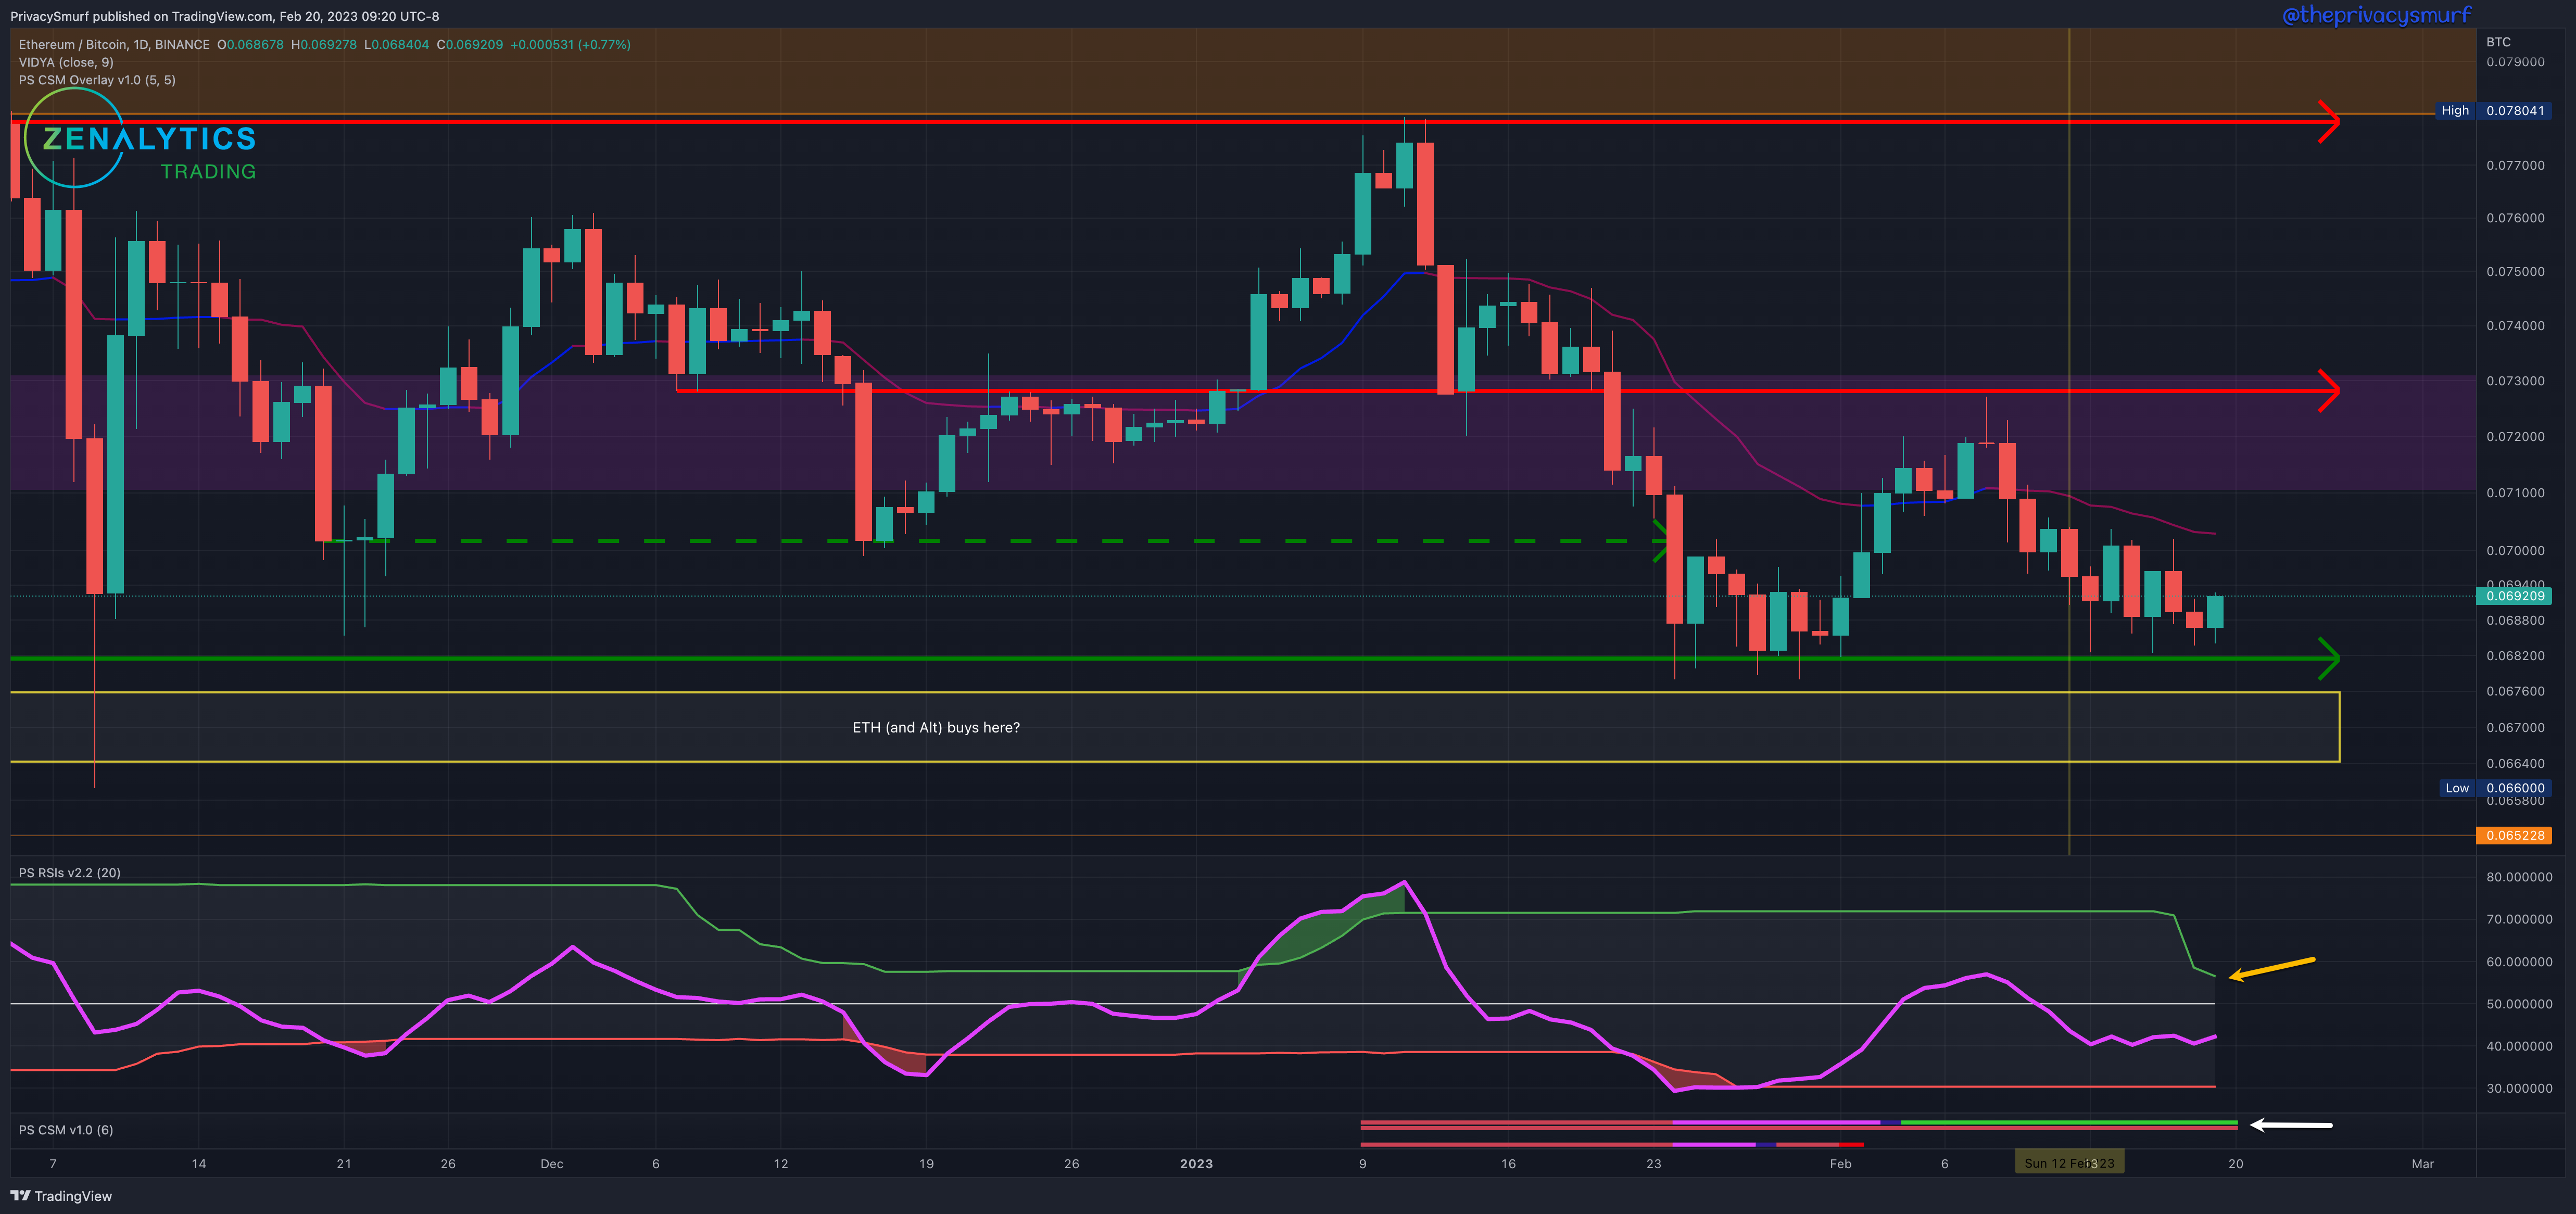
ETH/BTC Daily Chart
https://www.tradingview.com/chart/gTkSjkj6/
From last week:
”… leaving ranges as they are at 0.068 and 0.073… bias this week is neutral… not expecting a new trend to form…”
Neutrality was not a bad position for the week ended up closing the week only half a percent from where it opened. The RSI (yellow arrow) stayed below the midline which suggests bearish pressure remains on prices. The Correction Strength Meter (white arrow) also shows the mixed signals plotting both green and red (bullish and bearish divergences) on separate oscillators. Range trading on ETH and Alts may be the plays to do for the next week or two. Trend-following methods may not be reliable. The adaptive top band of the RSI has moved down closer toward the midline. This shows the potential for bullish impulsivity in the future as it creates a sort of ceiling of normal RSI volatility.
Given the current technicals for the week, I’m leaving ranges as they are at 0.068 and 0.073. It’s a waiting game now and buying supports and selling resistances biding time until we break below and cause bullish divergences or break higher and invalidate bearish divergences. My bias this week is still neutral. I’m not expecting a new trend to form yet. This still may end up being a higher low if we pivot straight up from here as we haven't closed with a lower low yet, but I’m watching for cues on the 2HR-4HR timeframes for bullish divergences though. Ideally, we wick down to create a new lower low in price but a higher high on price action oscillators for bullish divergence.
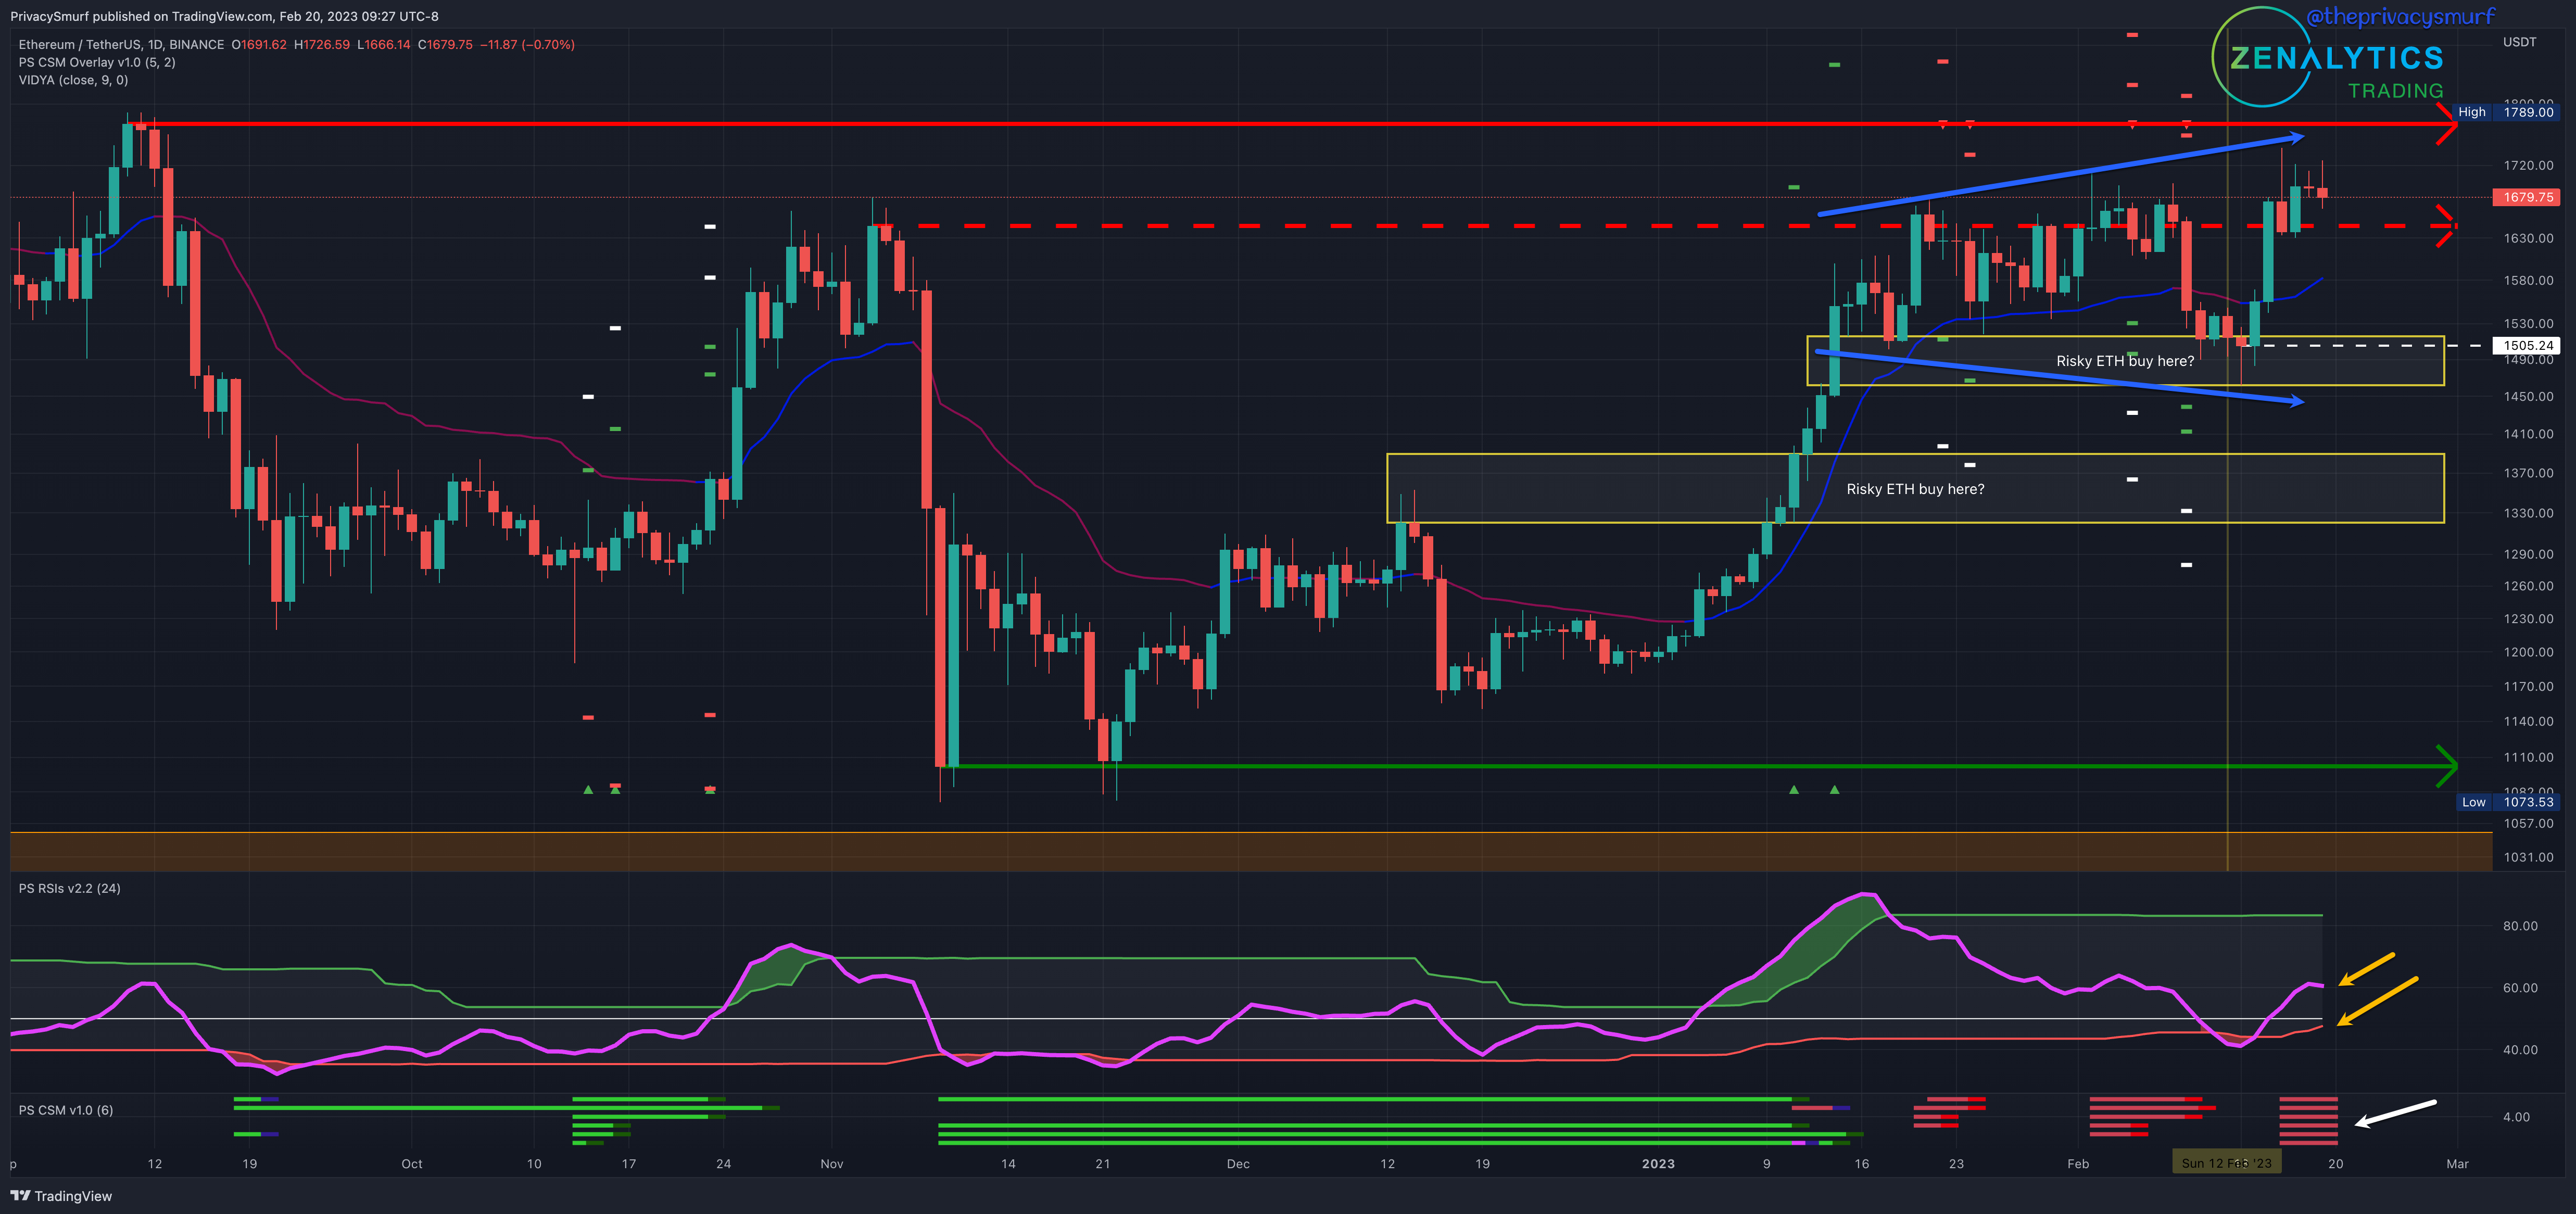
ETH/USDT Daily Chart
https://www.tradingview.com/chart/xbB6lkZu/
From last week:
“… making the range $1400 - $1700… expectation of bearish impulsivity to come unless the RSI can curl back into the band in the next day or two… monitor though on the lower timeframes 2HR and under when prices dip below $1490 again”
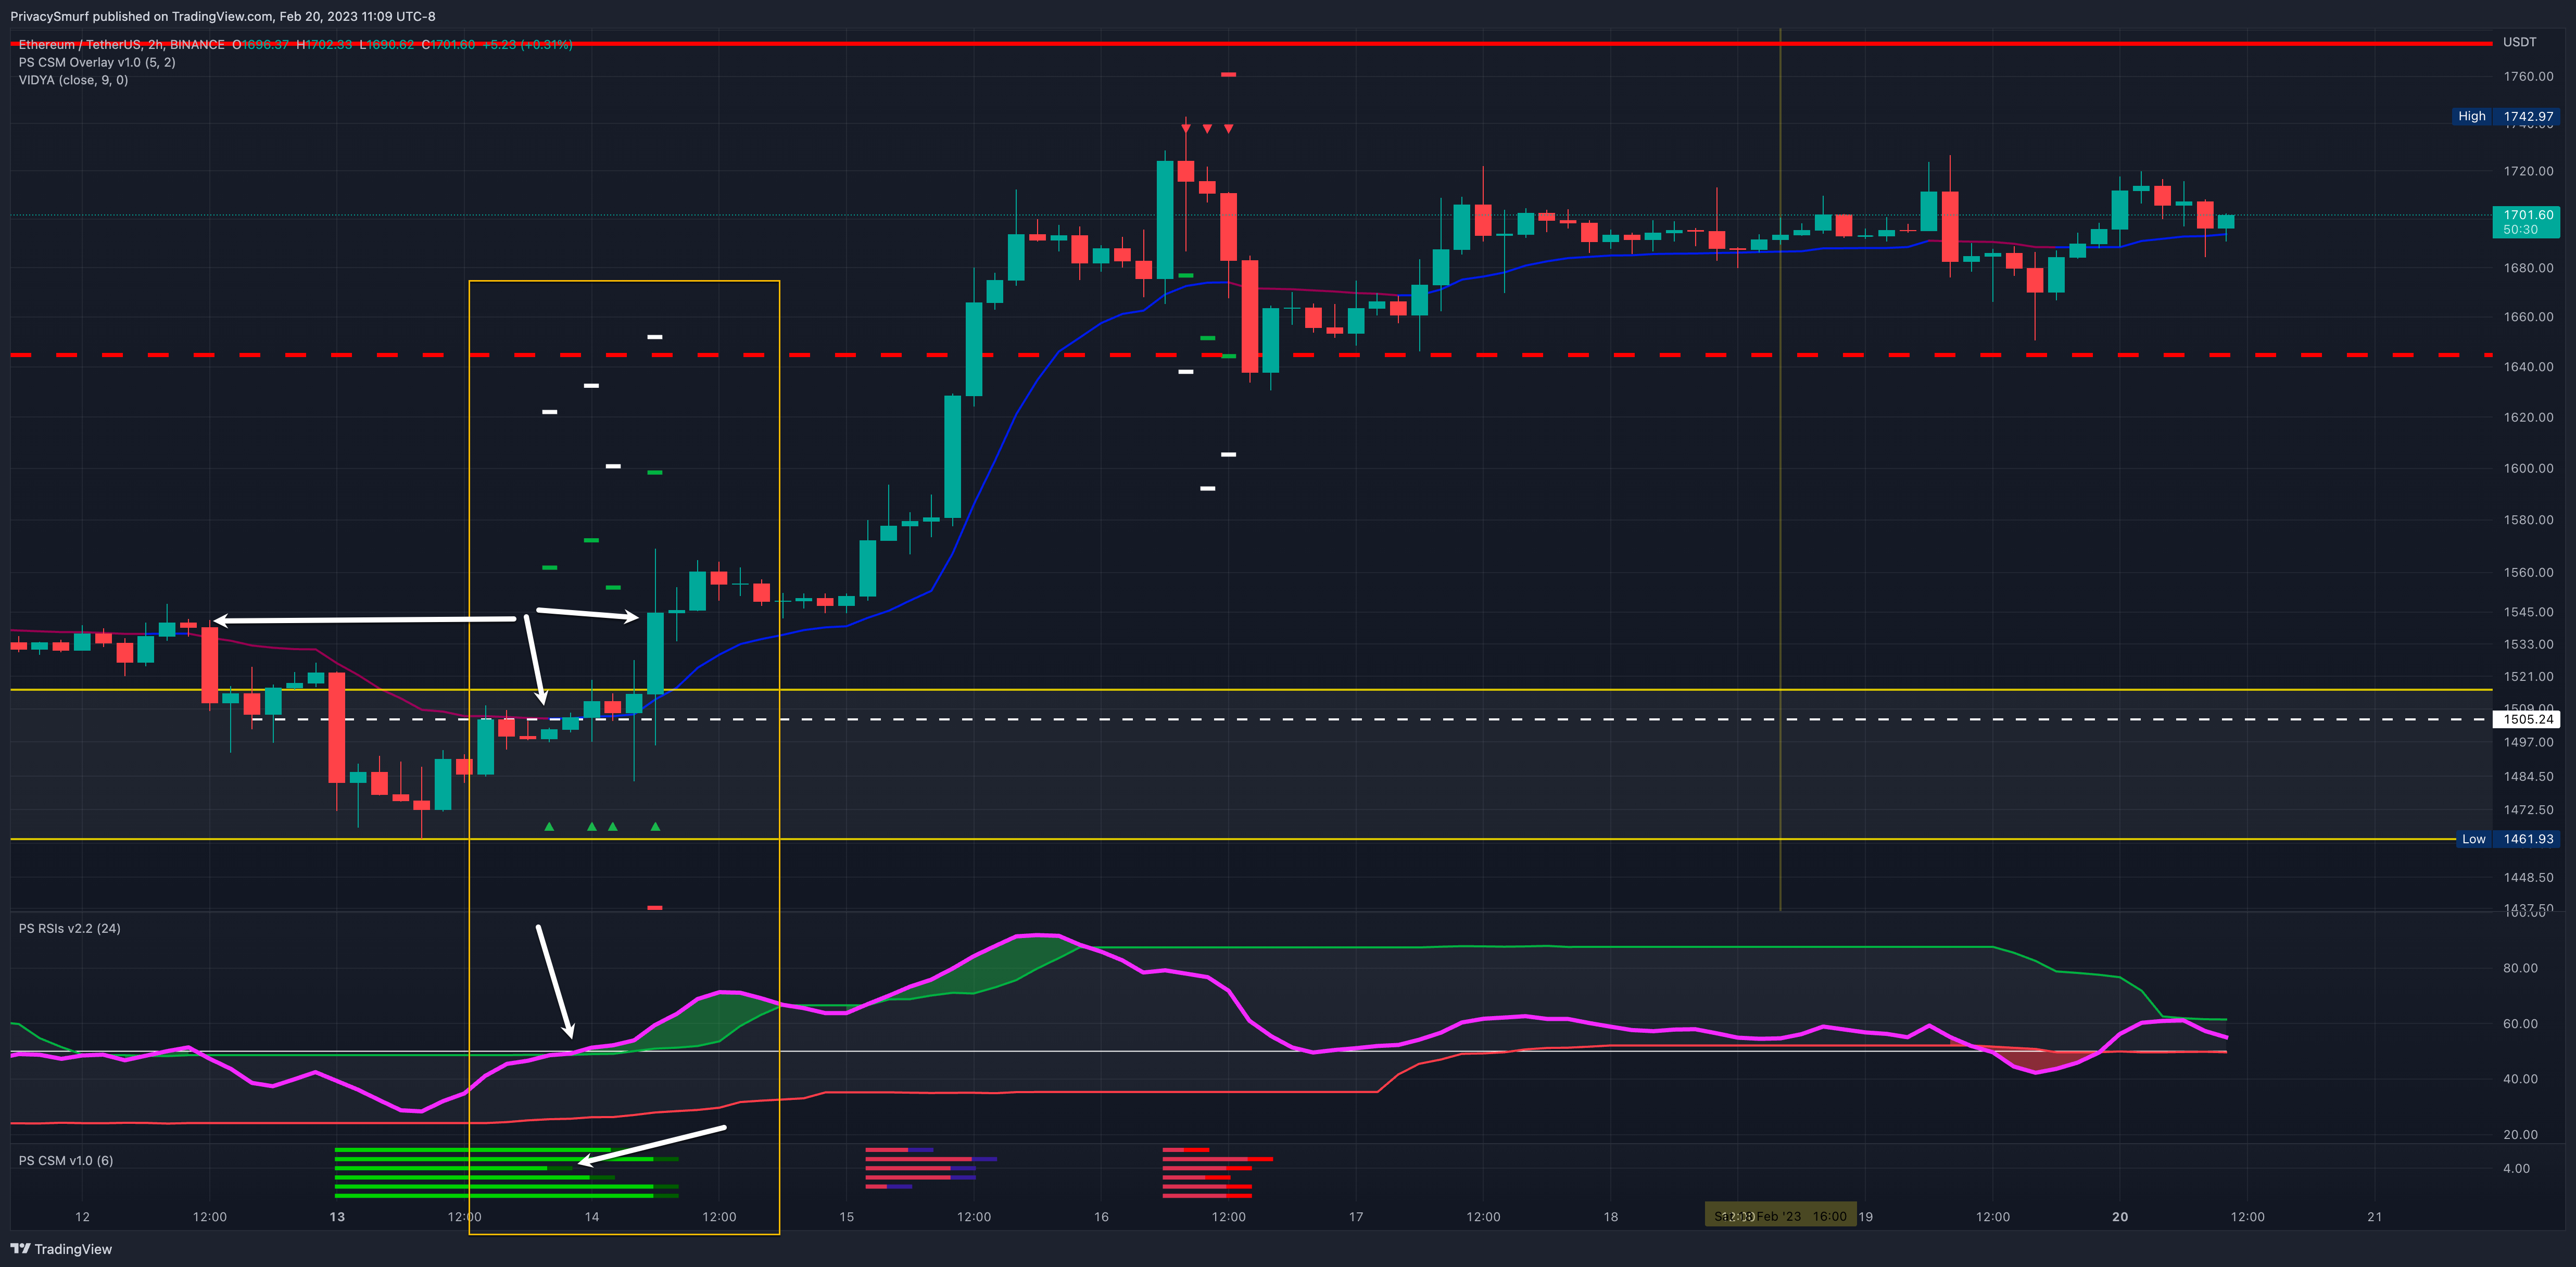
It was a very volatile week for ETH dipping down into the mid-$1400 and peaking above the range high into the $1700s. The exact same opportunity for a multi-timeframe precision entry existed on the 2HR timeframe here as well as BTC shown with the white arrows. I’m not going to retype the scenario. You can scroll up and reread it if necessary.
With expectations of ETH/BTC wicking lower, there is an added confluence here with the RSI (yellow arrows) showing an increased possibility of bearish impulsivity if the RSI continues the curl down and breaks below the midline and bottom band. I’m not a big fan of most chart patterns but I am a fan of market theory. A rising broadening wedge is present on the daily chart shown by the blue arrows. The theory behind this behavior and increased ranging volatility suggests distribution, the large-scale selling of assets from big volume players into retail FOMO before a markdown in prices. This theoretical occurrence with a matching bearish divergence with the RSI, and bearish presentation of the ETH/BTC chart paints a bearish picture. This is all still subjective and not a technical reason to act. I’d wait for the structure to actually shift to bearishness to position myself to the short side.
Given the current technicals for the week, I’m increasing the range making it $1500 - $1800. Similar to BTC, just because I’m still anticipating an eventual decline, the chart is still mostly up and to the right, and one should just trade the chart. My bias this week is bullish with great caution. This is due to the RSI’s presentation. I will be watching for a retracement to the support zones. There are many places to evaluate potential entries during a retracement so it’s less a matter of me saying, watch this place and more a matter of watching the chart throughout the week for intraday bullish divergences on the 1HR to 2HR. When/if those appear that will be the place to evaluate reentry on a retracement. This is the problem that is created by increasing ranged volatility. There’s not 1 good place to look at.
@theprivacysmurf