

SS #70: Turn Back Time
SS #70: Turn Back Time
'I still think about you', bull market.

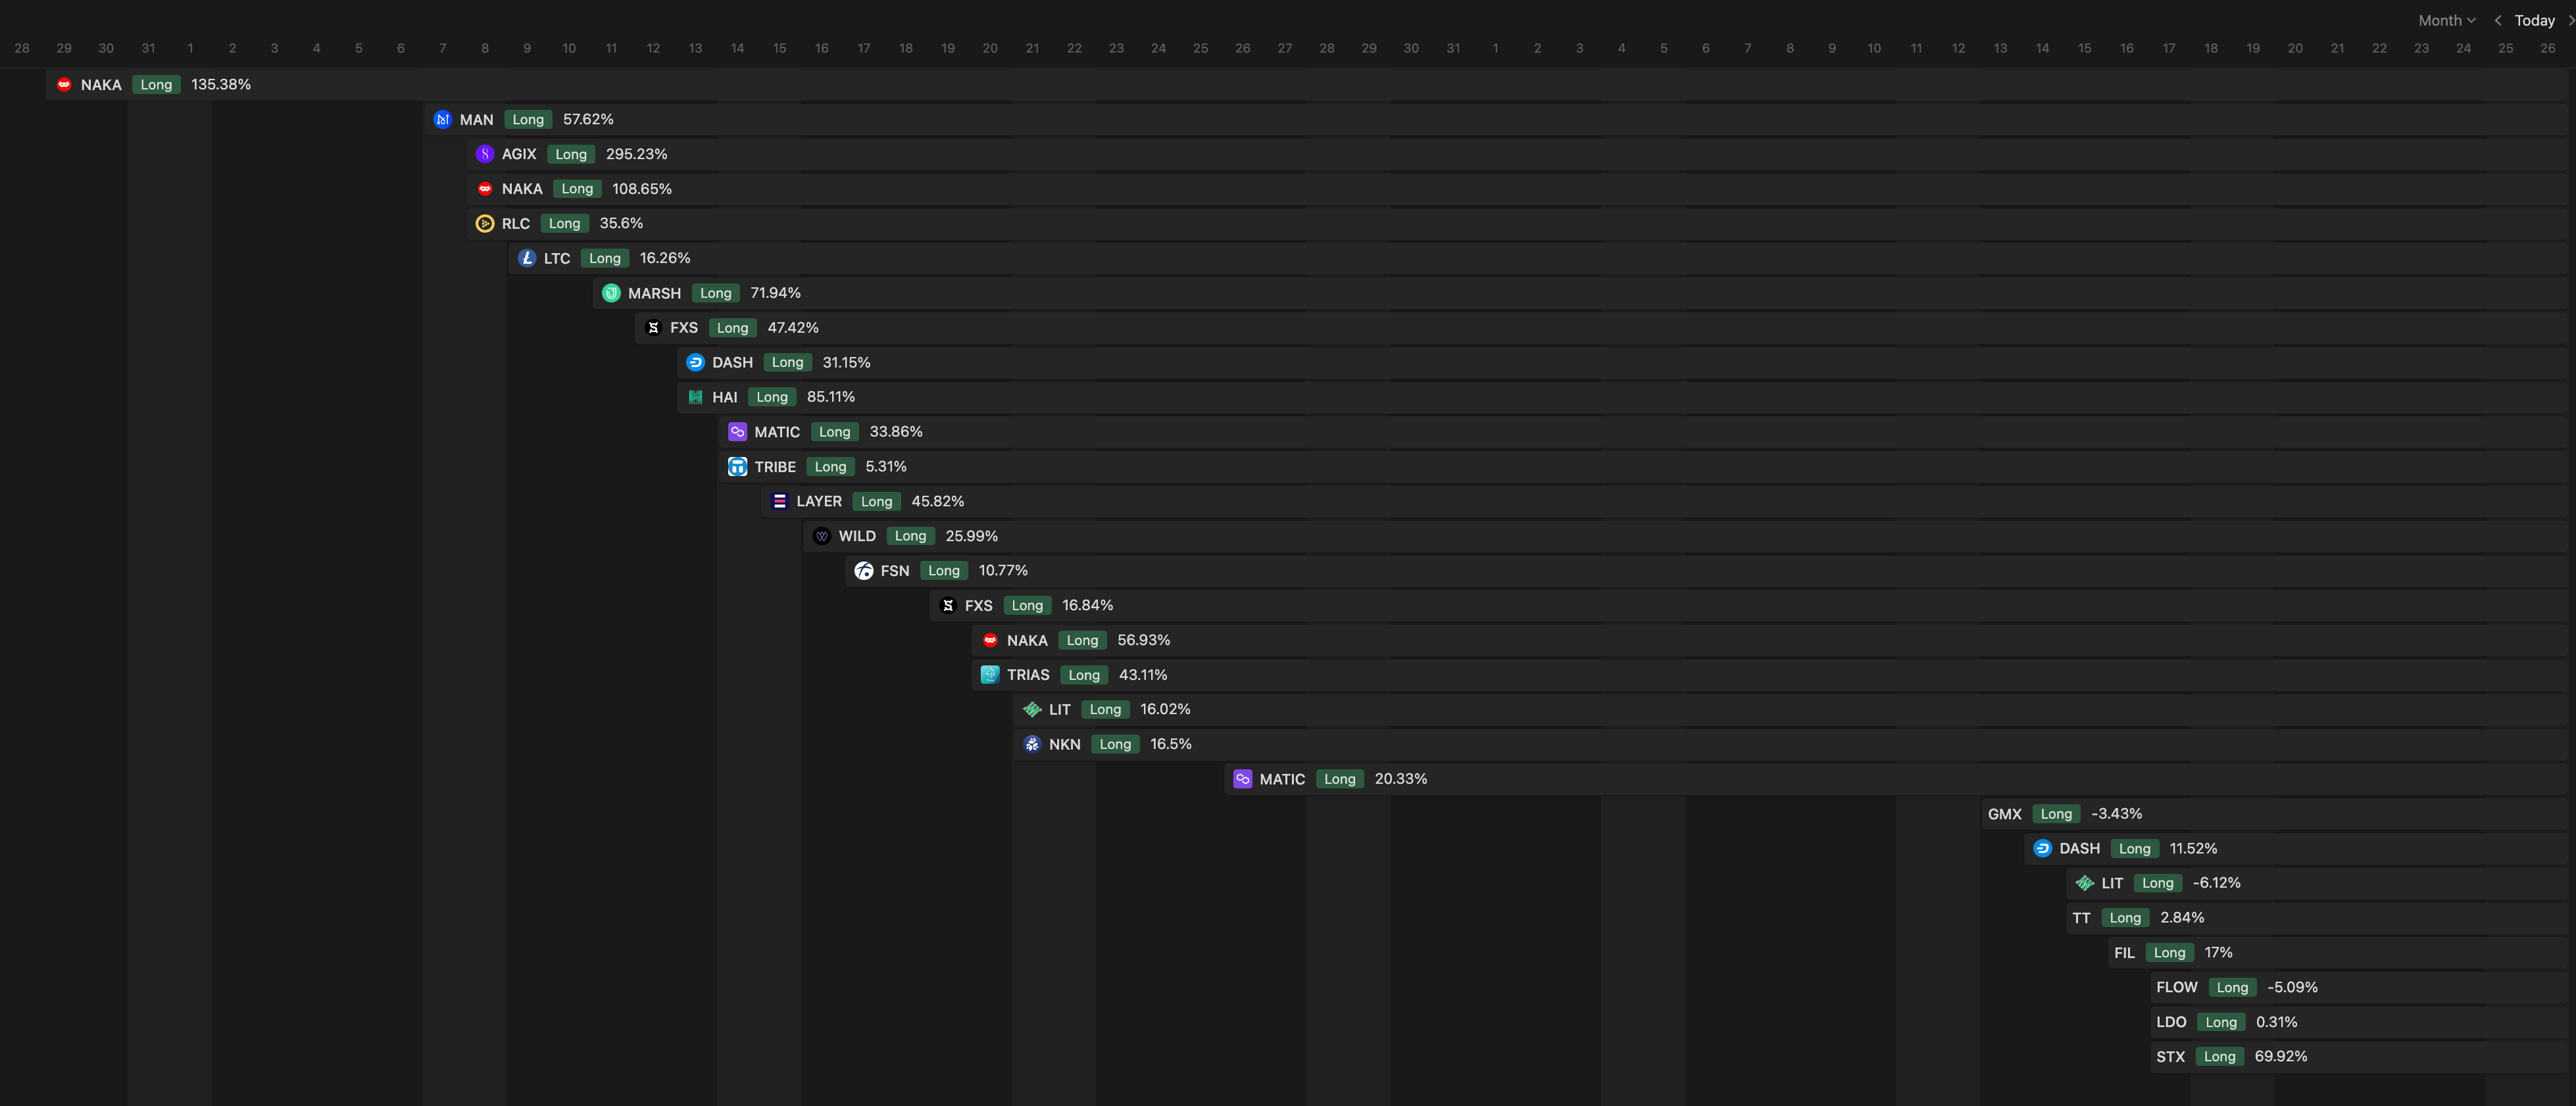
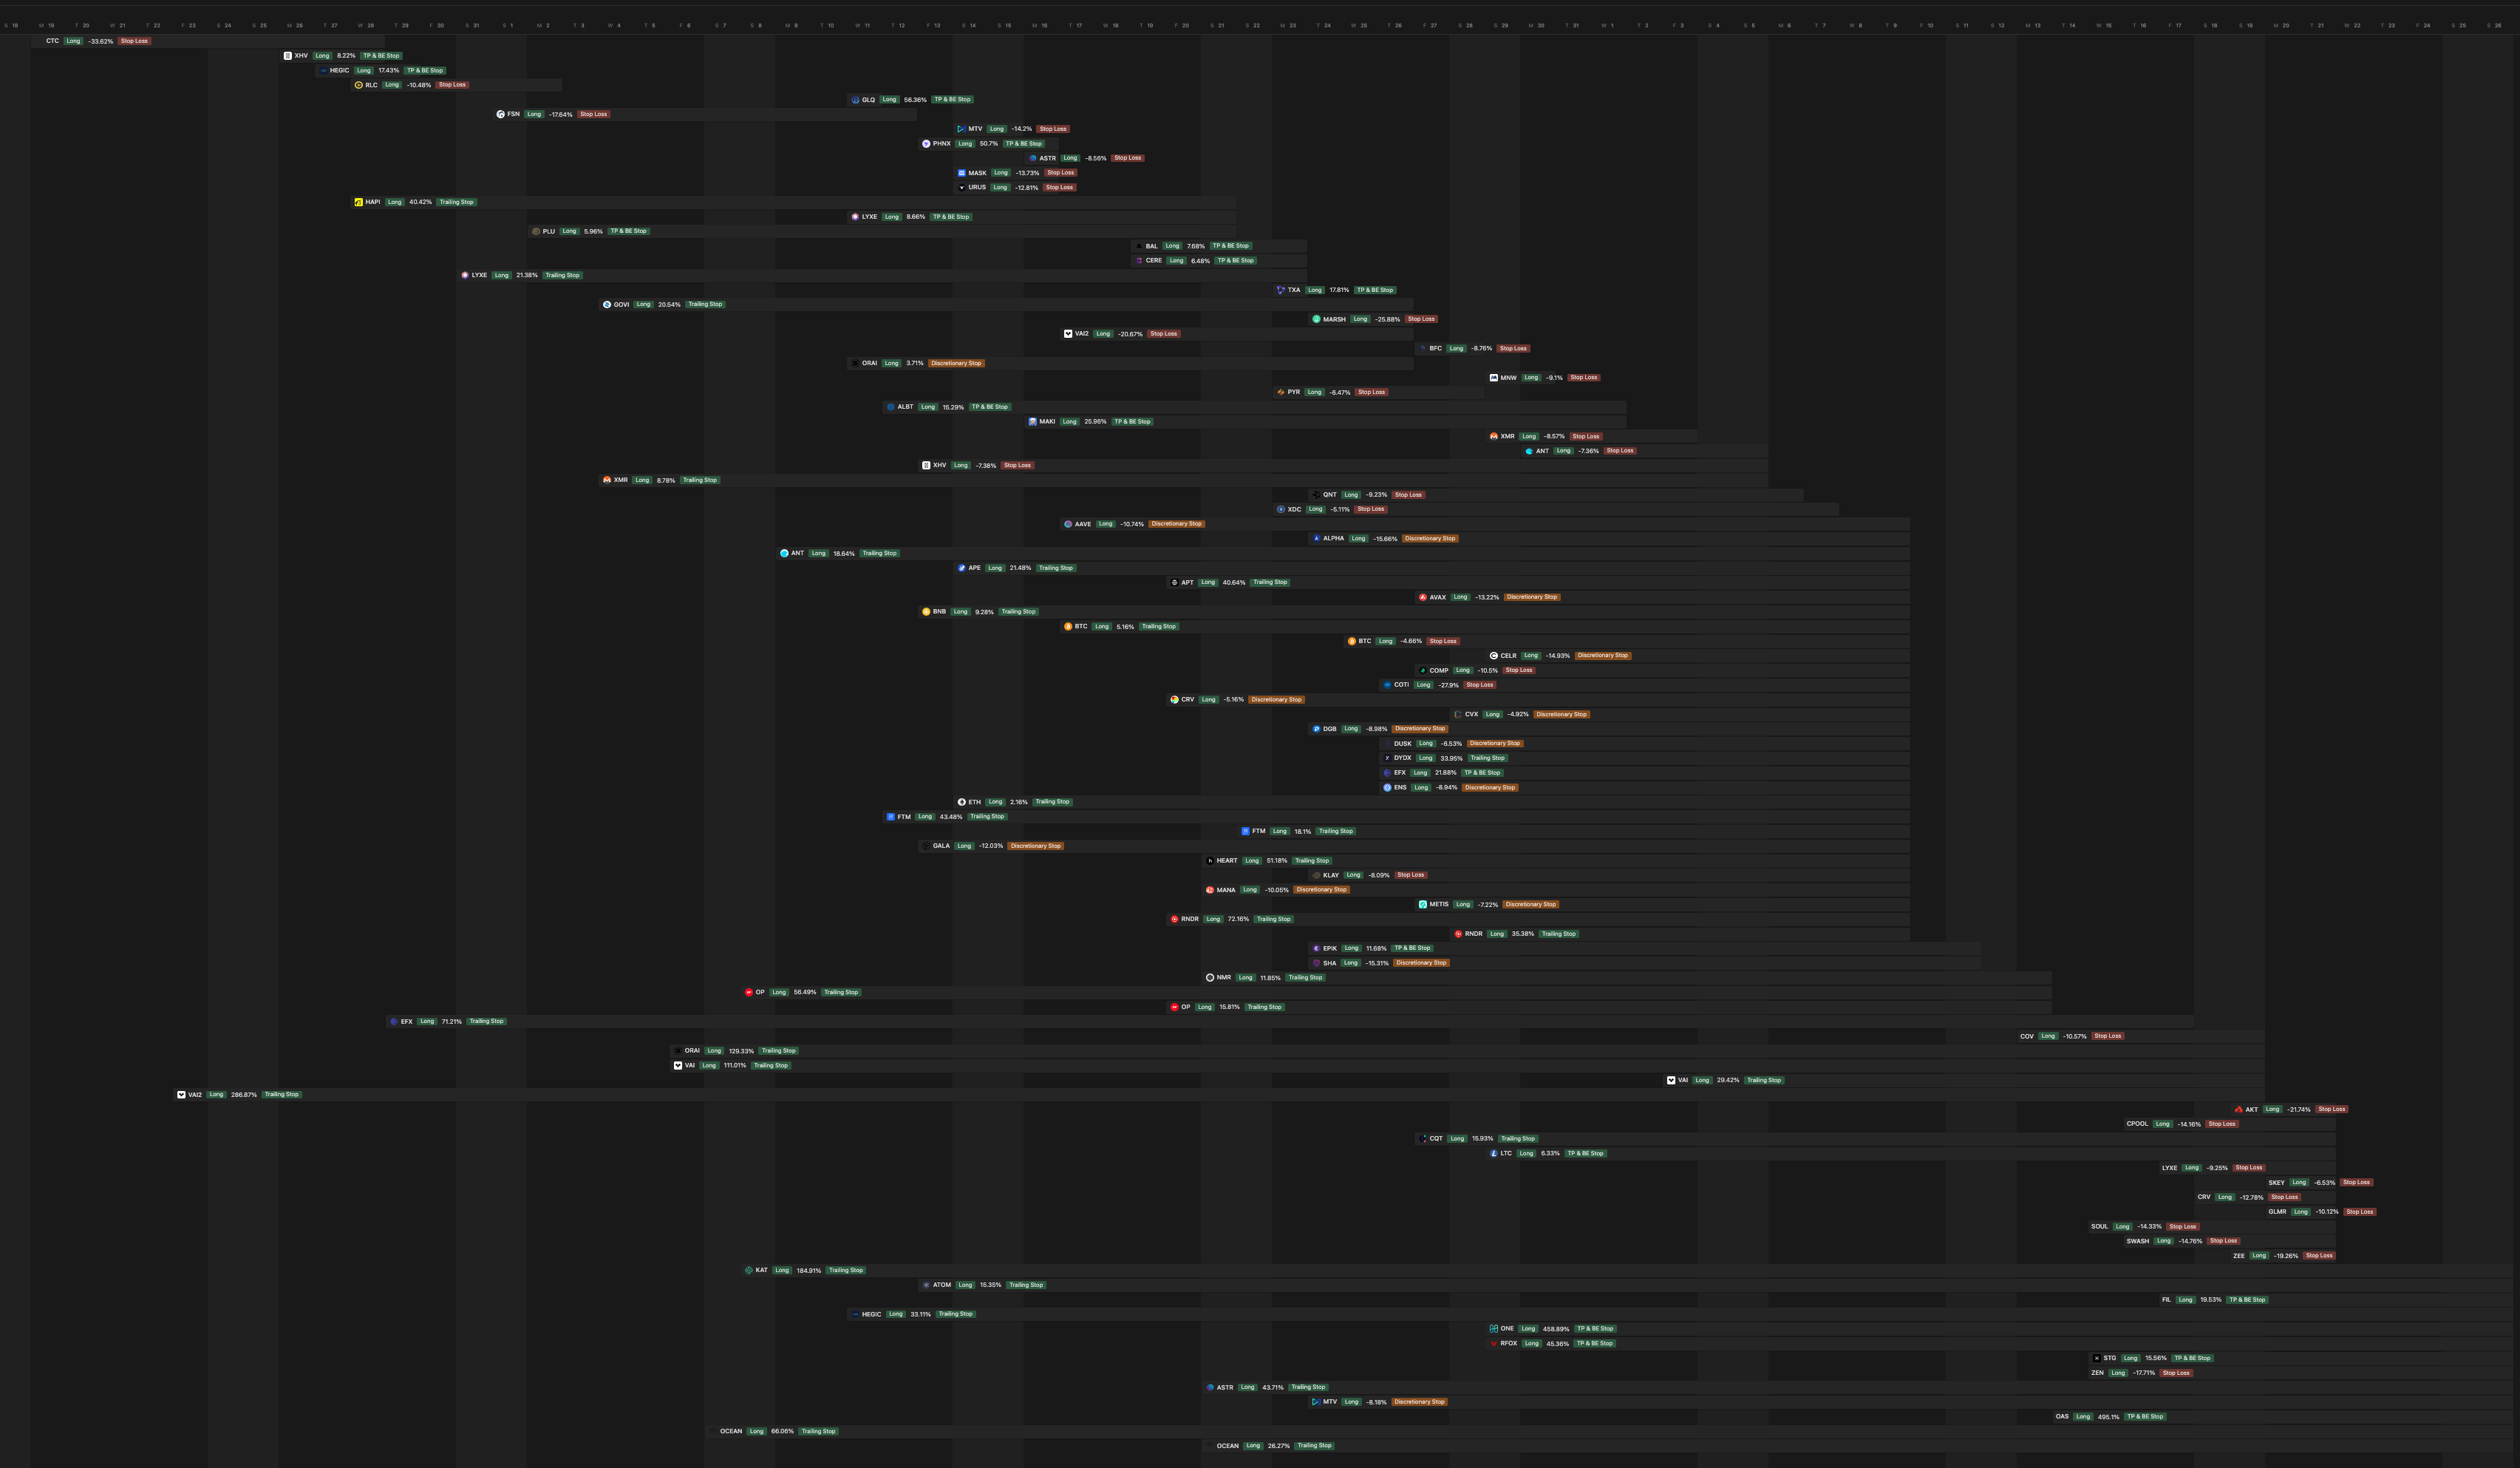
Closing out of more and more long trades. As I expected some of those later breakout trades stopped out but STX managed to shine through.
‘I wish that I could turn back time’ to all the bullishness.
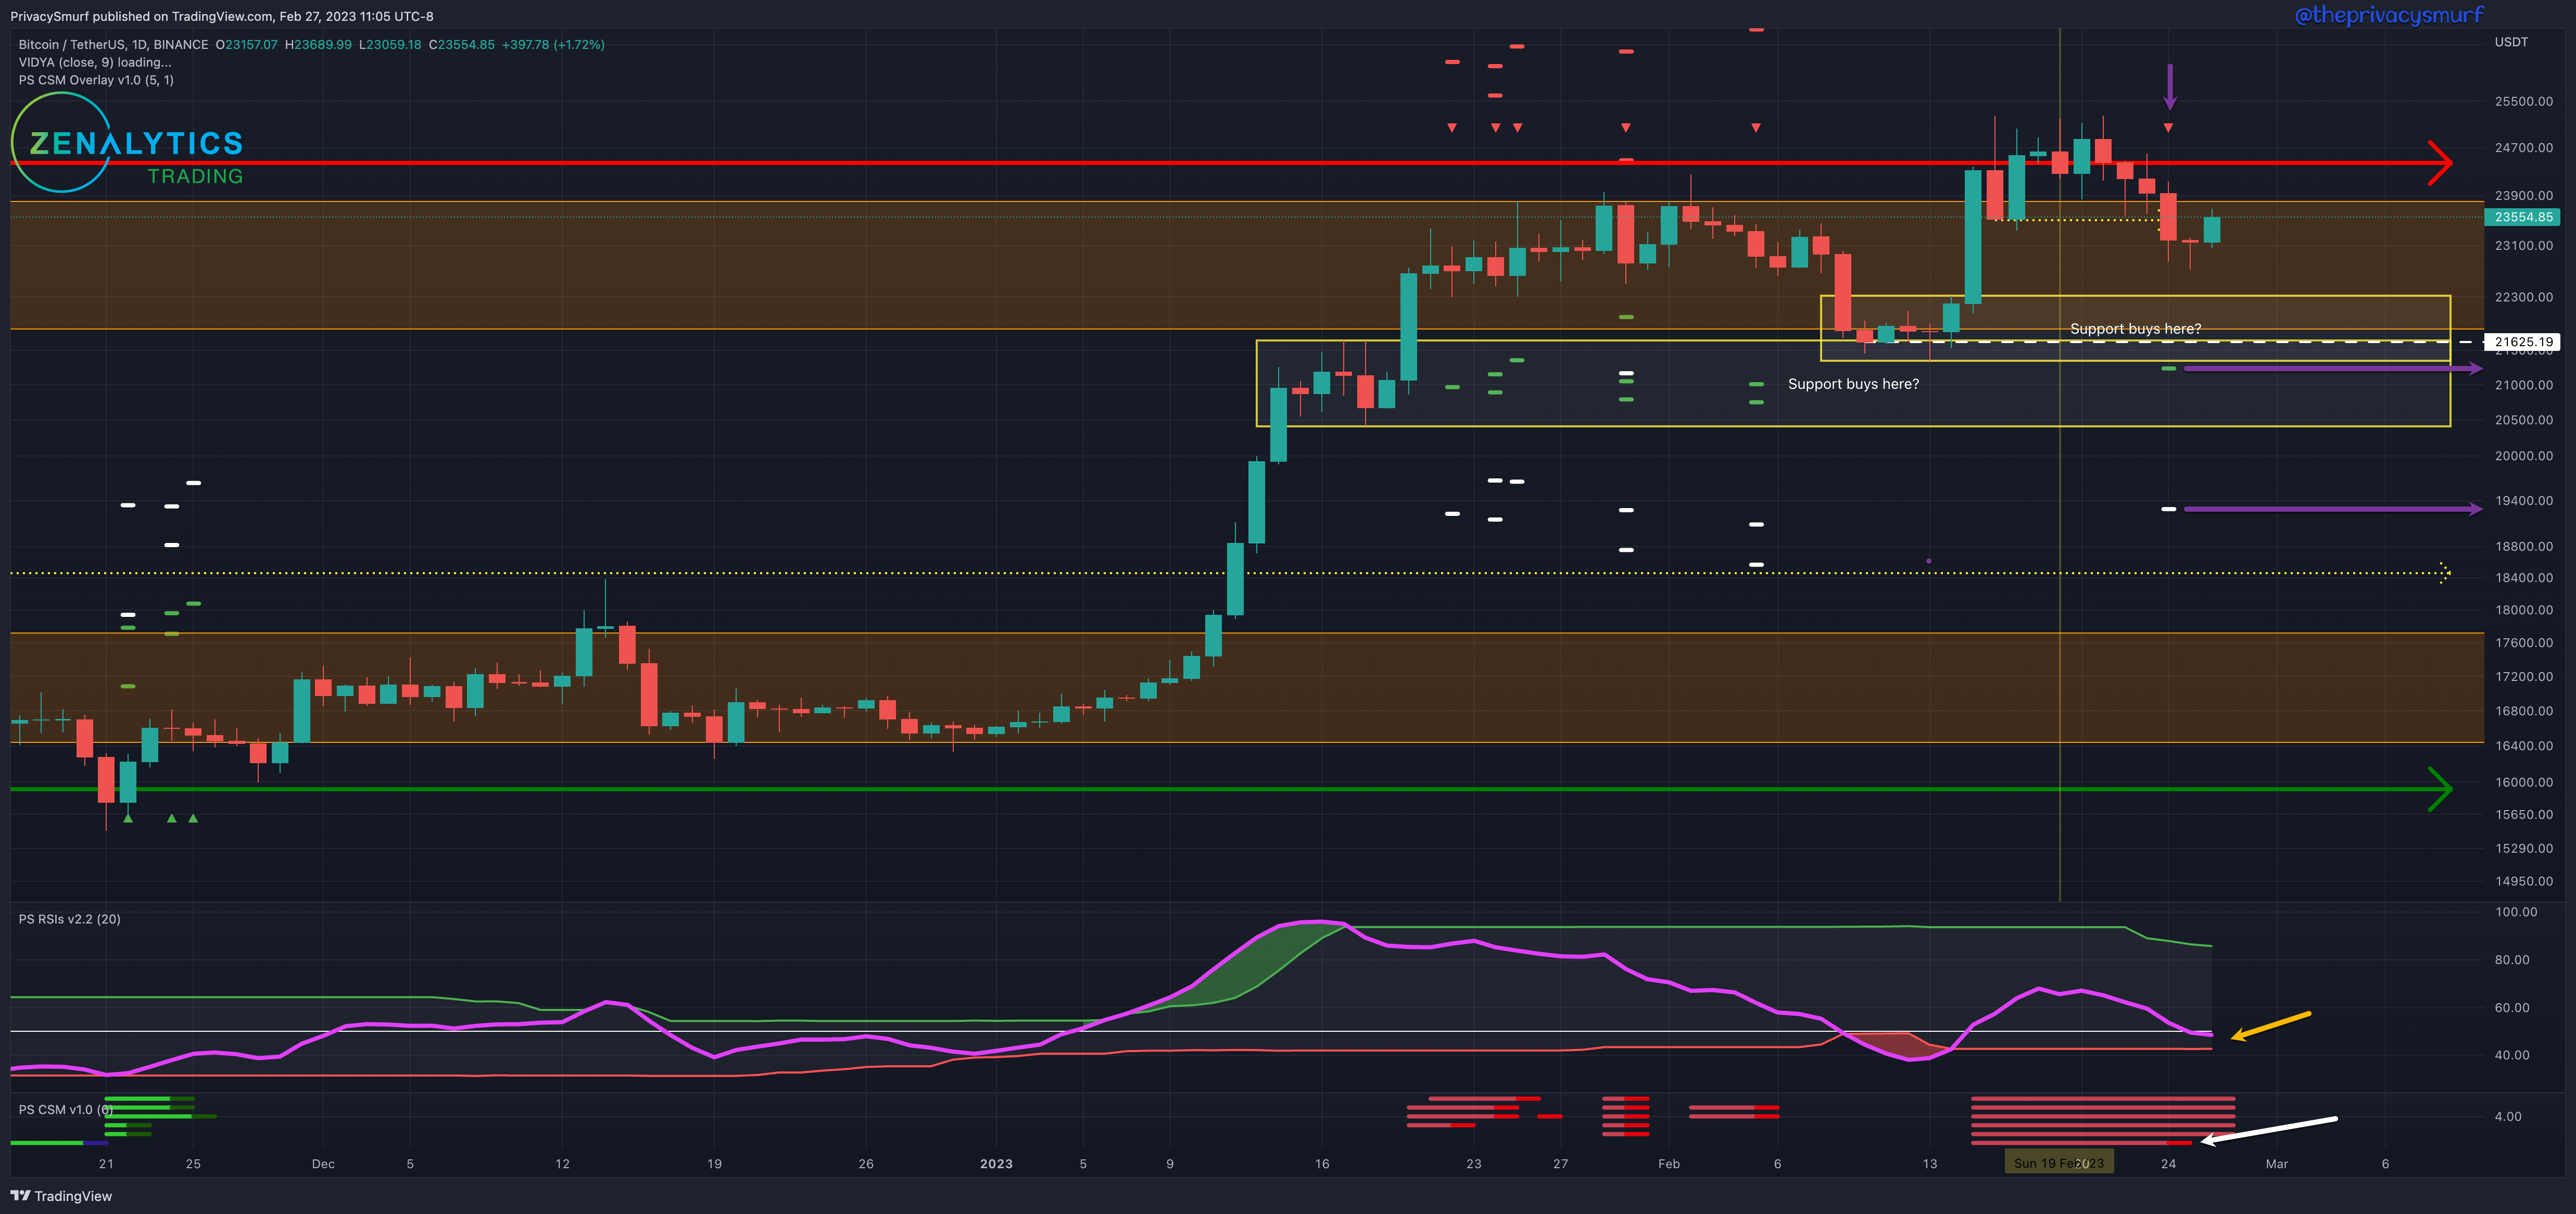
BTC/USDT Daily Chart
https://www.tradingview.com/chart/jjSdFW4b/
From last week:
”…be watching for a retracement…”
The retracement finally started with prices pulling back to create new lower closes. My indicator the Correction Strength Meter (white arrow) has signaled a bearish trade with targets (purple arrows) in the support zone and farther down toward $19.4k.
Last week I also said “Ideally, prices don’t retrace and close lower than $25.3k. This would start to negate the bullish structure. I would consider reentering long positions at that level for a swing trade given lower timeframes 20min to 2HR have bullish divergences percent at that time.”
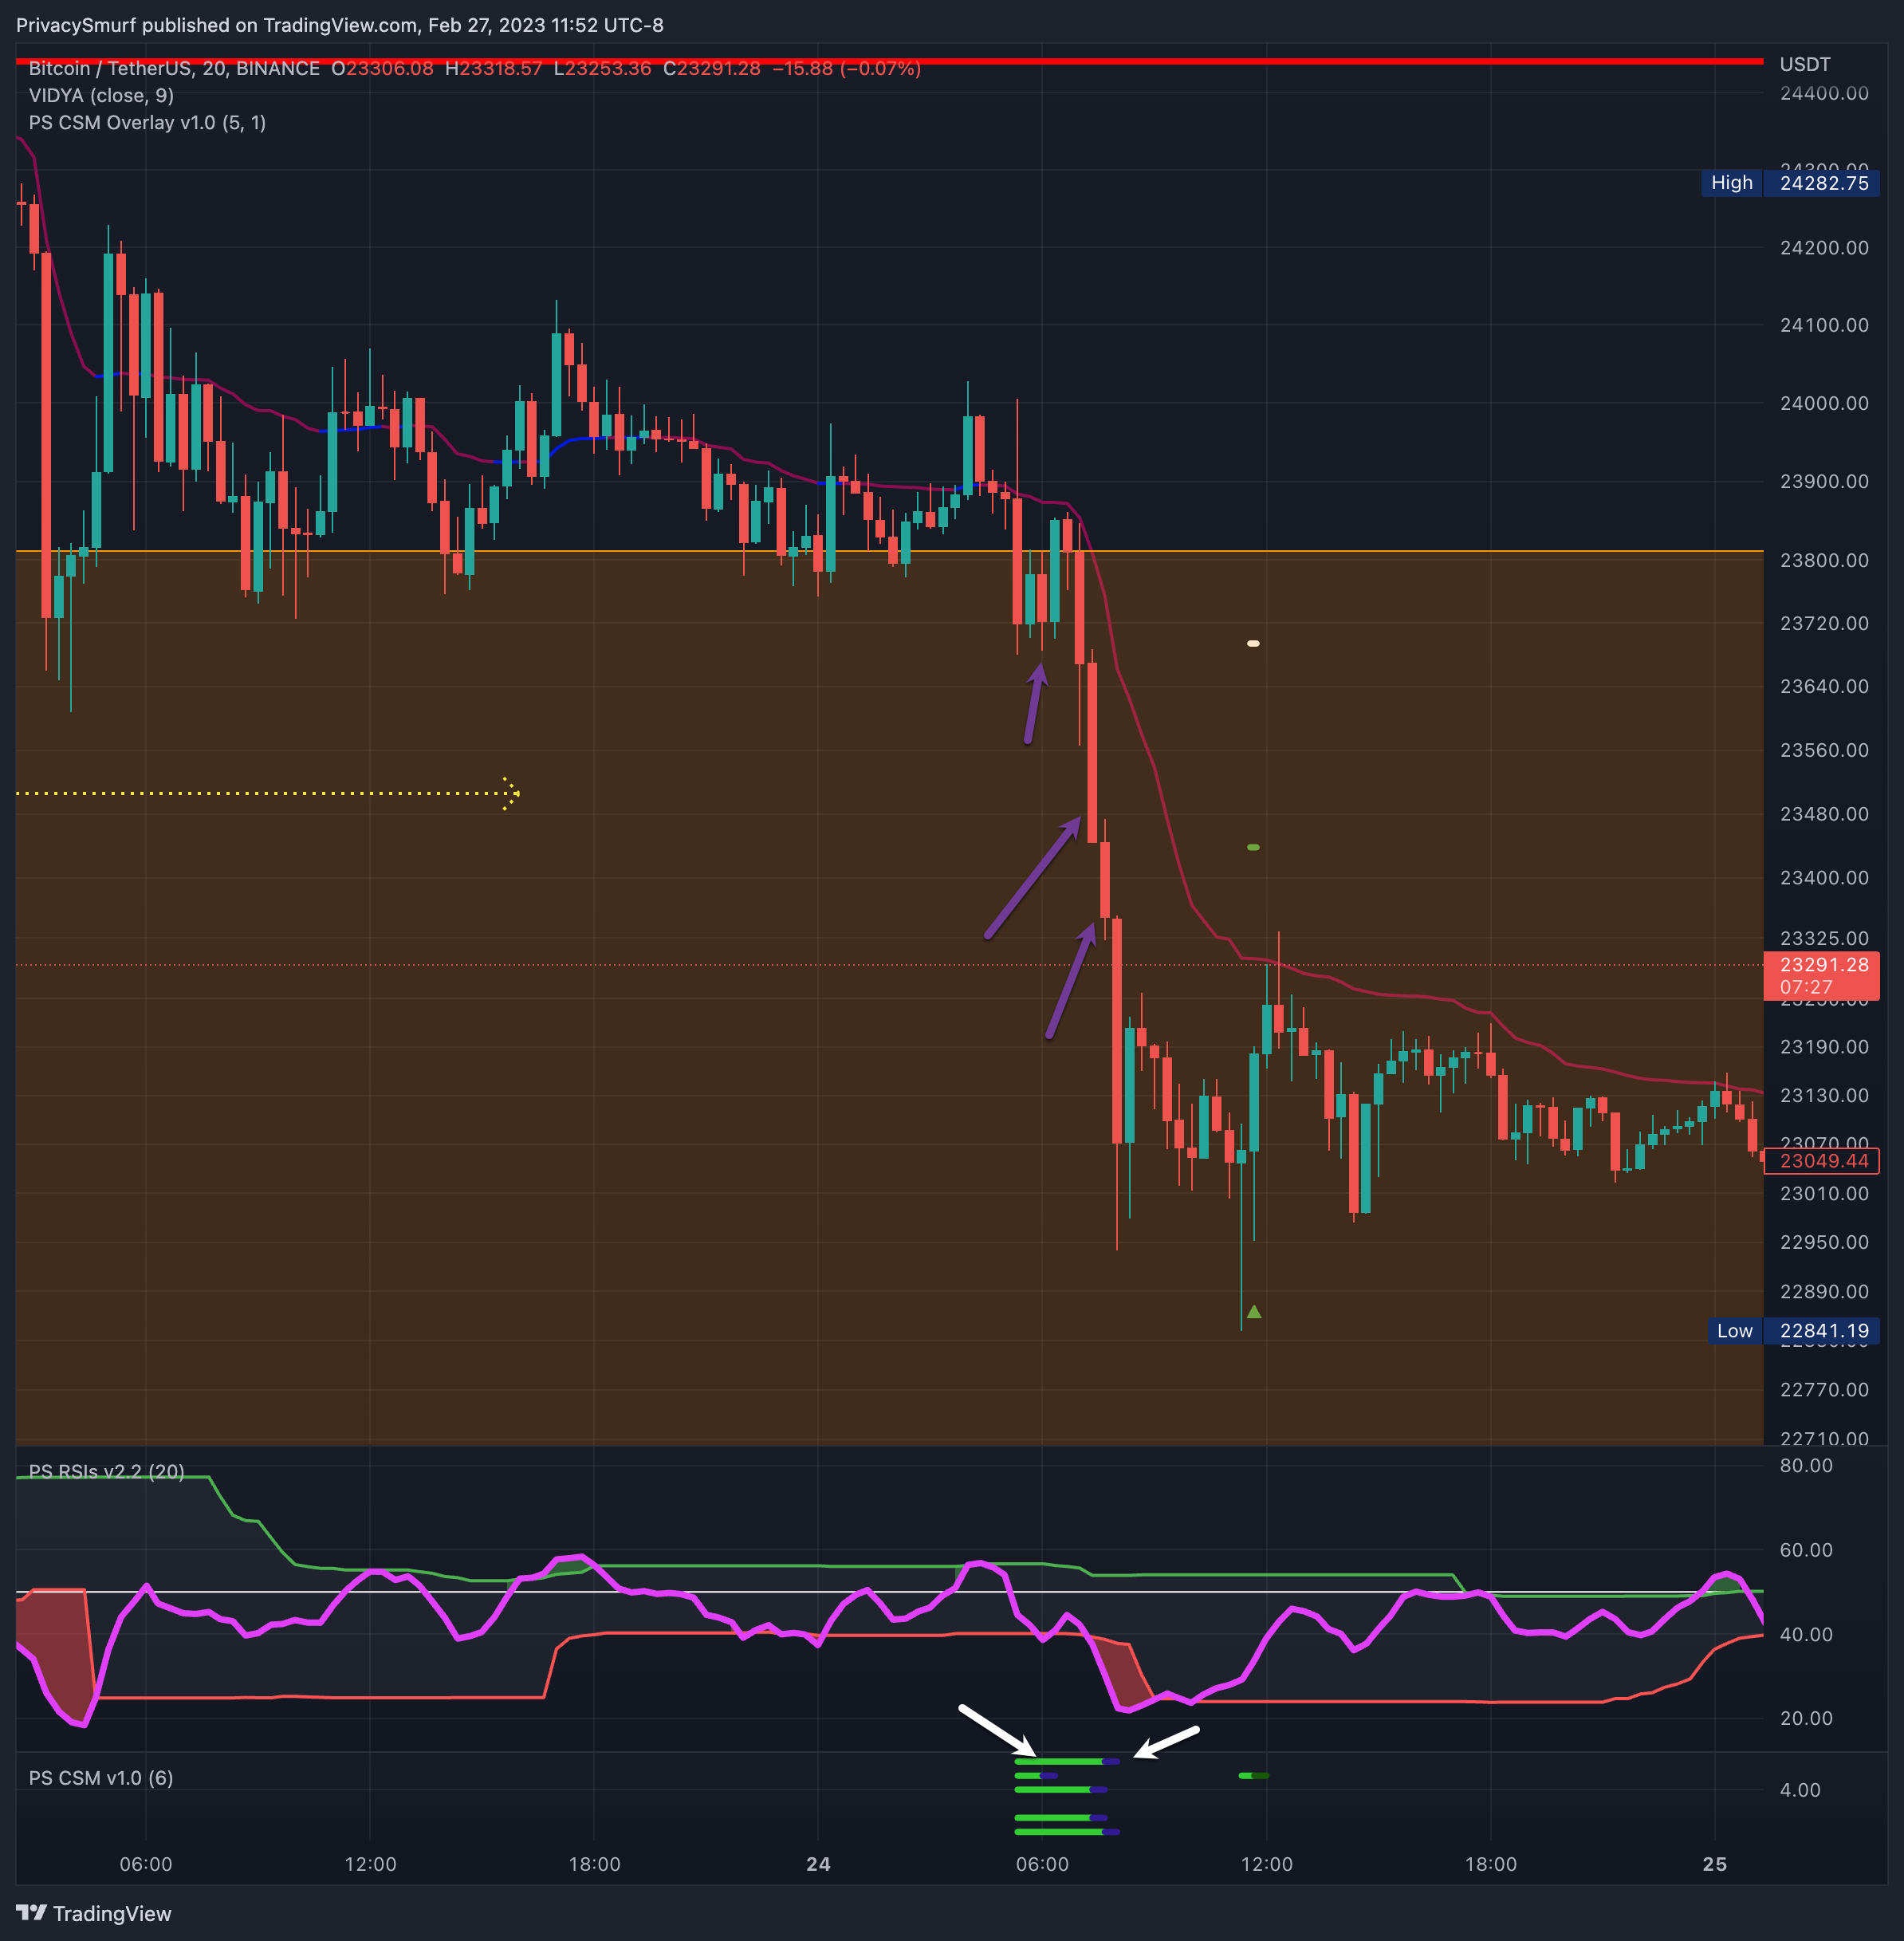
This setup came to be and was invalidated. Here’s how this looks on the indicators. Below we can see the 20min timeframe of the daily chart I share. As prices started to retrace towards the green arrow marking the prior lowest close at $23.5k the CSM (left white arrow) plot green bars showing bullish divergence building. However, as prices tested the prior low close support (purple arrows) each oscillator represented on the CSM started invalidating bullish divergences by setting new lows (right white arrow). This suggests that prices will not reverse and continue to be bearish. This is not a support I want to buy. If the 20min is invalidated I’ll bypass the 2H timeframe because historically the price chart will consolidate on the lower timeframes and eventually set up again later revisiting new lows.
The RSI on the daily chart (yellow arrow) hasn’t settled below the midline or the adaptive bottom band yet so I’m not expecting bearish impulsivity until then. It’s still the expectation though.
Given the week's current technicals, I’m bringing the range back down to pricing between $21k and $25k. My bias this week is neutral to bearish. This is due to the RSI’s presentation. I don’t want to make any decisions while prices consolidate in the middle of the range. A break of the bottom band on the daily chart and I’ll watch intraday bearish breakouts and for buys in the support zones. I’m not looking for bullish trades until the lows are touched OR we consolidate long enough to set up new intraday bullish divergences OR we have a random pump and breakout from the highs.
ETH/BTC Daily Chart
https://www.tradingview.com/chart/gTkSjkj6/
From last week:
”… waiting game now and buying supports… biding time until we break below and cause bullish divergences…”
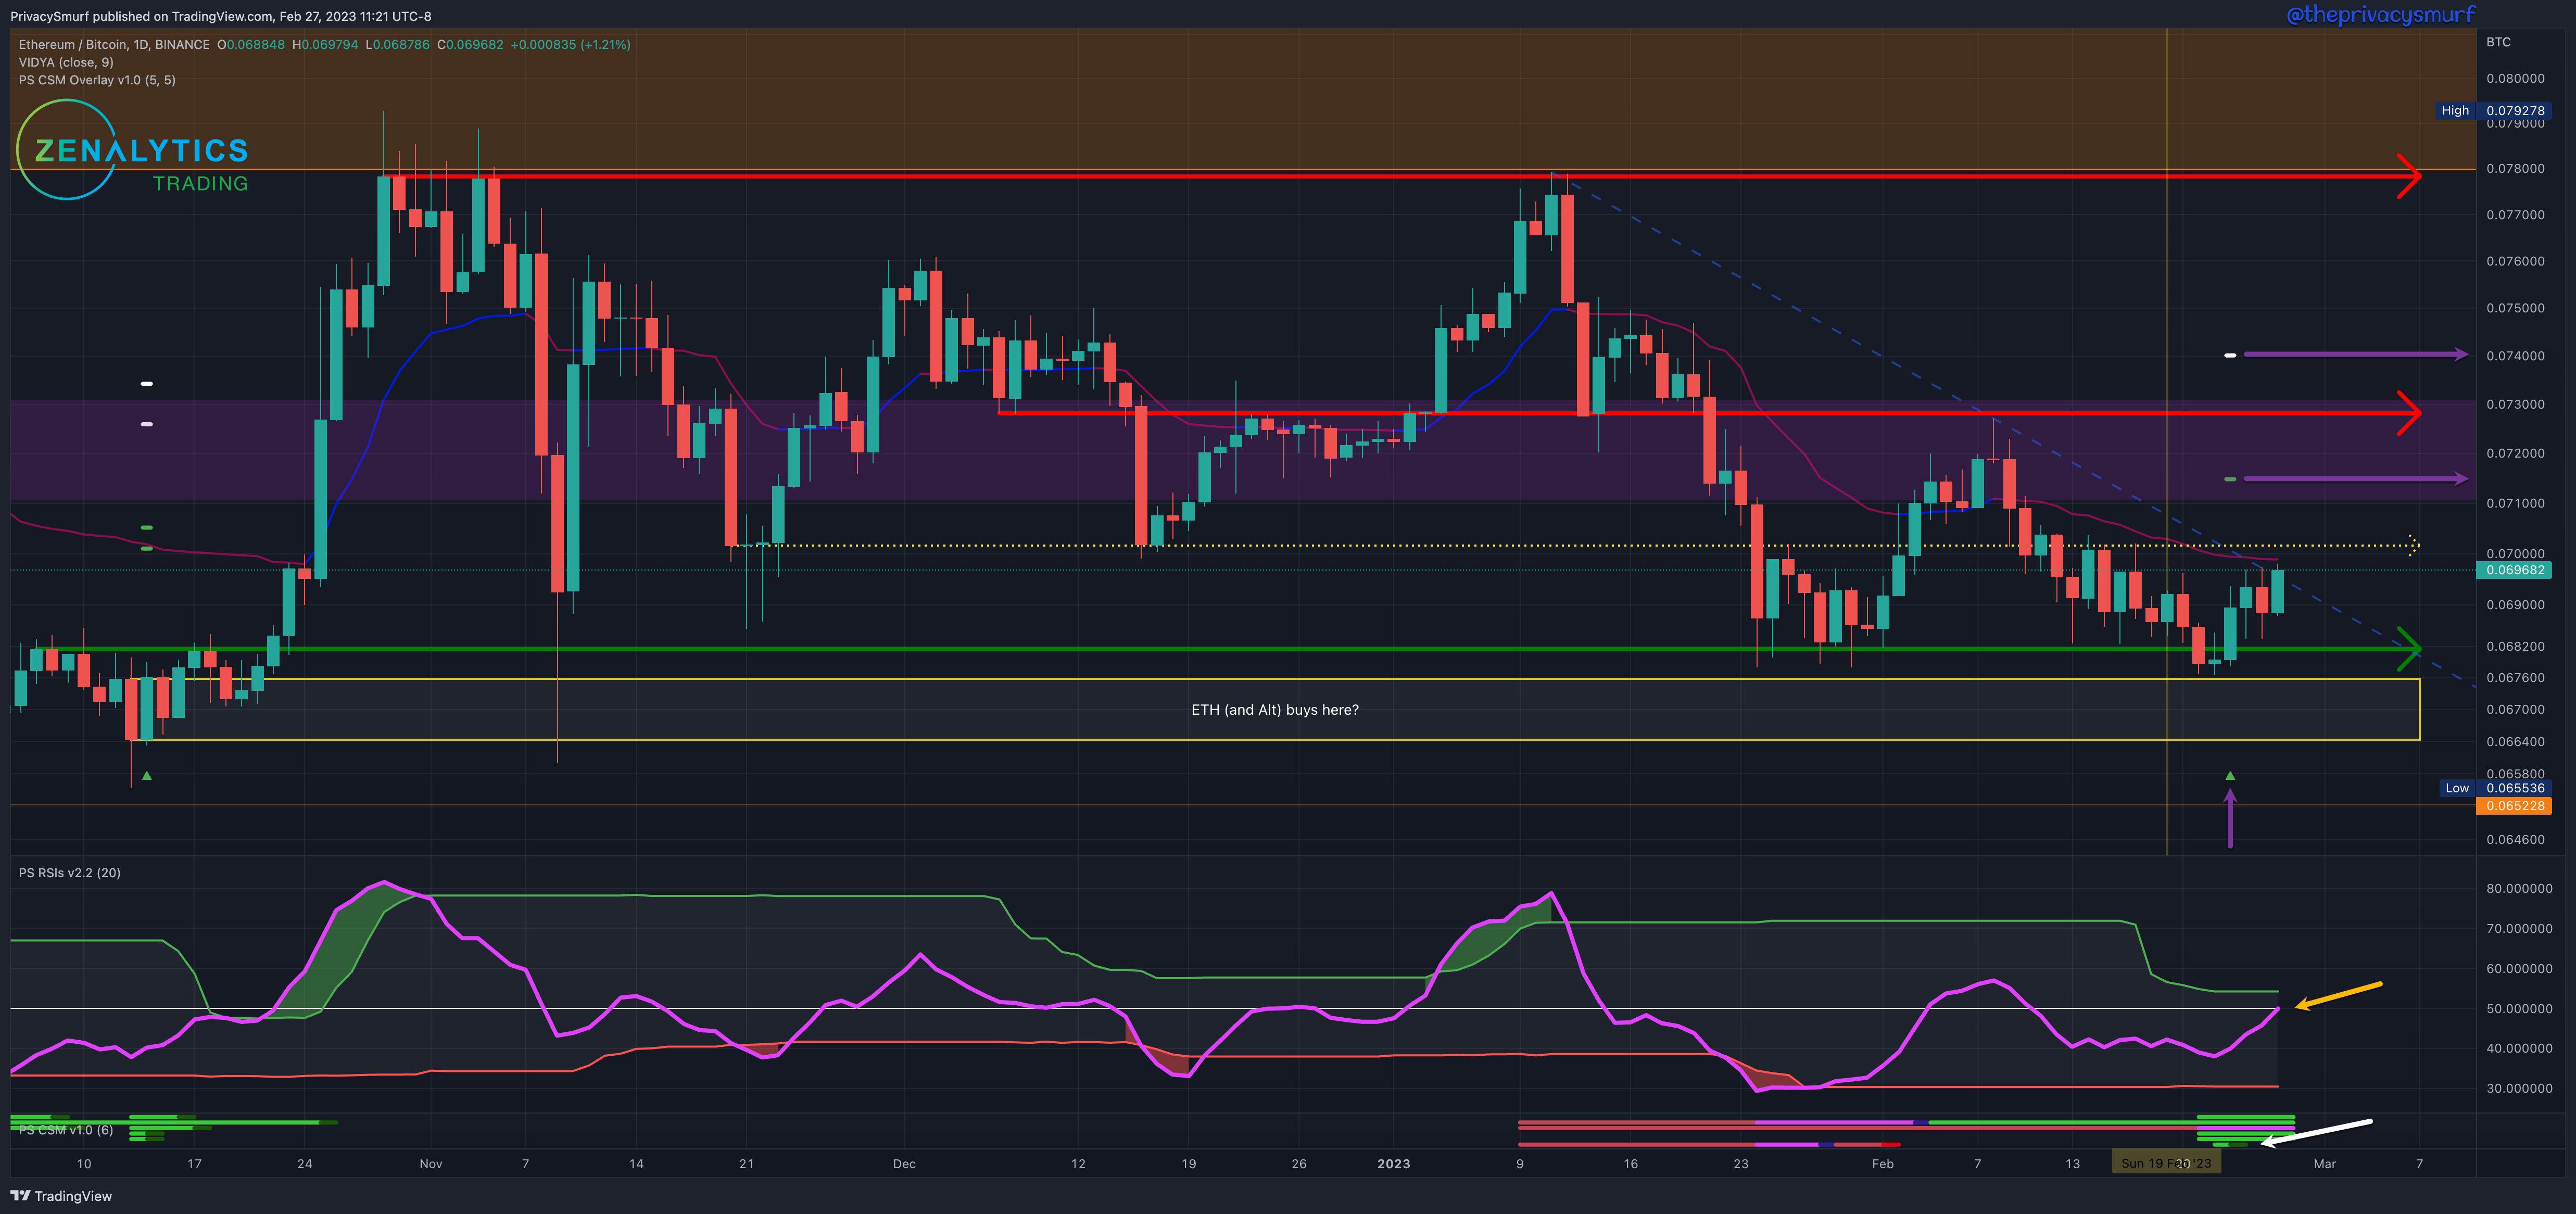
The break below the support line came but was not as low as I had plotted on the chart. I didn't end up making any purchases, but I’m not torn up about it. The increase in the ETH/BTC has not translated to a bullish ETH chart. It meant ETH was less weak. I’m still waiting for the low zone or potentially a breakout above the .0702 level.
There’s a combination of events on the chart that suggest the potential for strength in ETH over BTC. The Correction Strength Meter has signaled a bullish trade (white arrow) with targets (purple arrows) starting up towards the .0714 level. The RSI (yellow arrow) is sitting just below the midline and the top adaptive band. If breached that would suggest bullish impulsivity. The price chart is sitting just below a horizontal resistance at the .0702 level and the dynamic moving average resistance depicted in the VIDYA. There’s also a descending trendline anchored on highs that is showing a breakout. For the record, angular support/resistance is my least favored so I’m hesitant to even acknowledge it but as it’s confluent with many other factors I’ll include it just to emphasize the potential for erratic action. Enough bullishness and the breakout from all of these market conditions could lead to a decent price spike. To capitalize on this I’d be flipping through all the alt charts looking for a mirror image.
Given the current technicals for the week, I’m leaving ranges as they are at 0.068 and 0.073. My bias this week is still neutral but have a bullish bias. I’m expecting a breakout eventually but that may not lead to a higher high close over 0.072 and a new trend. Ideally, we meet the bullish expectations plot from the CSM and come back down to test .0702 and set a higher low. That sequence of events would be where I consider front running a new bull trend since we didn’t get into the low support zone during this bearish trend.
ETH/USDT Daily Chart
https://www.tradingview.com/chart/xbB6lkZu/
From last week:
“… watching for a retracement… watching the chart throughout the week for intraday bullish divergences on the 1HR…”
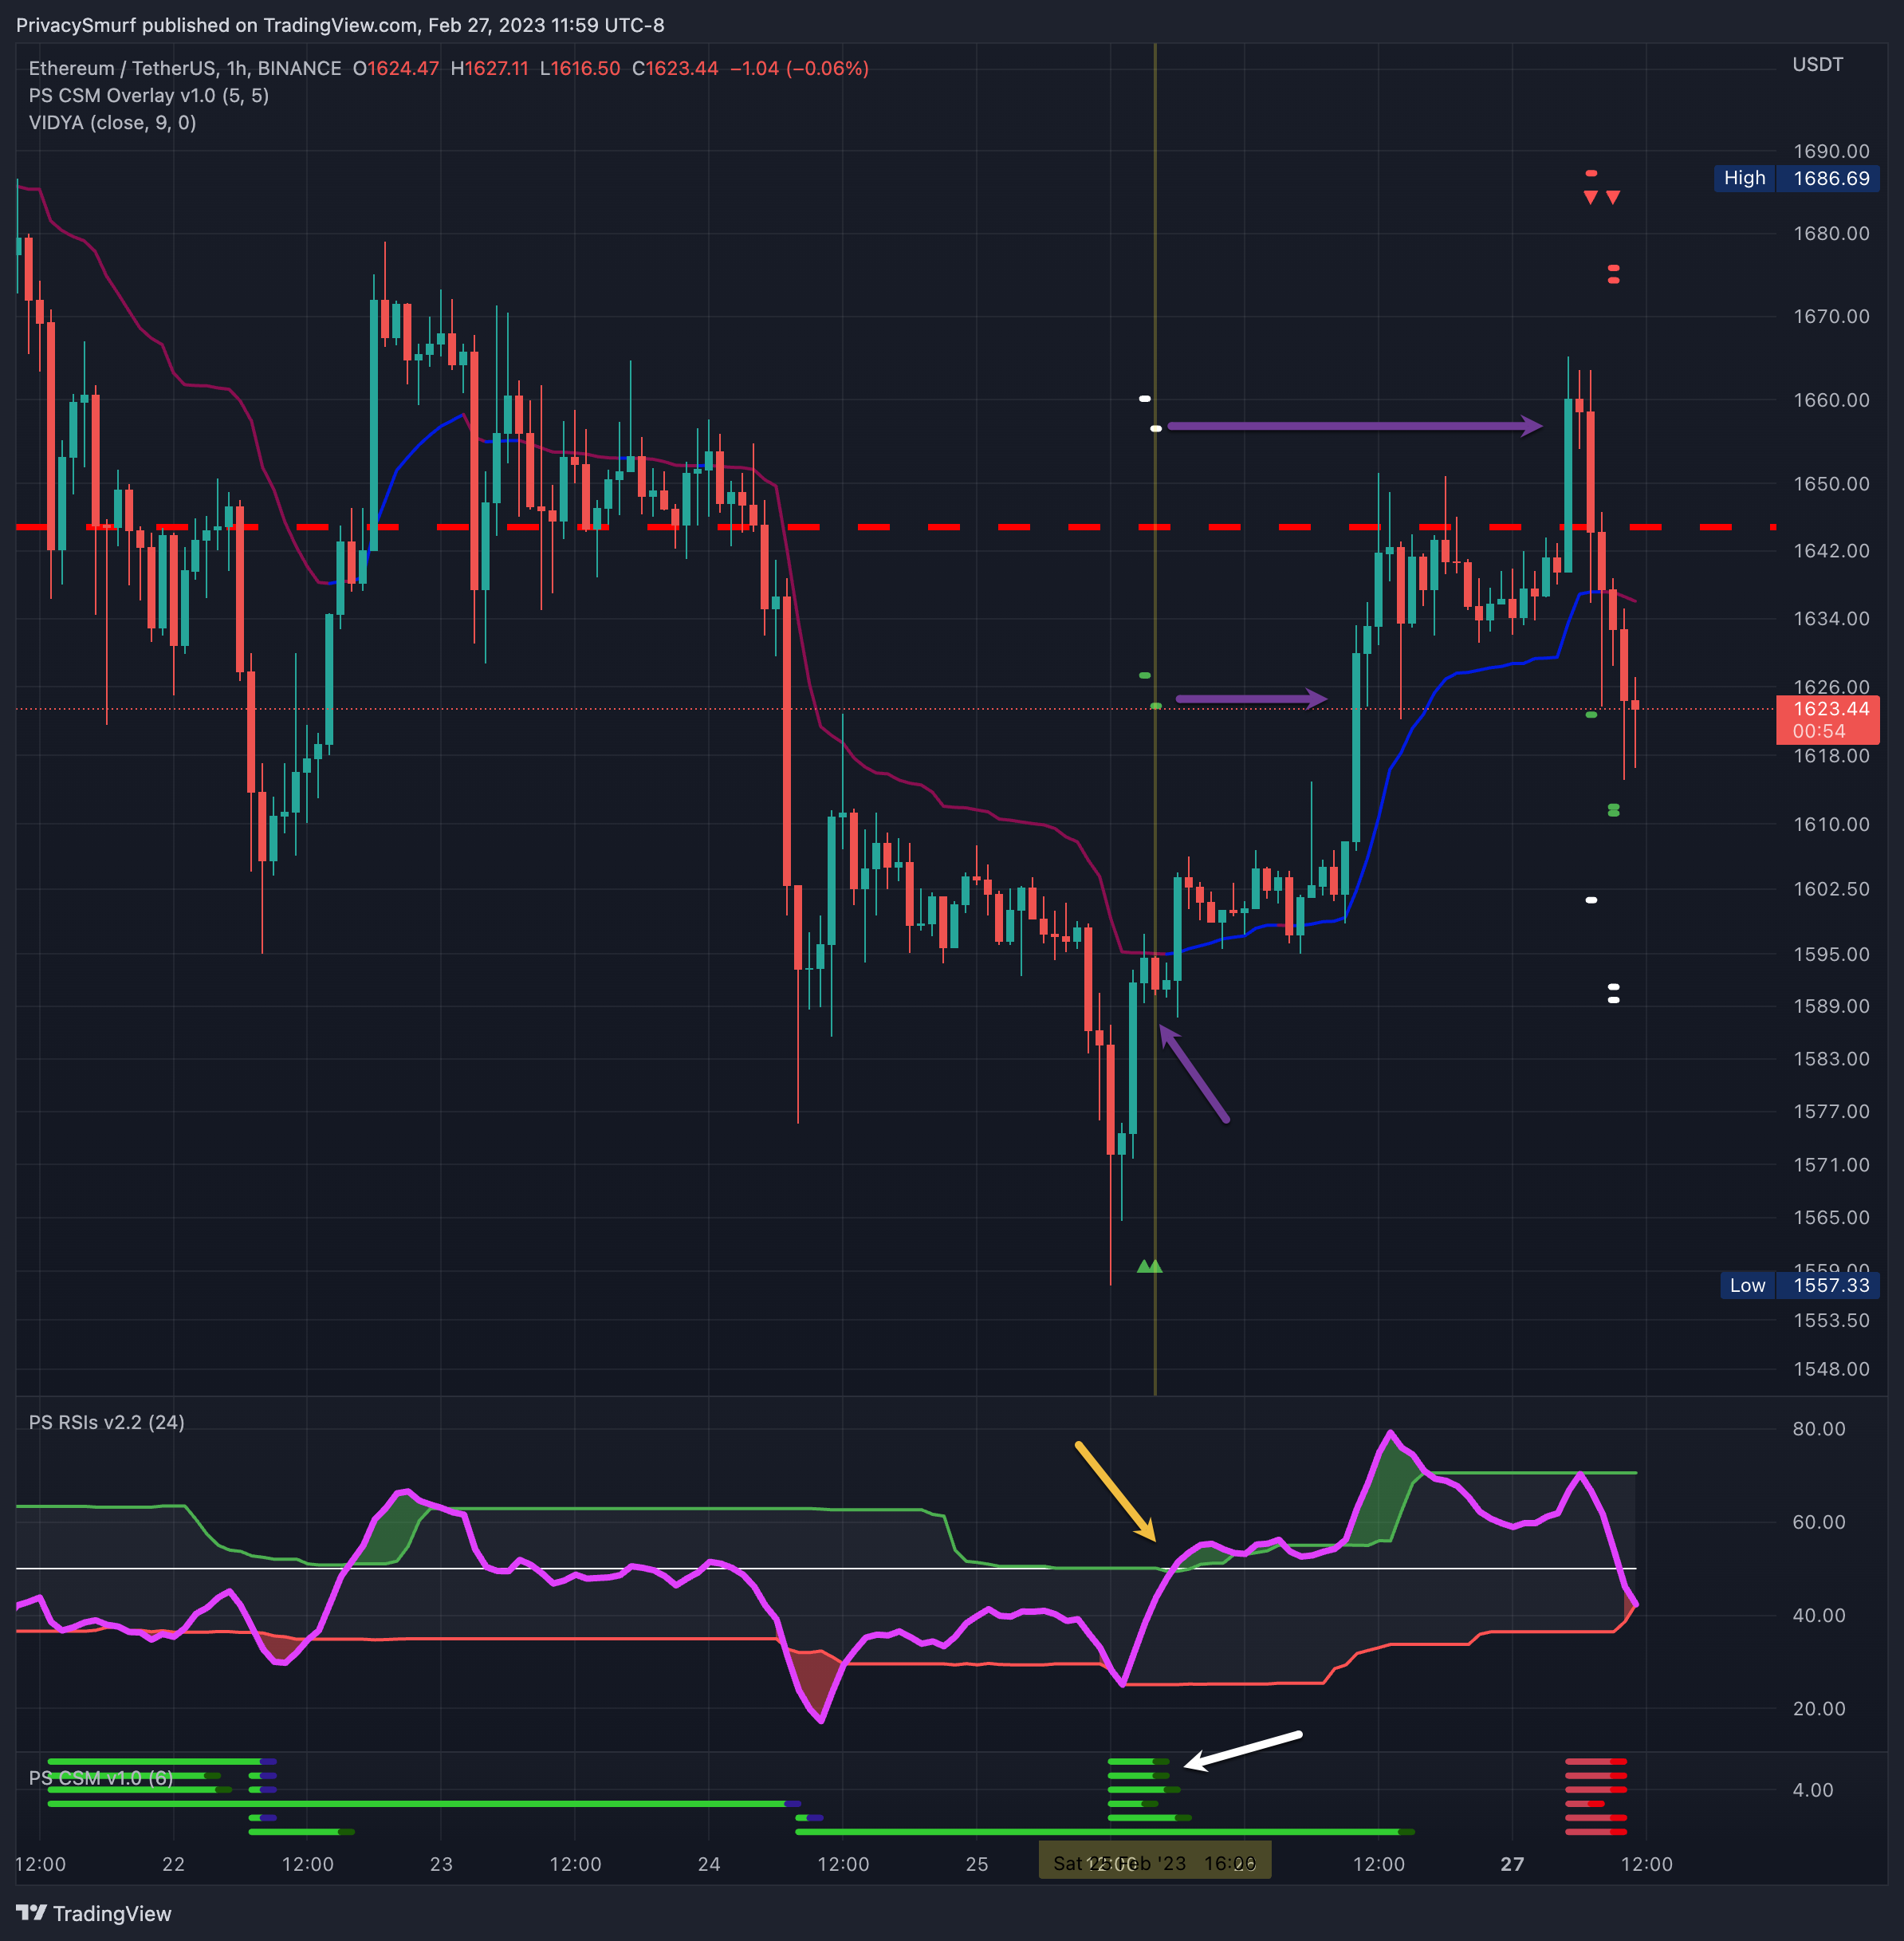
Like BTC the retracement played out as well as the technical conditions to signal where to buy in on a bounce. Below we see the 1HR timeframe. As prices set new lows on Saturday the CSM (white arrow) showed all oscillators triggering bullish trade conditions with the RSI (yellow arrow) in the ideal condition for bullish impulsivity as it measured just below the midline and the top adaptive band heading for an upwards break. This entry signal met both targets (purple arrows) before selling off again, which coincidentally were ideal bearish conditions signaled by the CSM and RSI which also met the primary target.
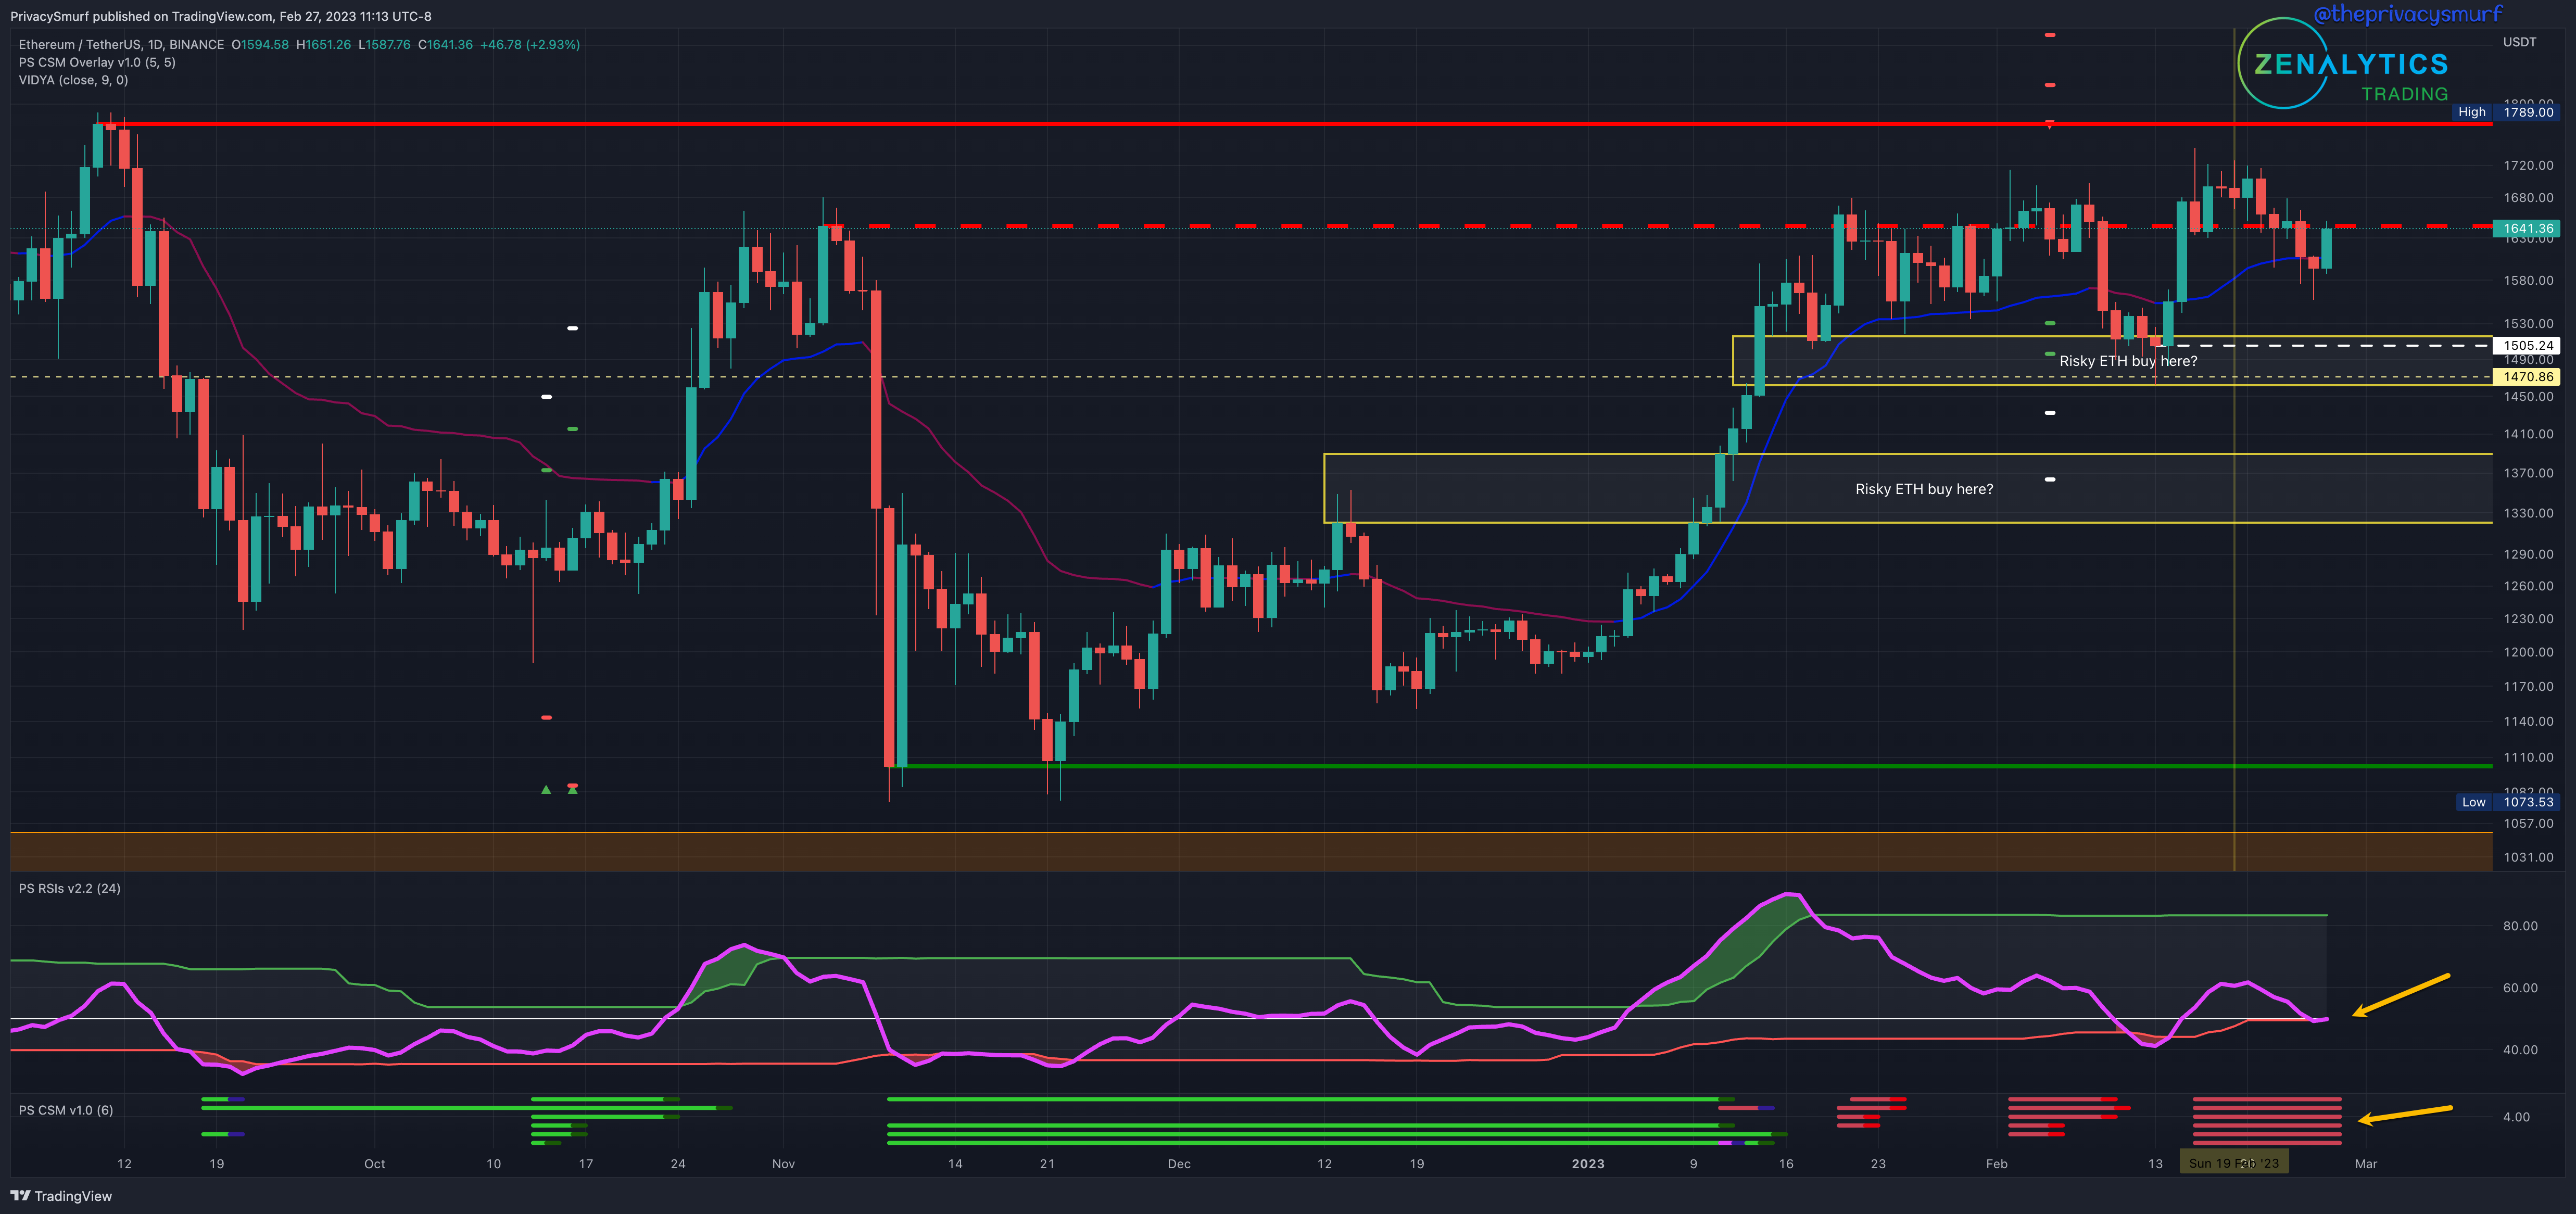
Given the current technicals for the week, I’m leaving the range as is at $1500 - $1800. ETH is in a weird place with the potential strength suggested in the ETH/BTC chart. My bias this week is neutral (and I want to be bullish). With ETH/BTC showing the potential for strength in ETH it is logical to suspect a test of $1700 again but for that to be the daily RSI has to stay above the midline and intraday charts around the oscillators on the 2HR timeframe must maintain alignment with the prices and not go into divergence on the price rise. If intraday timeframes are bearish divergent I’d expect tighter consolidation over the week. If the momentum weakens and the RSI slips I’d expect a test of the lows again and at minimum wicking on the daily chart under $1600. Given that the RSI is not all that far from its recent lowest low from mid-February if prices retrace below 1600 it’s possible that the RSI it won’t be bullish divergent and in that event, I’d expect the lower $1500s to be touched.
Sorry for the delay in the post.
@theprivacysmurf