

SS #71: Night Drive
SS #71: Night Drive
I know we ended things so we could go...

If you haven’t registered for the new new site you should. I had to ditch the membership provider I was using but this new one is a MAJOR upgrade. I’m progressively bringing the content over. It’s more community based and has a similar feel to Facebook or MightyNetwork. There’s a chat functionality, direct messaging capabilities, live streams, and all my other free and paid content. I encourage you to check it out.
‘I said now baby we can disappear…’
BTC/USDT Daily Chart
https://www.tradingview.com/chart/jjSdFW4b/
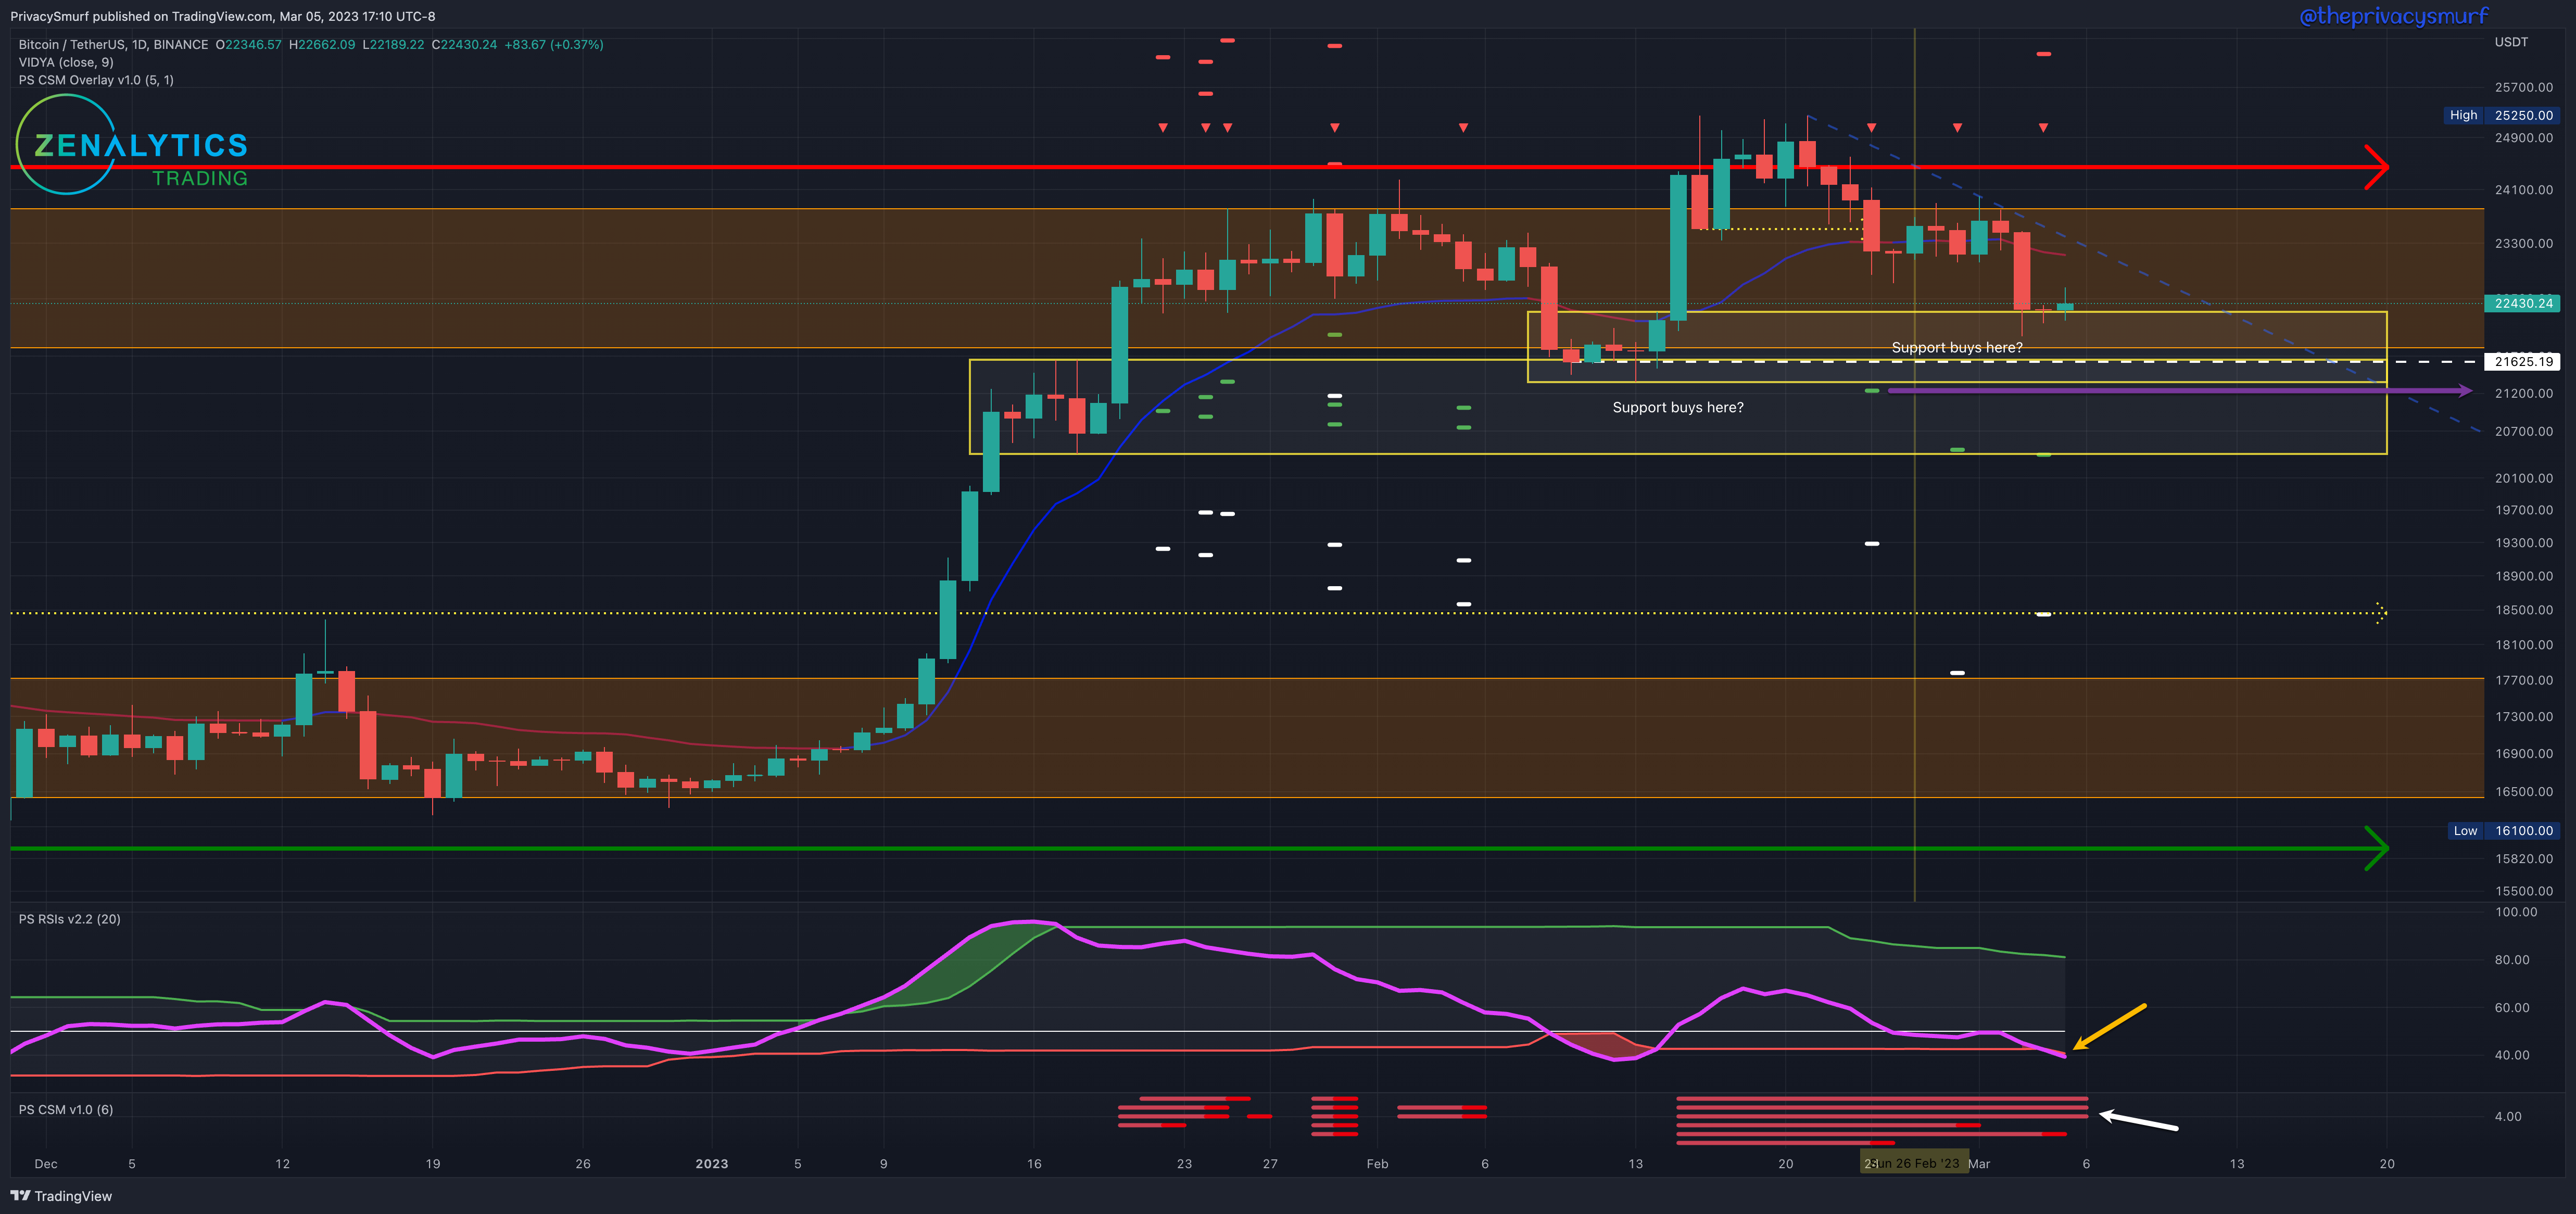
From last week:
”… RSI… hasn’t settled below the midline… not expecting bearish impulsivity until then… still the expectation… bias this week is neutral to bearish…”
It was a pretty dull week until it wasn't and then it was dull again. Neutral to bearish was the right bias. Closes throughout the week stayed in a 2% range until a nearly 5% selloff on Friday. The RSI settled under the midline by Sunday night into Monday morning and being under the midline suggests a bearish influence on prices. The selloff occurred before the RSI broke below the bottom band and as of writing the RSI (yellow arrow) is still decreasing below the bottom band. This would suggest bearish impulsivity is still on the horizon.
Right after the dip I popped into the Short Term Trader Room at the new site and dropped some TA.
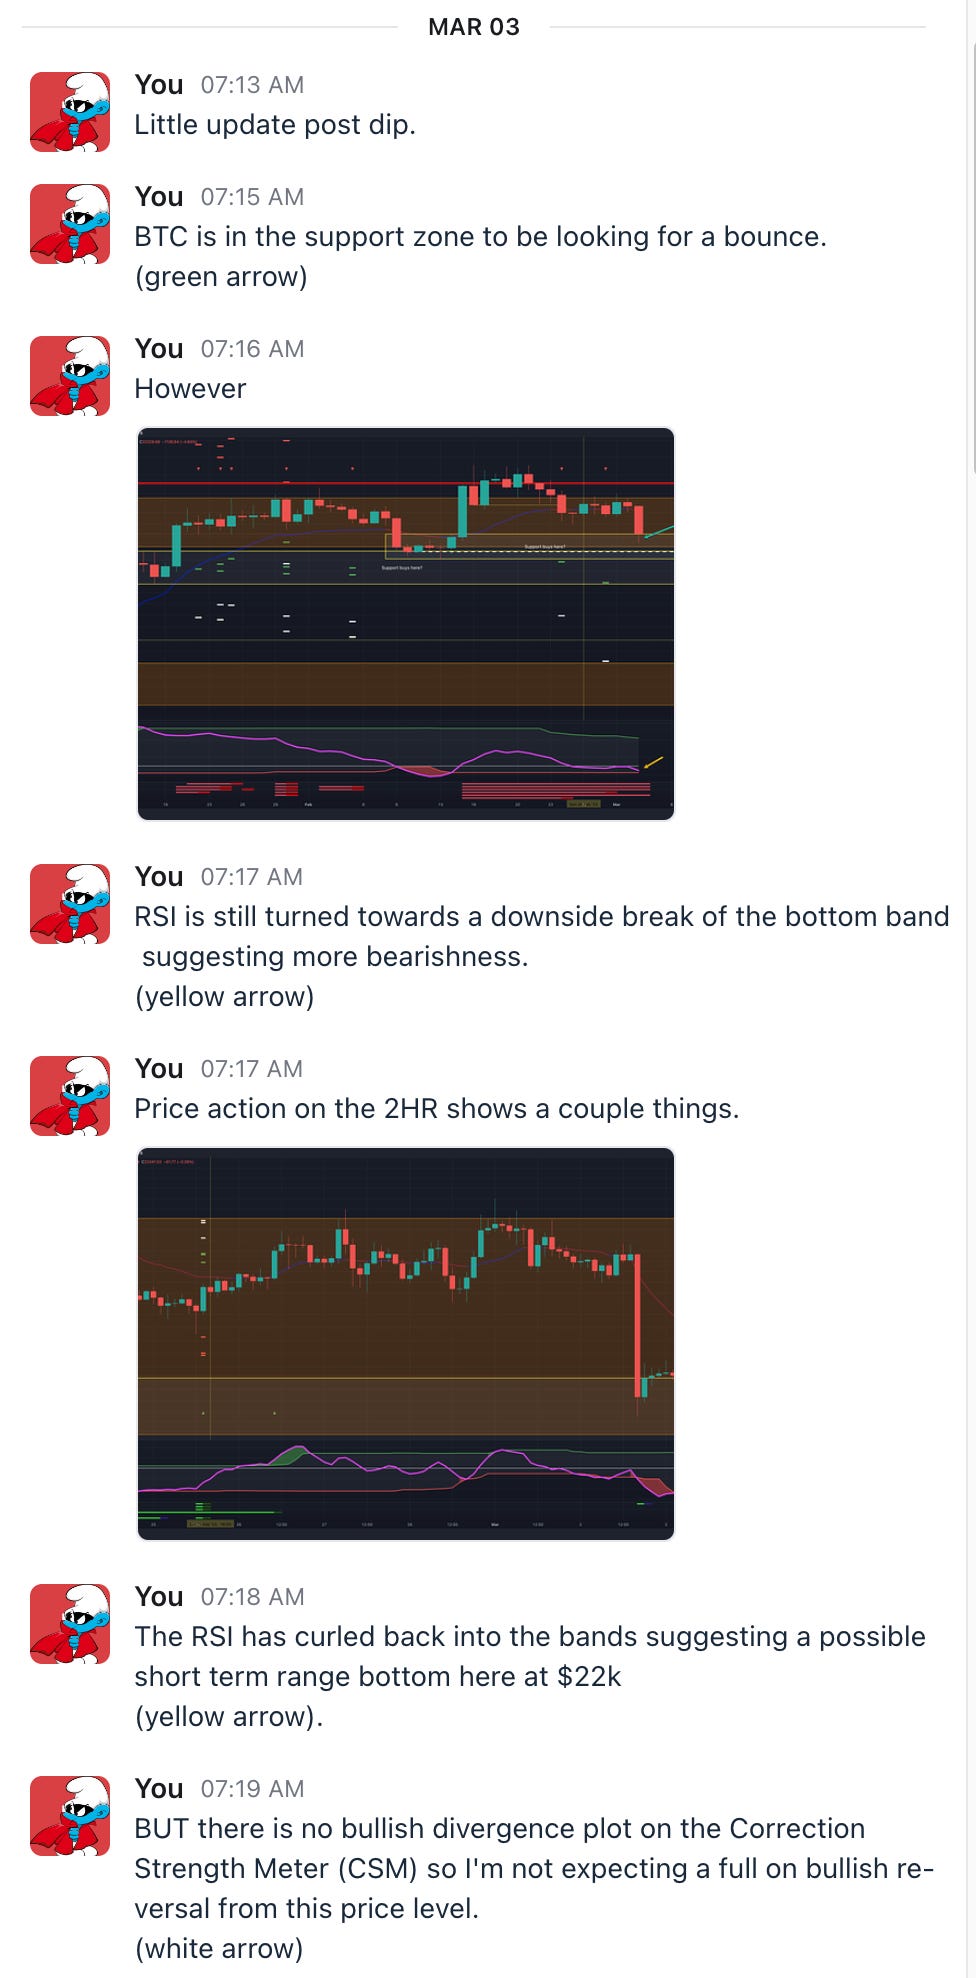
Sure enough, there’s been no bullish reversal and prices have been flatline mostly.
Given the week's current technicals, I’m bringing the range down to pricing between $21k and $24k. My bias this week is bearish to neutral. This is due to the RSI’s presentation. I’m expecting further bearishness until the RSI curls back into the bands. At that point, it’s possible the range low has been established. With the Correction Strength Meter (white arrow) still showing oscillators still playing out in bearish divergence and targets at around $21.2k I still am expecting bearish behavior. Ideally, it’s an impulsive move down without multiple days closing below $21.6k. Breaking down with new lower low closes would likely mean a deeper retracement towards the bottom of the next support zone around $20k.
ETH/BTC Daily Chart
https://www.tradingview.com/chart/gTkSjkj6/
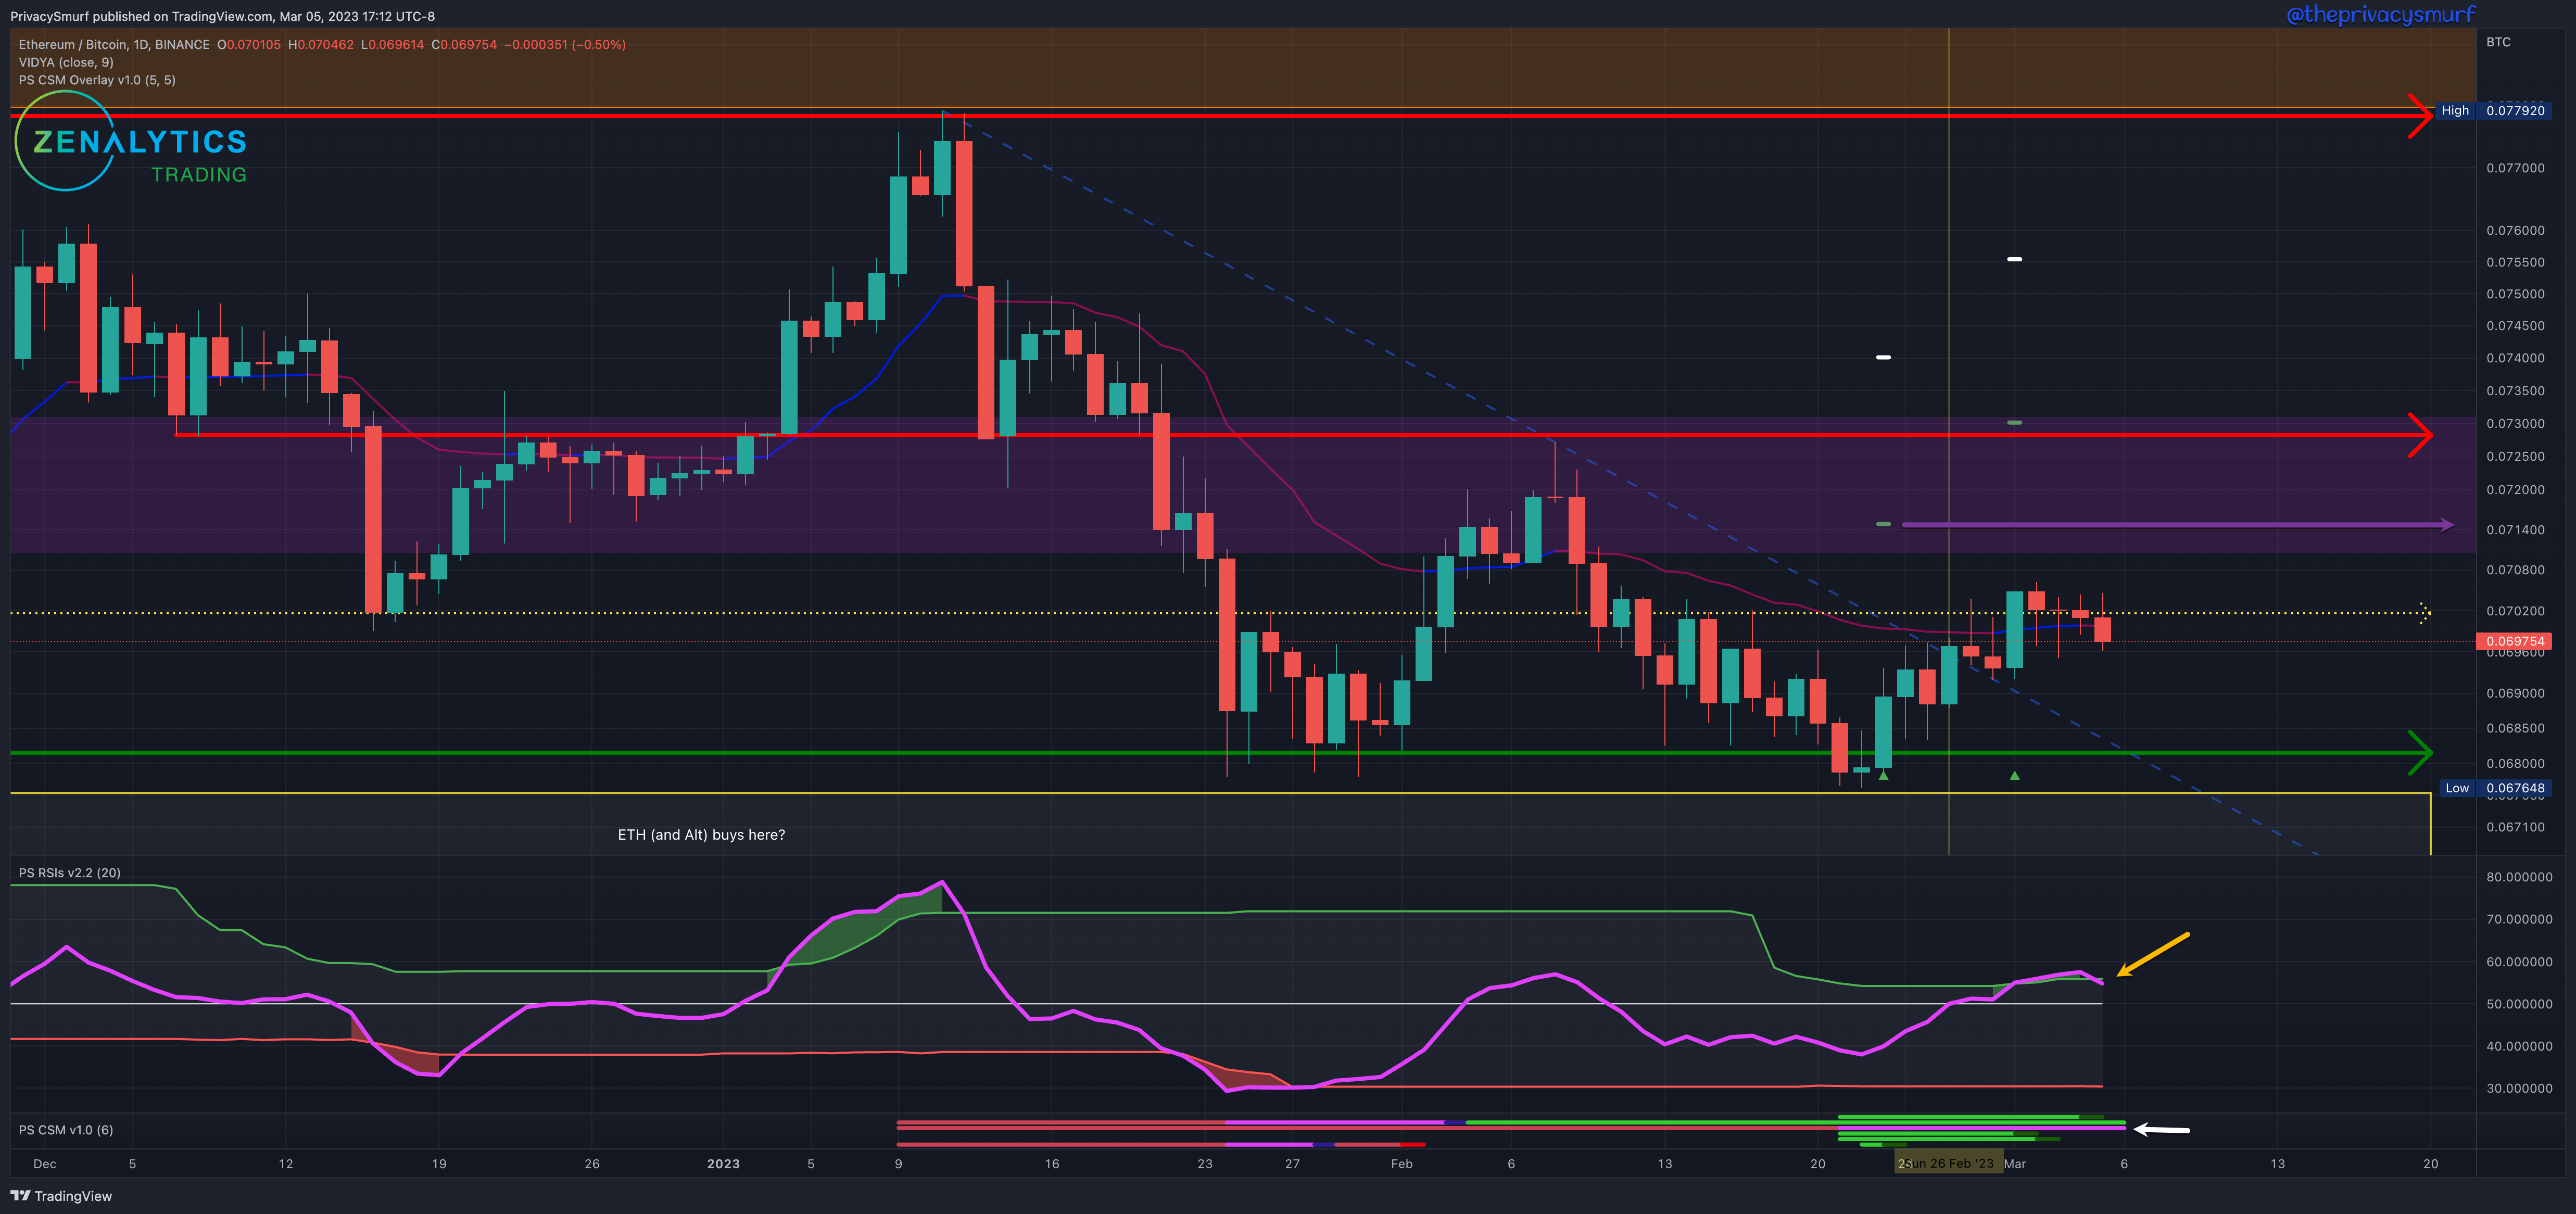
From last week:
”… still neutral but have a bullish bias… expecting a breakout eventually but that may not lead to a higher high close…”
The breakout with a new higher high close came midweek but failed to hold closing lower every day after. The bullish structure that has been built since Feb 22 will still be intact unless closing prices appear under 0.069. The RSI (yellow arrow) has also moved back between the bands as well suggesting we may have seen the range high and need more consolidation before breaking higher. While the ascending trend line break did have an impulsive bullish move it was stifled at horizontal resistance. This is typically why I avoid trendline breaks and focus on the horizontal levels. They are relevant enough to note, but I rarely trade them. The Correction Strength Meter (white arrow) is plotting both red and green suggesting mixed signals from oscillators. Since the breakout into new highs did not invalidate the bearish signal I typically avoid the signal until there is directional alignment. So even though there are bullish targets (purple arrow) plotted near 0.0714 I am not expecting that to be hit in the near term until oscillators are in agreement.
Given the current technicals for the week, I’m leaving ranges as they are at 0.068 and 0.073. My bias this week is still neutral but have a bullish bias. Ideally, we stay above 0.069 with daily closes and set a higher low. If the RSI manages to stay above the midline an intraday chart on the 2HR with bullish divergence and a breakout would be the time I’d front-run a bullish trade on a potential daily chart higher low. If the RSI fails to hold the midline on the daily chart I’d expect wicking below the most recent lowest close at 0.069 at a minimum.
ETH/USDT Daily Chart
https://www.tradingview.com/chart/xbB6lkZu/
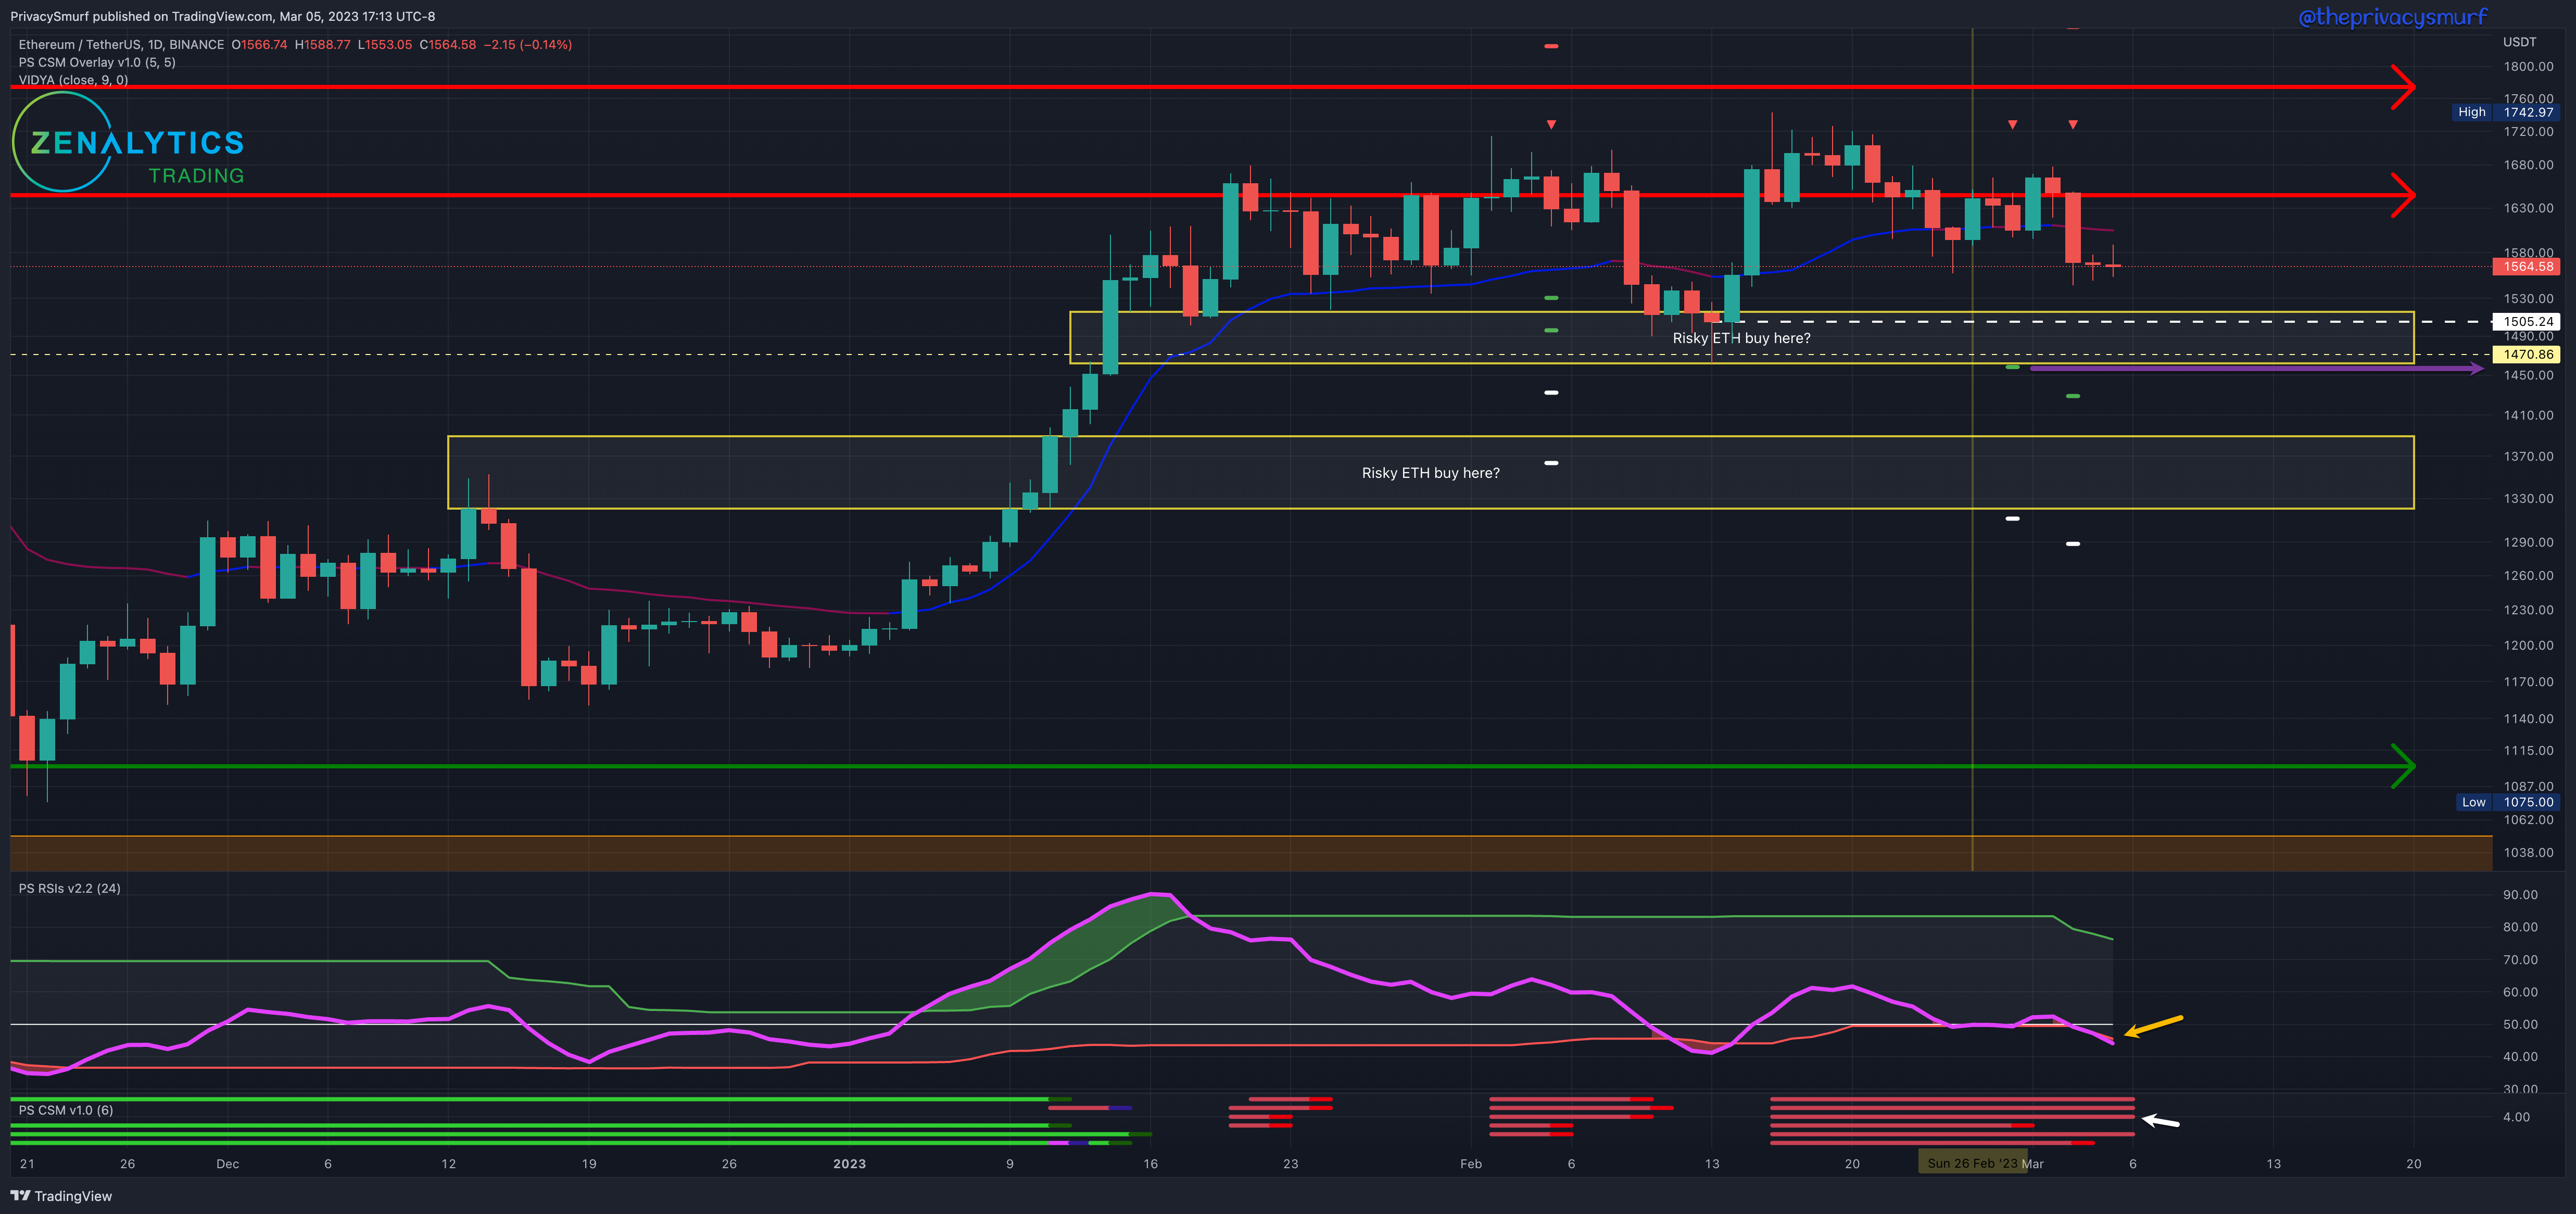
From last week:
“… bias this week is neutral (and I want to be bullish)… intraday charts around the oscillators on the 2HR timeframe must maintain alignment with the prices and not go into divergence on the price rise…”
Similar action on ETH as BTC. dull back and forth until big-time action. The bullish breakout came the same with the ETH/BTC chart but had the telltale warning signs of a false breakout as alluded to last week. The 2HR timeframe seen below shows the breakouts above the high resistance. As prices go higher the RSI is an ideal short condition (yellow arrow), not matching the new highs and showing a bearish divergence while also nearing the midline and bottom band. Breaking below the two would suggest bearish impulsivity. The Correction Strength Meter (white arrow) plots this divergence in red and signals a bearish trade (blue arrow). Both bearish targets (purple arrows) are hit soon after.

Given the current technicals for the week, I’m bringing the range down to $1500 - $1700. My bias this week is bearish to neutral. This is due to the RSI’s presentation. I’m expecting further bearishness until the RSI curls back into the bands. At that point, it’s possible the range low has been established. With the Correction Strength Meter (white arrow) still showing oscillators still playing out in bearish divergence and targets at around $1460 I still am expecting bearish behavior. Ideally, it’s an impulsive move down without multiple days closing below 1500. Breaking down from there would potentially be a much deeper retracement toward the $1300s.
See you next week. I hope you take a moment to come to check out the new site. It’s a great place if you want to interact with more Zenalytics readers and find some extra PrivacySmurf content.
https://www.zenalytics.info
@theprivacysmurf