

SS #72: Good Morning
SS #72: Good Morning
Green got the toes tapping.

If you haven’t registered for the new new site you should. I had to ditch the membership provider I was using but this new one is a MAJOR upgrade. I’m progressively bringing the content over. It’s more community based and has a similar feel to Facebook or MightyNetwork. There’s a chat functionality, direct messaging capabilities, live streams, and all my other free and paid content. I encourage you to check it out.
Zenalytics Trading
Am I trading crypto or playing Mario Kart on the beach racetrack??
I want to preface this week's newsletter with a clip from a zoom call back in early January. In that call, I provided some additional commentary on my expectations for the market in Q1. I've started the clip at the moment highlighting a time window where I expected to see increased volatility. That has proven to be a wildly accurate assessment.
In that light, the speculative expectations I put forth are pretty much just hunches and may be incredibly off when played out on the charts throughout the week. We are at a point in the market where there are probably both equal highs in macro fear and macro greed. This is the volatility we are seeing in the market. Long-term greedy market participants are buying massively and short to medium-term fearful participants are exiting massively and order books just can't stay full enough to prevent these wild swings.
I'm going to keep speculation to a minimum and leave out suggested ranges and try to provide mostly technical factors.
BTC/USDT Daily Chart
https://www.tradingview.com/chart/jjSdFW4b/
From last week:
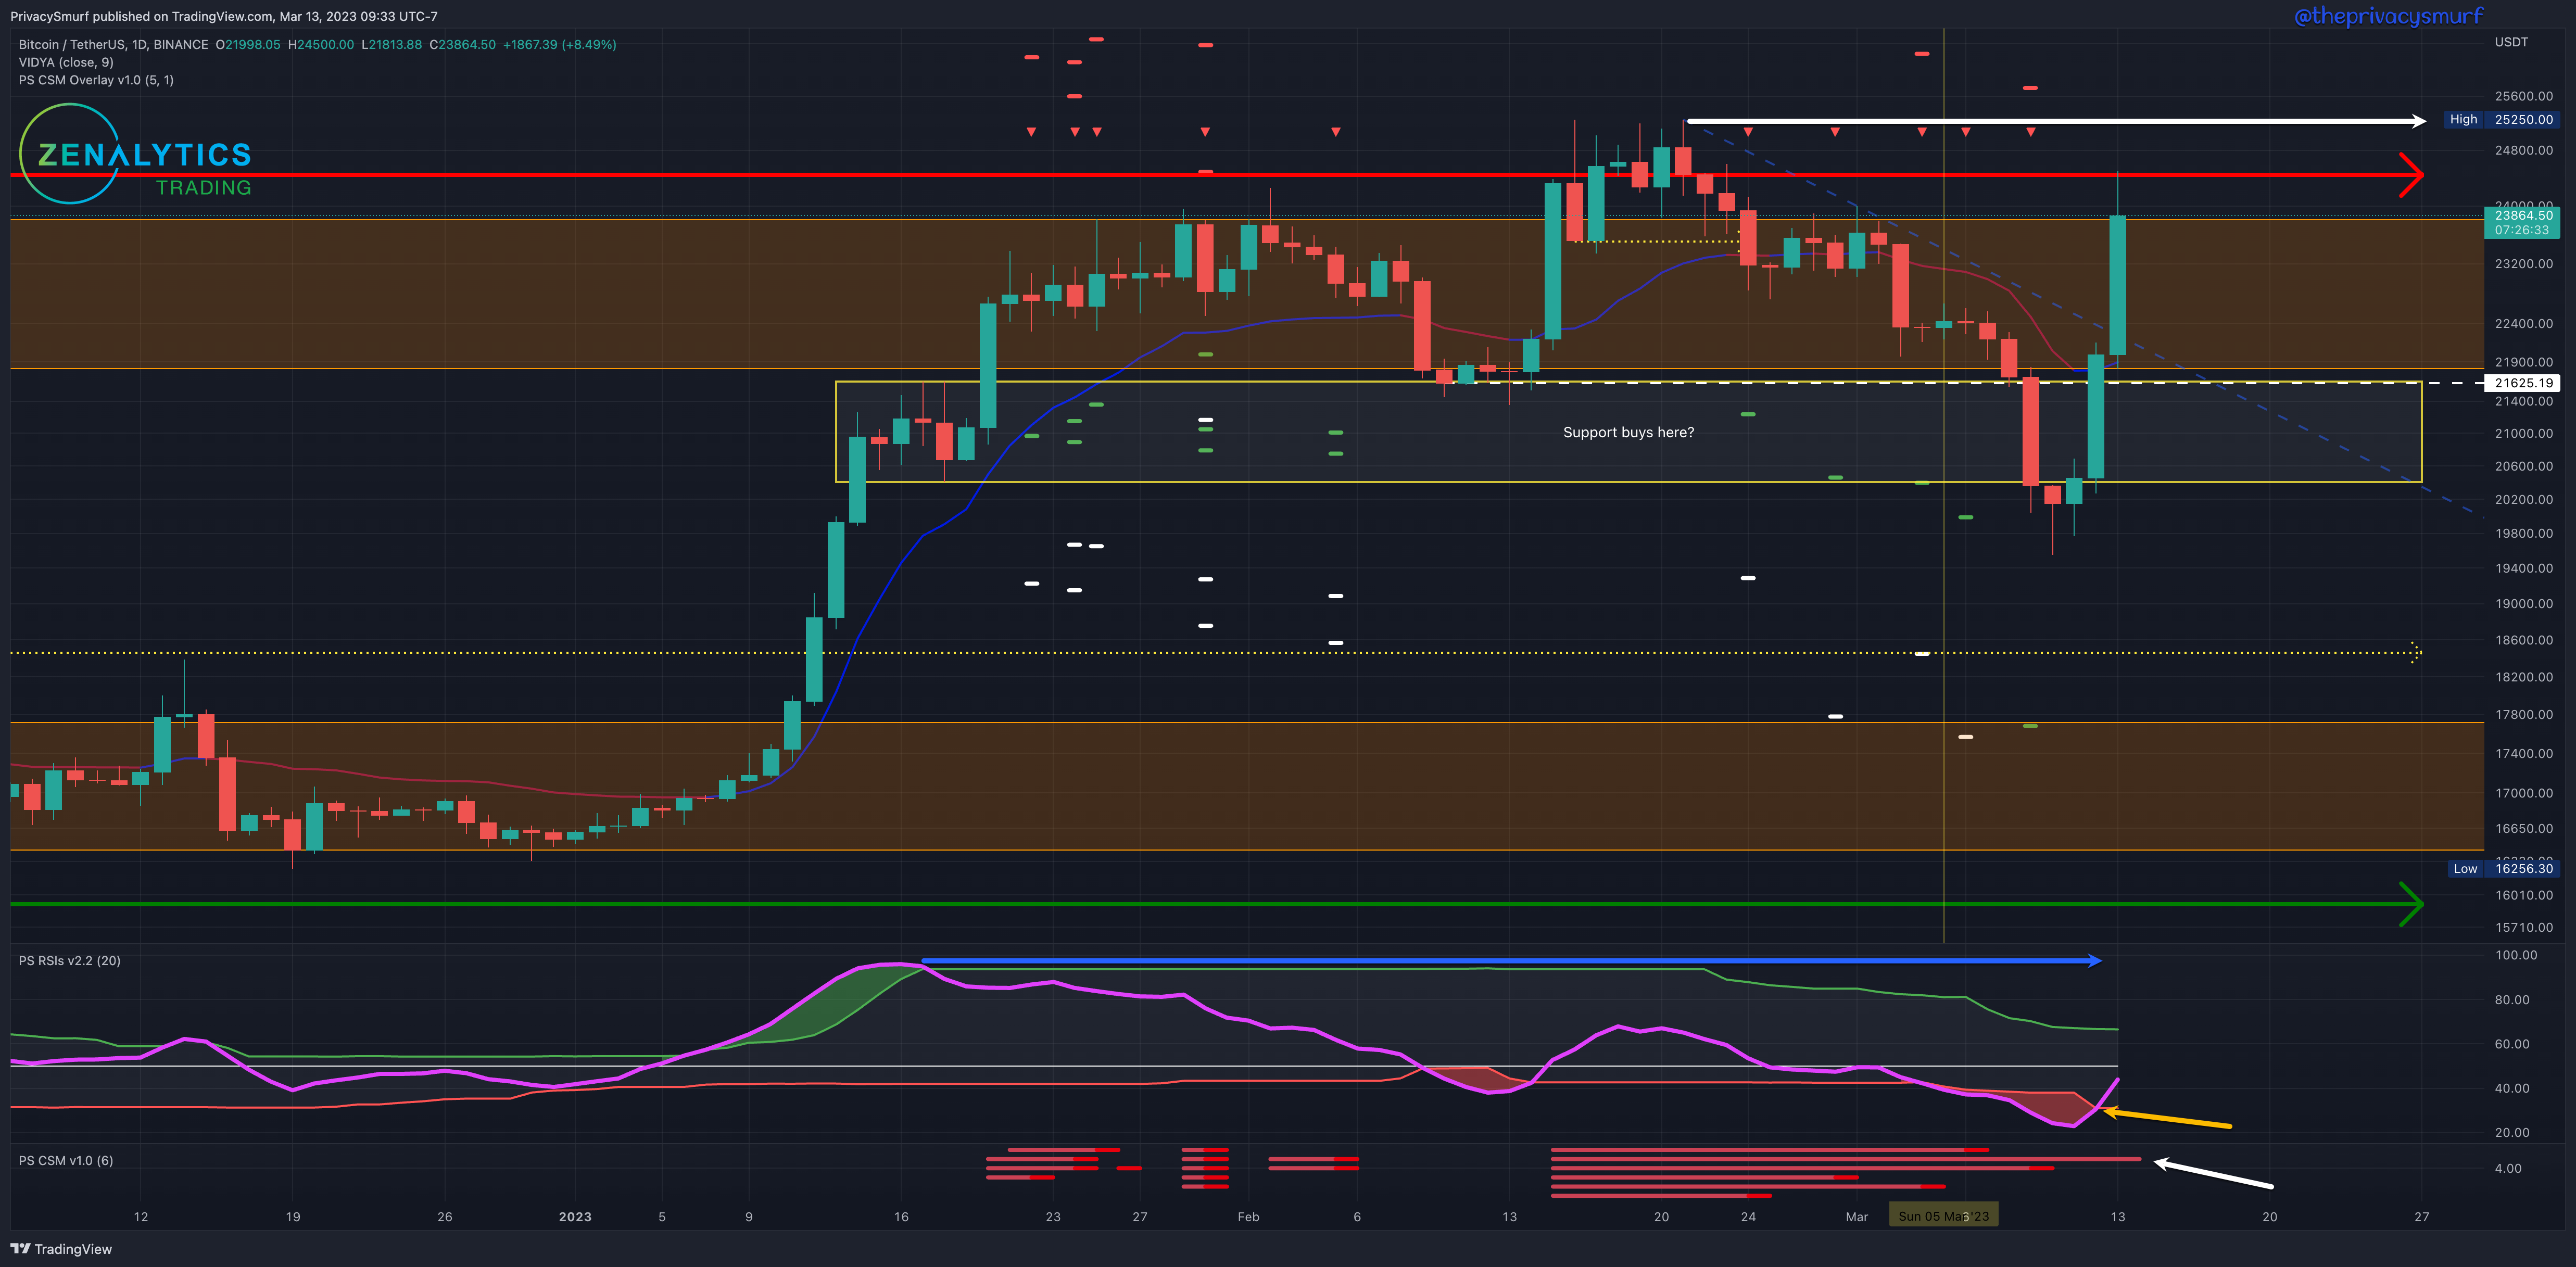
”… still am expecting bearish behavior… Breaking down with new lower low closes would likely mean a deeper retracement toward the bottom of the next support zone around $20k...”
The lowest support range was met this week while also setting a lower low close. This would suggest the potential for a further bearish retracement. However, as of the time of writing BTC is well on its way to setting a higher close than the last downward pivot point on the first of March.
The RSI has secured its positing back inside the bottom band (yellow arrow) which would suggest the range low has been established just above $20k. The RSI is also making its way toward the midline and top band. Breaking above those would suggest the potential for even greater bullish impulsivity than we have seen (which is impressive).
I've annotated on the price chart a white arrow at the highest high. I've also annotated the RSI with a blue arrow(? colorblind and I forgot what color I picked, haha) at the last highest high value of the RSI. If prices touch above the highest high I highly doubt the RSI will also be at a new high. This will create a bearish divergence and quite a large one. This would suggest a deeper retracement than what we have seen recently. I imagine somewhere down toward the bottom support zone but it's too early to tell that sort of thing. My indicator the Correction Strength Meter (white arrow at the bottom) is still showing an oscillator still in the bearish divergence that hasn't triggered a bearish trade signal yet. I imagine if we get about the range high ALL the oscillators will be in bearish setups.
Given the week's current technicals, I'd be suggesting a range normally but now I'm not going to do that.
My bias is extremely mixed so I'm not doing much. Here are my two considerations though.
The 2hr chart may signal failure at the resistance and highest high. That is a bearish signal I'd consider taking but it's pretty risky in the face of all of this bullish price action.
If the 20-minute and 2hr charts are showing invalidation of the bearish divergences at those high levels I'd take the long play for the breakout.
ETH/BTC Daily Chart
https://www.tradingview.com/chart/gTkSjkj6/
From last week:
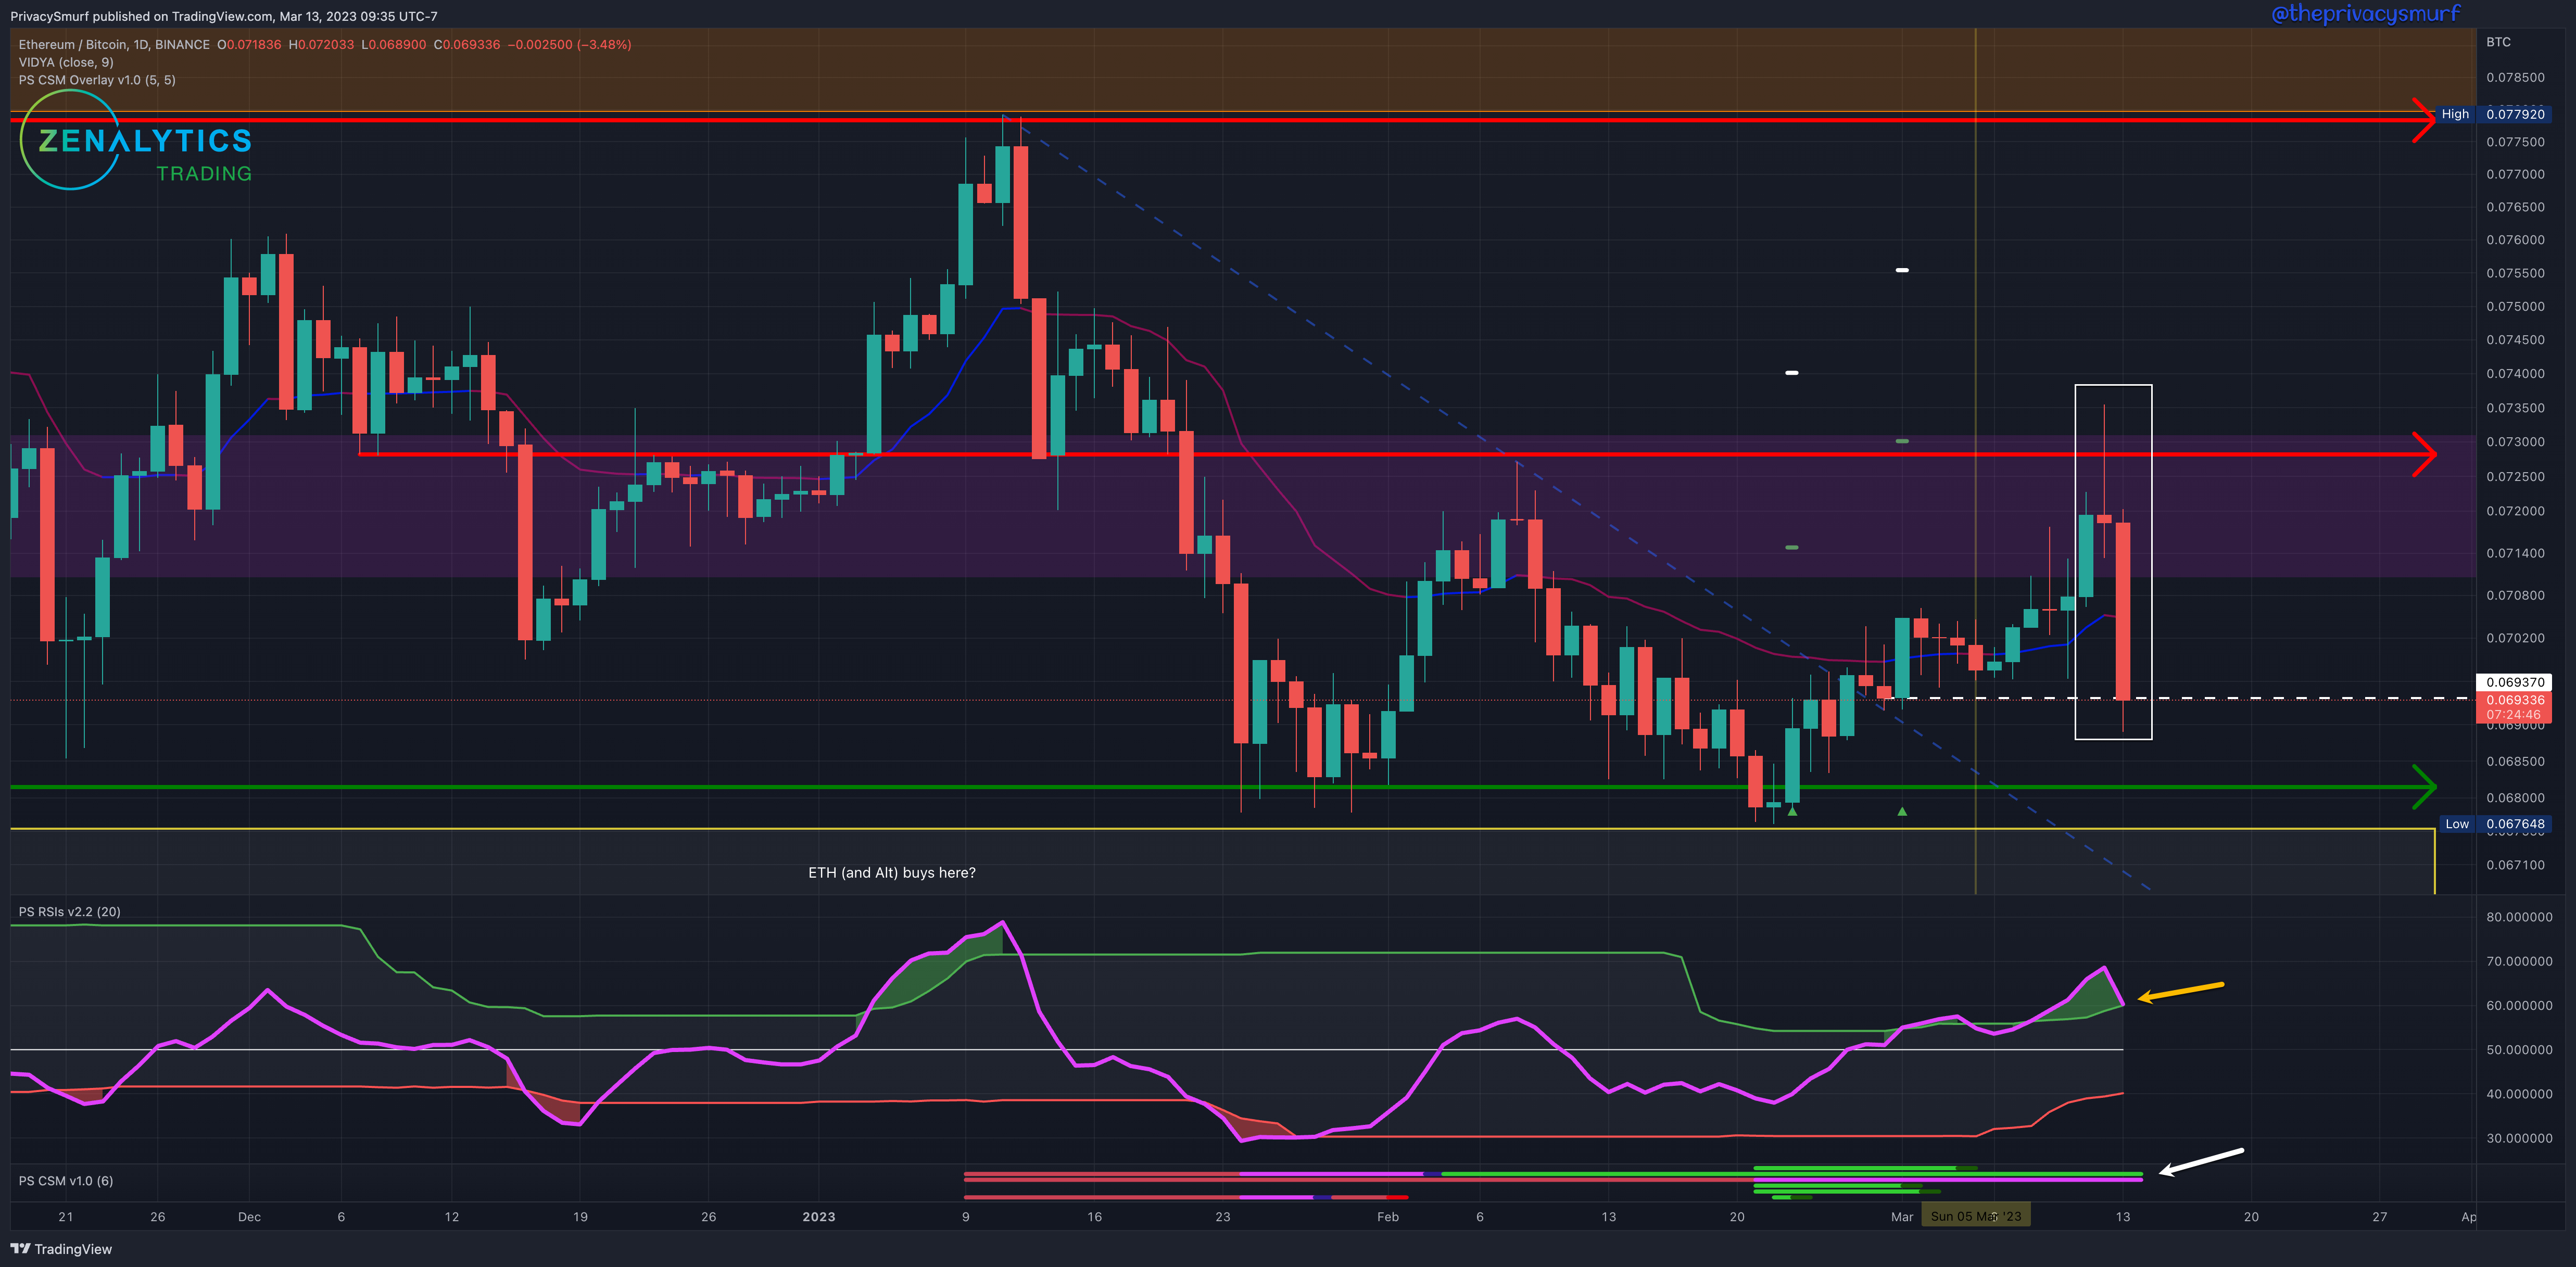
”…neutral but have a bullish bias…”
While this chart looks bullish it mostly meant the ETH failed less than BTC did. The upper resistance at .073 and lower support at .068 continue to be the range to make plays rotating between the two.
On the price chart, I've highlighted a price action candle formation in a white box. This is an evening star. It's typically considered a bearish reversal pattern. The theory being the market rallied for a day, and continued to rally during the second day but was met with stiff rejection from sellers creating a long upper wick and close lower than the first day's rally. The following day's close below the open of the first-day rally would suggest sellers have taken control of the market. There are many ways this can be objectively defined and this is a general explanation and suggests further bearishness.
There are still mixed bullish and bearish signals coming from the Correction Strength Meter (white arrow) so I don't anticipate any really long trending price action and further rangebound behavior.
Given the current technicals for the week, I’m leaving ranges as they are at 0.068 and 0.073.
My bias this week is still neutral and am simply moving back and forth between the two assets in the range of highs and lows. Taking BTC and making it ETH at the lows and selling the ETH back to BTC at the highs.
The RSI (yellow arrow) hasn't yet closed back inside the top band yet as Monday is still an active trading day at the time of writing but I anticipate it will close inside the bands. This would suggest the local range high again is confirmed in place around 0.072.
If there are bullish divergences on the 2HR timeframe at the support I'd use that to start the next rotation from BTC to ETH.
ETH/USDT Daily Chart
https://www.tradingview.com/chart/xbB6lkZu/
From last week:
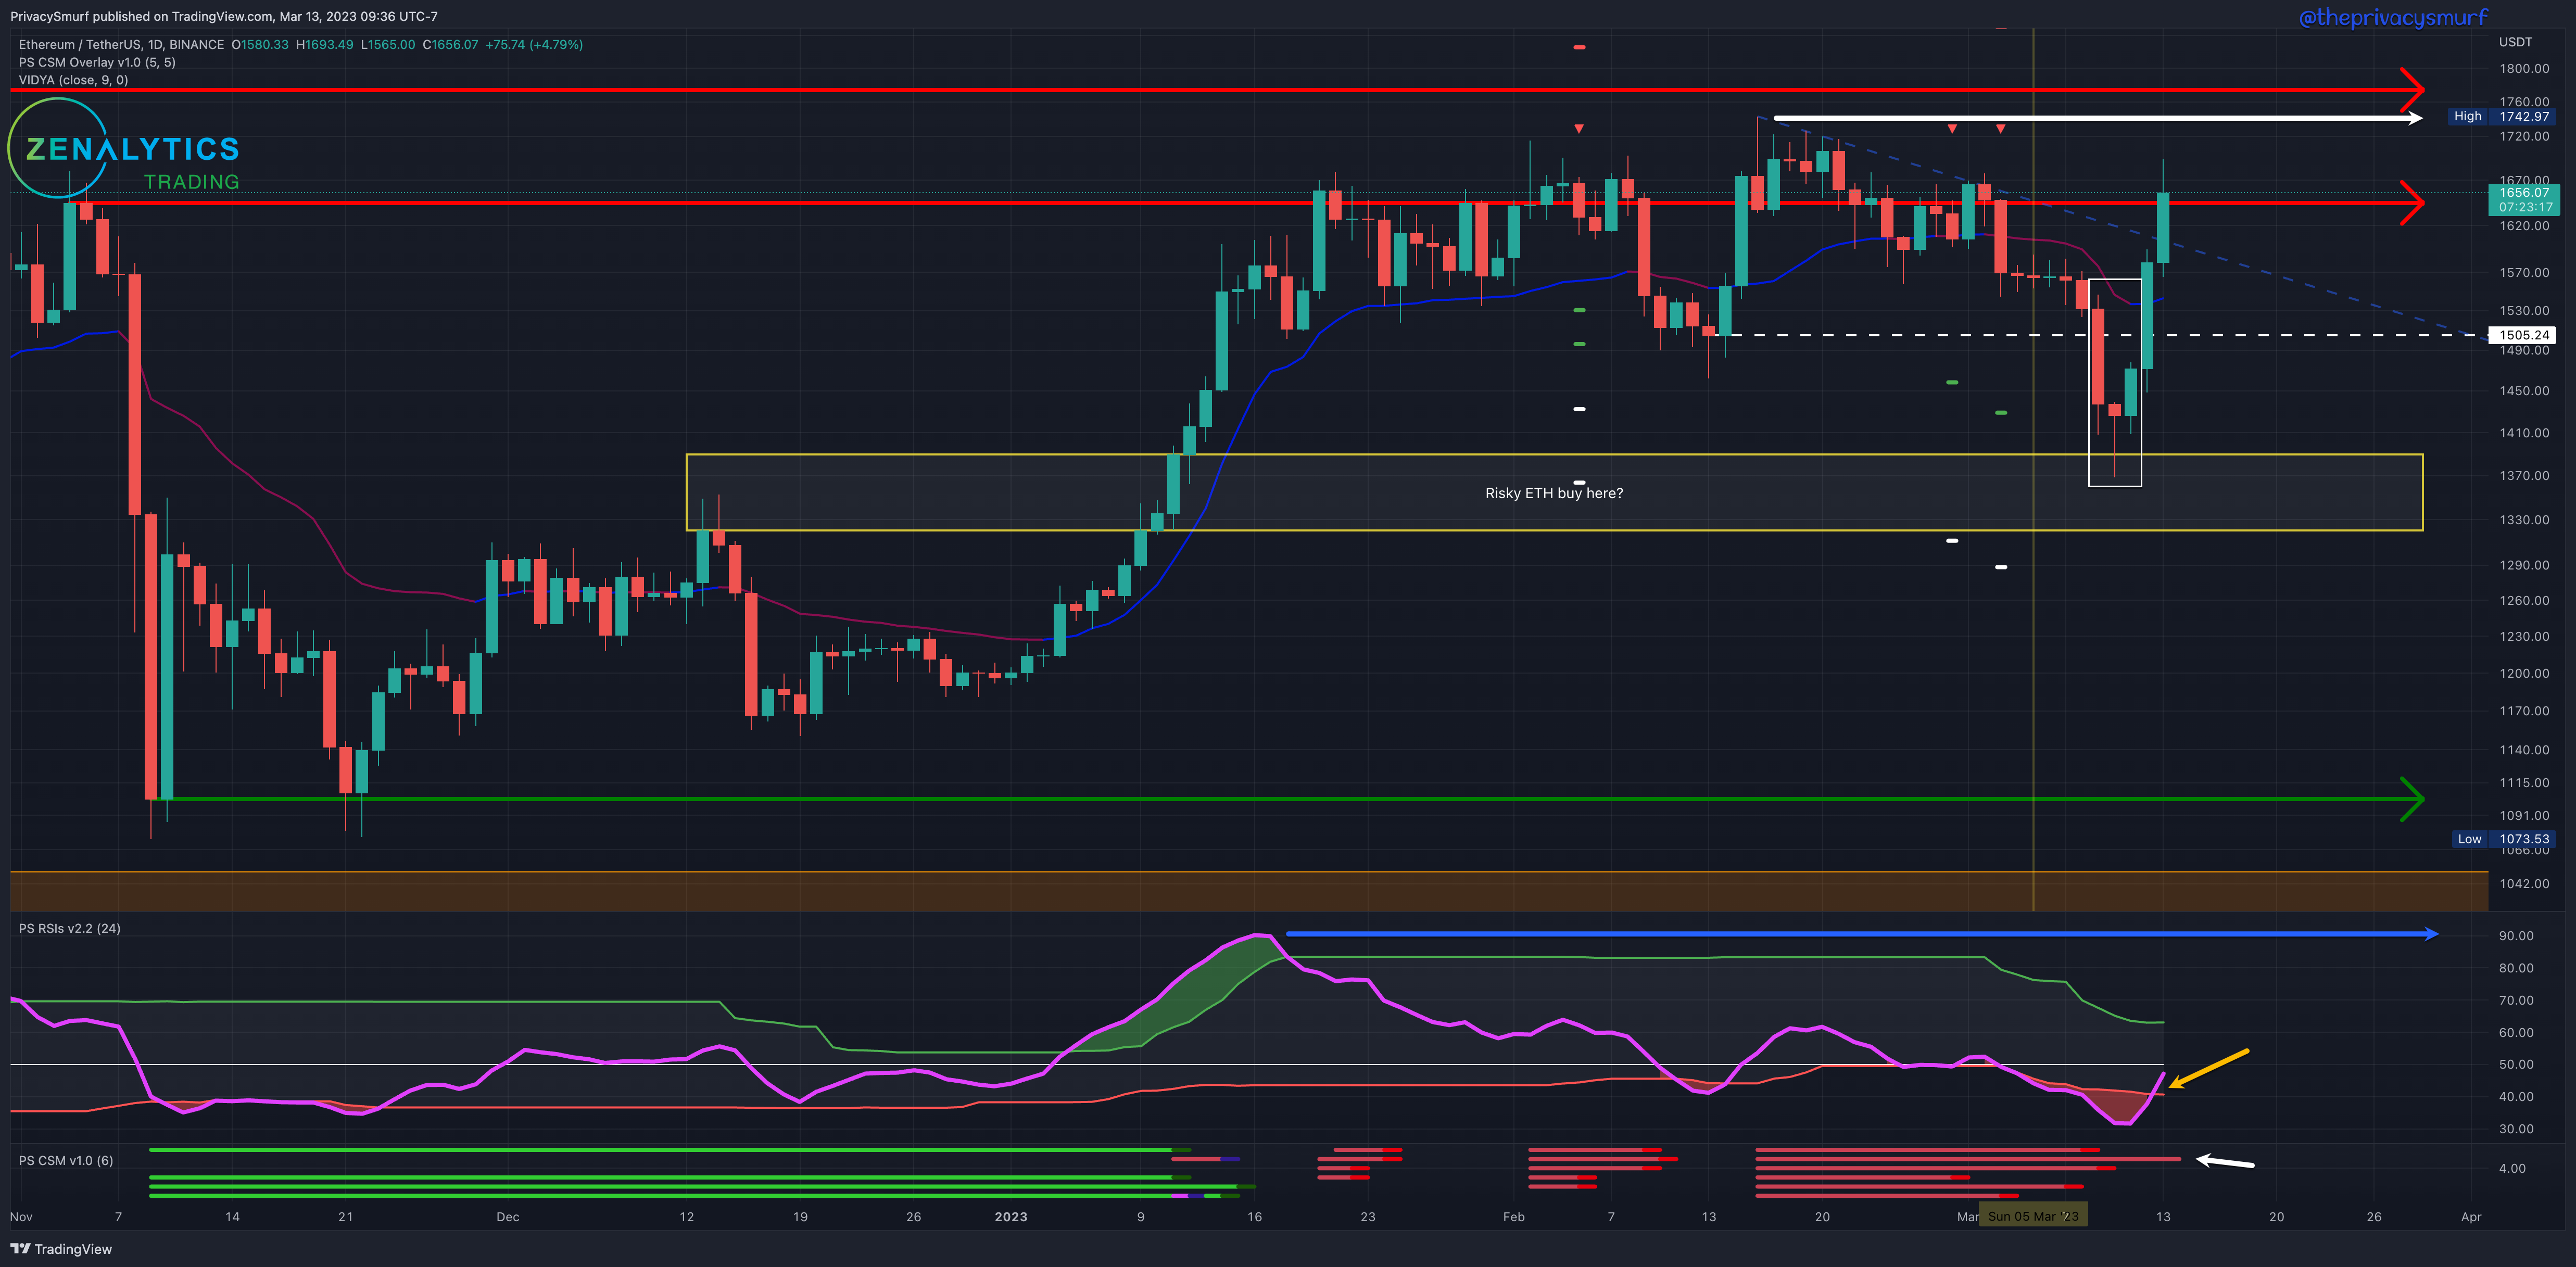
“… expecting further bearishness until the RSI curls back into the bands…”
The support range was met this week while also setting a lower low close. There were no clear signals on the 2HR chart of a bullish reversal but the 20min did have a good setup. The lack of a 2HR signal further reinforced the suggestion of a risky buy setup but that turned out to be a very good reward.
The setting of a new lower close on the daily chart would suggest the potential for a further bearish retracement. However, as of the time of writing ETH is well on its way to setting a higher close than the last downward pivot point on the first of March.
The RSI has secured its positing back inside the bottom band (yellow arrow) which would suggest the range low has been established just above $1425. The RSI is also making its way toward the midline and top band. Breaking above those would suggest the potential for even greater bullish impulsivity than we have seen (which is impressive).
I've annotated on the price chart a white arrow at the highest high. I've also annotated the RSI with a blue arrow at the last highest high value of the RSI. If prices touch above the highest high I highly doubt the RSI will also be at a new high. This will create a bearish divergence and quite a large one. This would suggest a deeper retracement than what we have seen recently. I imagine somewhere down toward the bottom support zone but it's too early to tell that sort of thing. My indicator the Correction Strength Meter (white arrow at the bottom) is still showing an oscillator still in the bearish divergence that hasn't triggered a bearish trade signal yet. I imagine if we get about the range high ALL the oscillators will be in bearish setups.
Given the week's current technicals, I'd be suggesting a range normally but now I'm not going to do that.
My bias is extremely mixed so I'm not doing much. Here are my two considerations though.
The 2hr chart may signal failure at either resistance (1650 or 1770) or the highest high. That is a bearish signal I'd consider taking but it's pretty risky in the face of all of this bullish price action.
If the 20-minute and 2hr charts are showing invalidation of the bearish divergences at those levels I'd take the long play for the breakout.
Have a good week but don’t get too crazy with positions. We aren’t in full on bull market yet.
@theprivacysmurf