

SS #73 Club Foot
SS #73 Club Foot
One, take control of me? You're messing with the enemy

If you haven’t registered for the new new site you should. I had to ditch the membership provider I was using but this new one is a MAJOR upgrade. I’m progressively bringing the content over. It’s more community based and has a similar feel to Facebook or MightyNetwork. There’s a chat functionality, direct messaging capabilities, live streams, and all my other free and paid content. I encourage you to check it out.
Zenalytics Trading
I feel like the last few years have really been the best times for the bitcoin narrative.
The same volatile conditions that I spoke about last week are still present in the market so I'm still going to keep speculation to a minimum and leave out suggested ranges and try to provide mostly technical factors. We may be getting closer to some stabilization and I'll get into that lower in the synopsis with things to look for.
The below formation has been a pretty repetitive pattern to look for trading opportunities since this wedge took shape in Feb. It's represented across the market in many trading pairs.
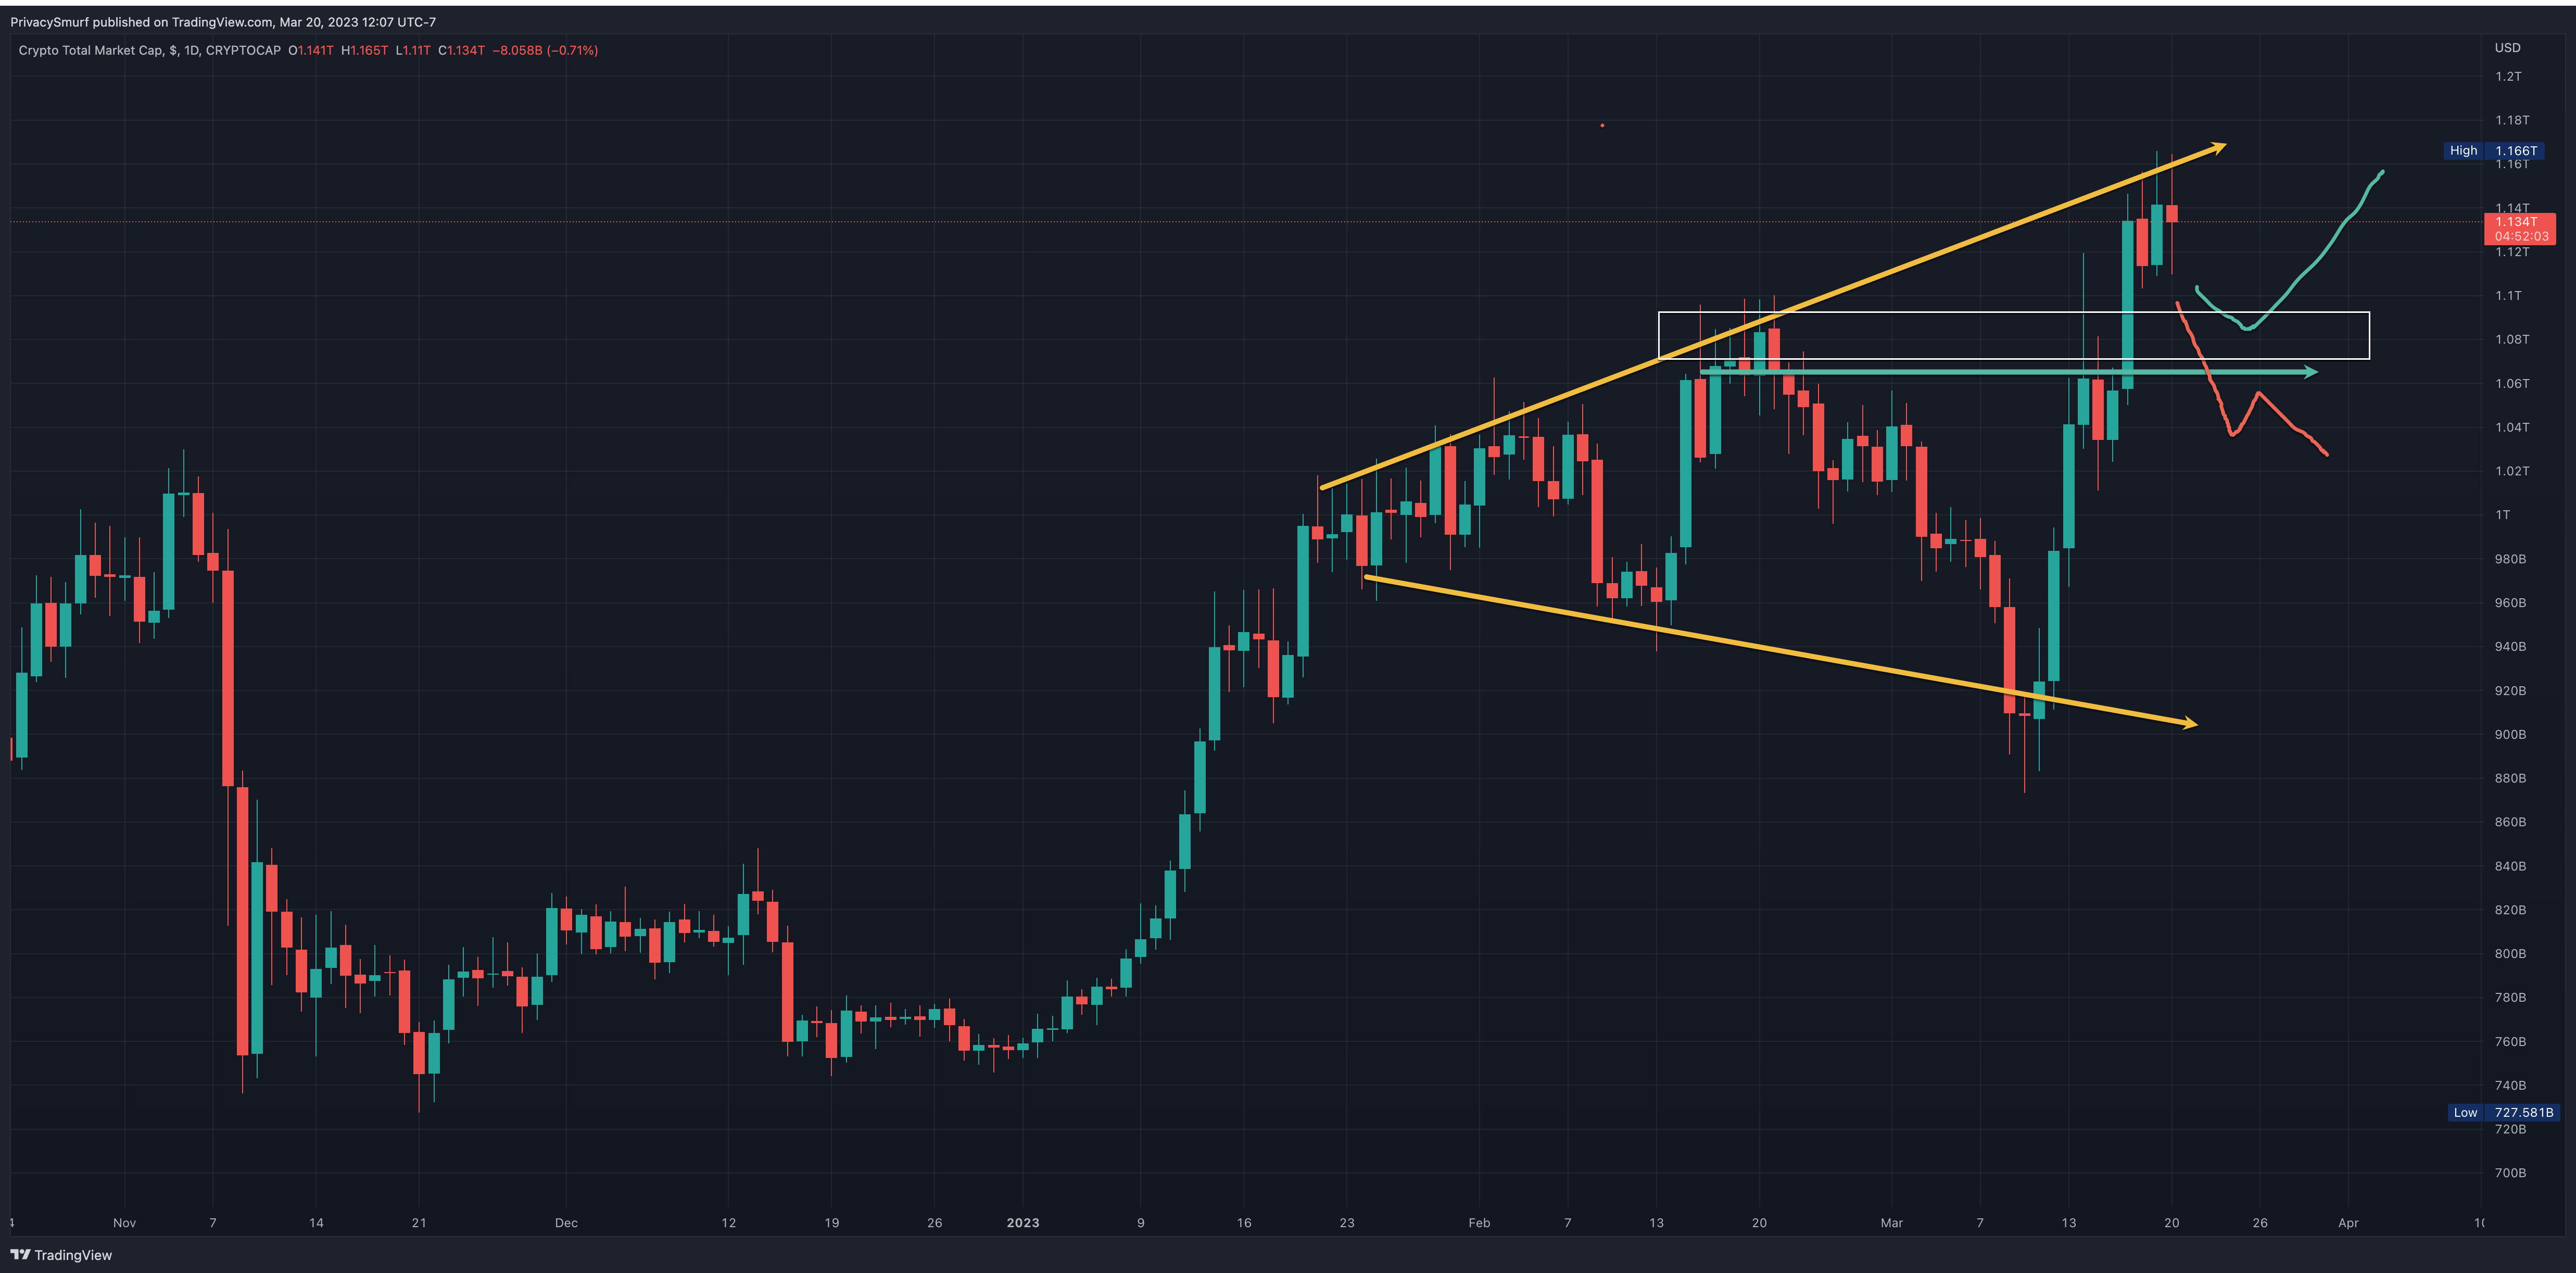
BTC/USDT Daily Chart
https://www.tradingview.com/chart/jjSdFW4b/
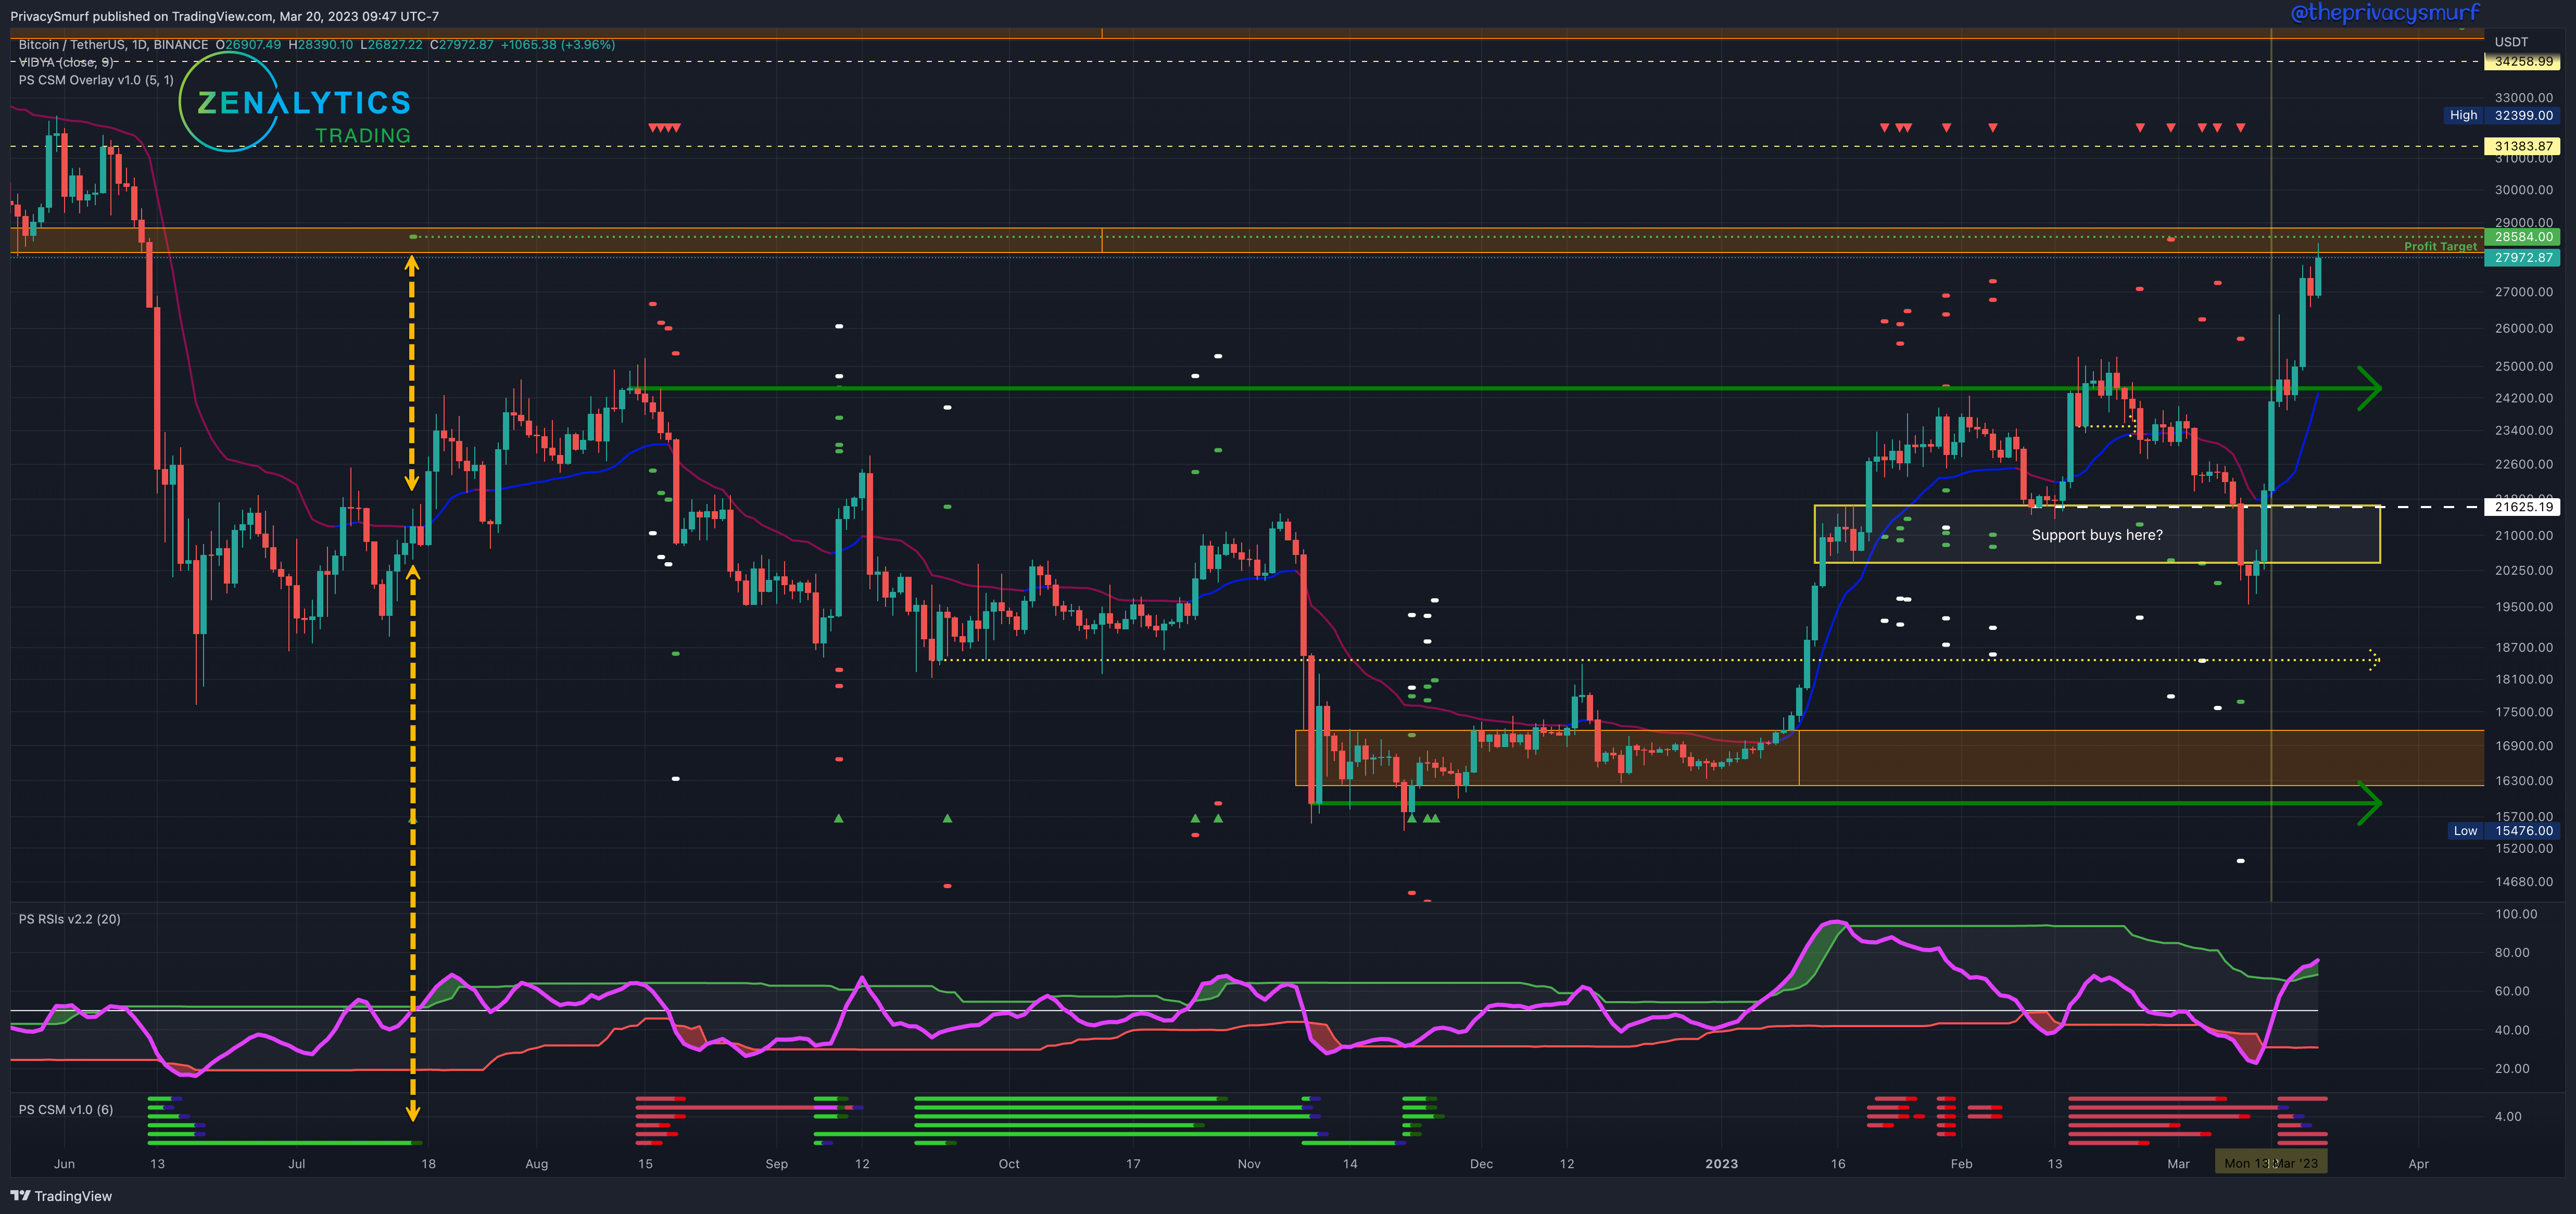
Above we have a snapshot zooming out to see a trade signaled (yellow arrows) after the failure from $30k. by the momentum oscillator, which is a constituent of the Correction Strength Meter. It was never stopped out and is moving up towards the profit target. It is not uncommon to see a retracement after meeting these divergence targets.
From last week:
”… RSI is also making its way toward the midline and top band. Breaking above those would suggest the potential for even greater bullish impulsivity than we have seen… If the 20-minute and 2hr charts are showing invalidation of the bearish divergences at those high levels I'd take the long play...”
Invalidations of bearish divergences started popping up across all the timeframes I monitor (20min, 2HR, Daily) on Tuesday along with the RSI breaking above the adaptive top band (yellow arrow), multiple confluences suggesting the potential for bullish continuation instead of the failure of the overall bullish move. The follow-on price action led to the highest high close since June of last year on Thursday.
The Correction Strength Meter (white arrow) is still plotting bearish reversal conditions despite the new highs but without getting too far into the methodology, if momentum can remain high over the next week these conditions will likely all be invalidated. That being said it's not all sunshine and roses and green candles on the horizon. There is still weakness in the market. It is more evident in ETH and we'll get into it further down in the post.
Given the week's current technicals, I'd be suggesting a range normally but now I'm not going to do that. It will be important to monitor the RSI. If it curls back into the bands that would suggest that the resistance is our local range high for the time being. Staying above the top band and I would expect more bullish price action.
My bias is still bullish as I'm long from the breakout from the lower ranges as suggested last week, but if I weren't in a long position I wouldn't be opening a new position here until higher as we are still under untested resistance. As we are in pretty much the same setup here are my two considerations for entry if I were not in the market.
The 2hr chart may signal failure at the resistance and highest high. A bearish divergence with a matching bearish RSI breakout is a bearish signal I'd consider taking but it's pretty risky in the face of all of this bullish price action.
If the 20-minute and 2hr charts are showing invalidation of the bearish divergences at 28k I'd take the long play for the breakout.
ETH/BTC Daily Chart
https://www.tradingview.com/chart/gTkSjkj6/
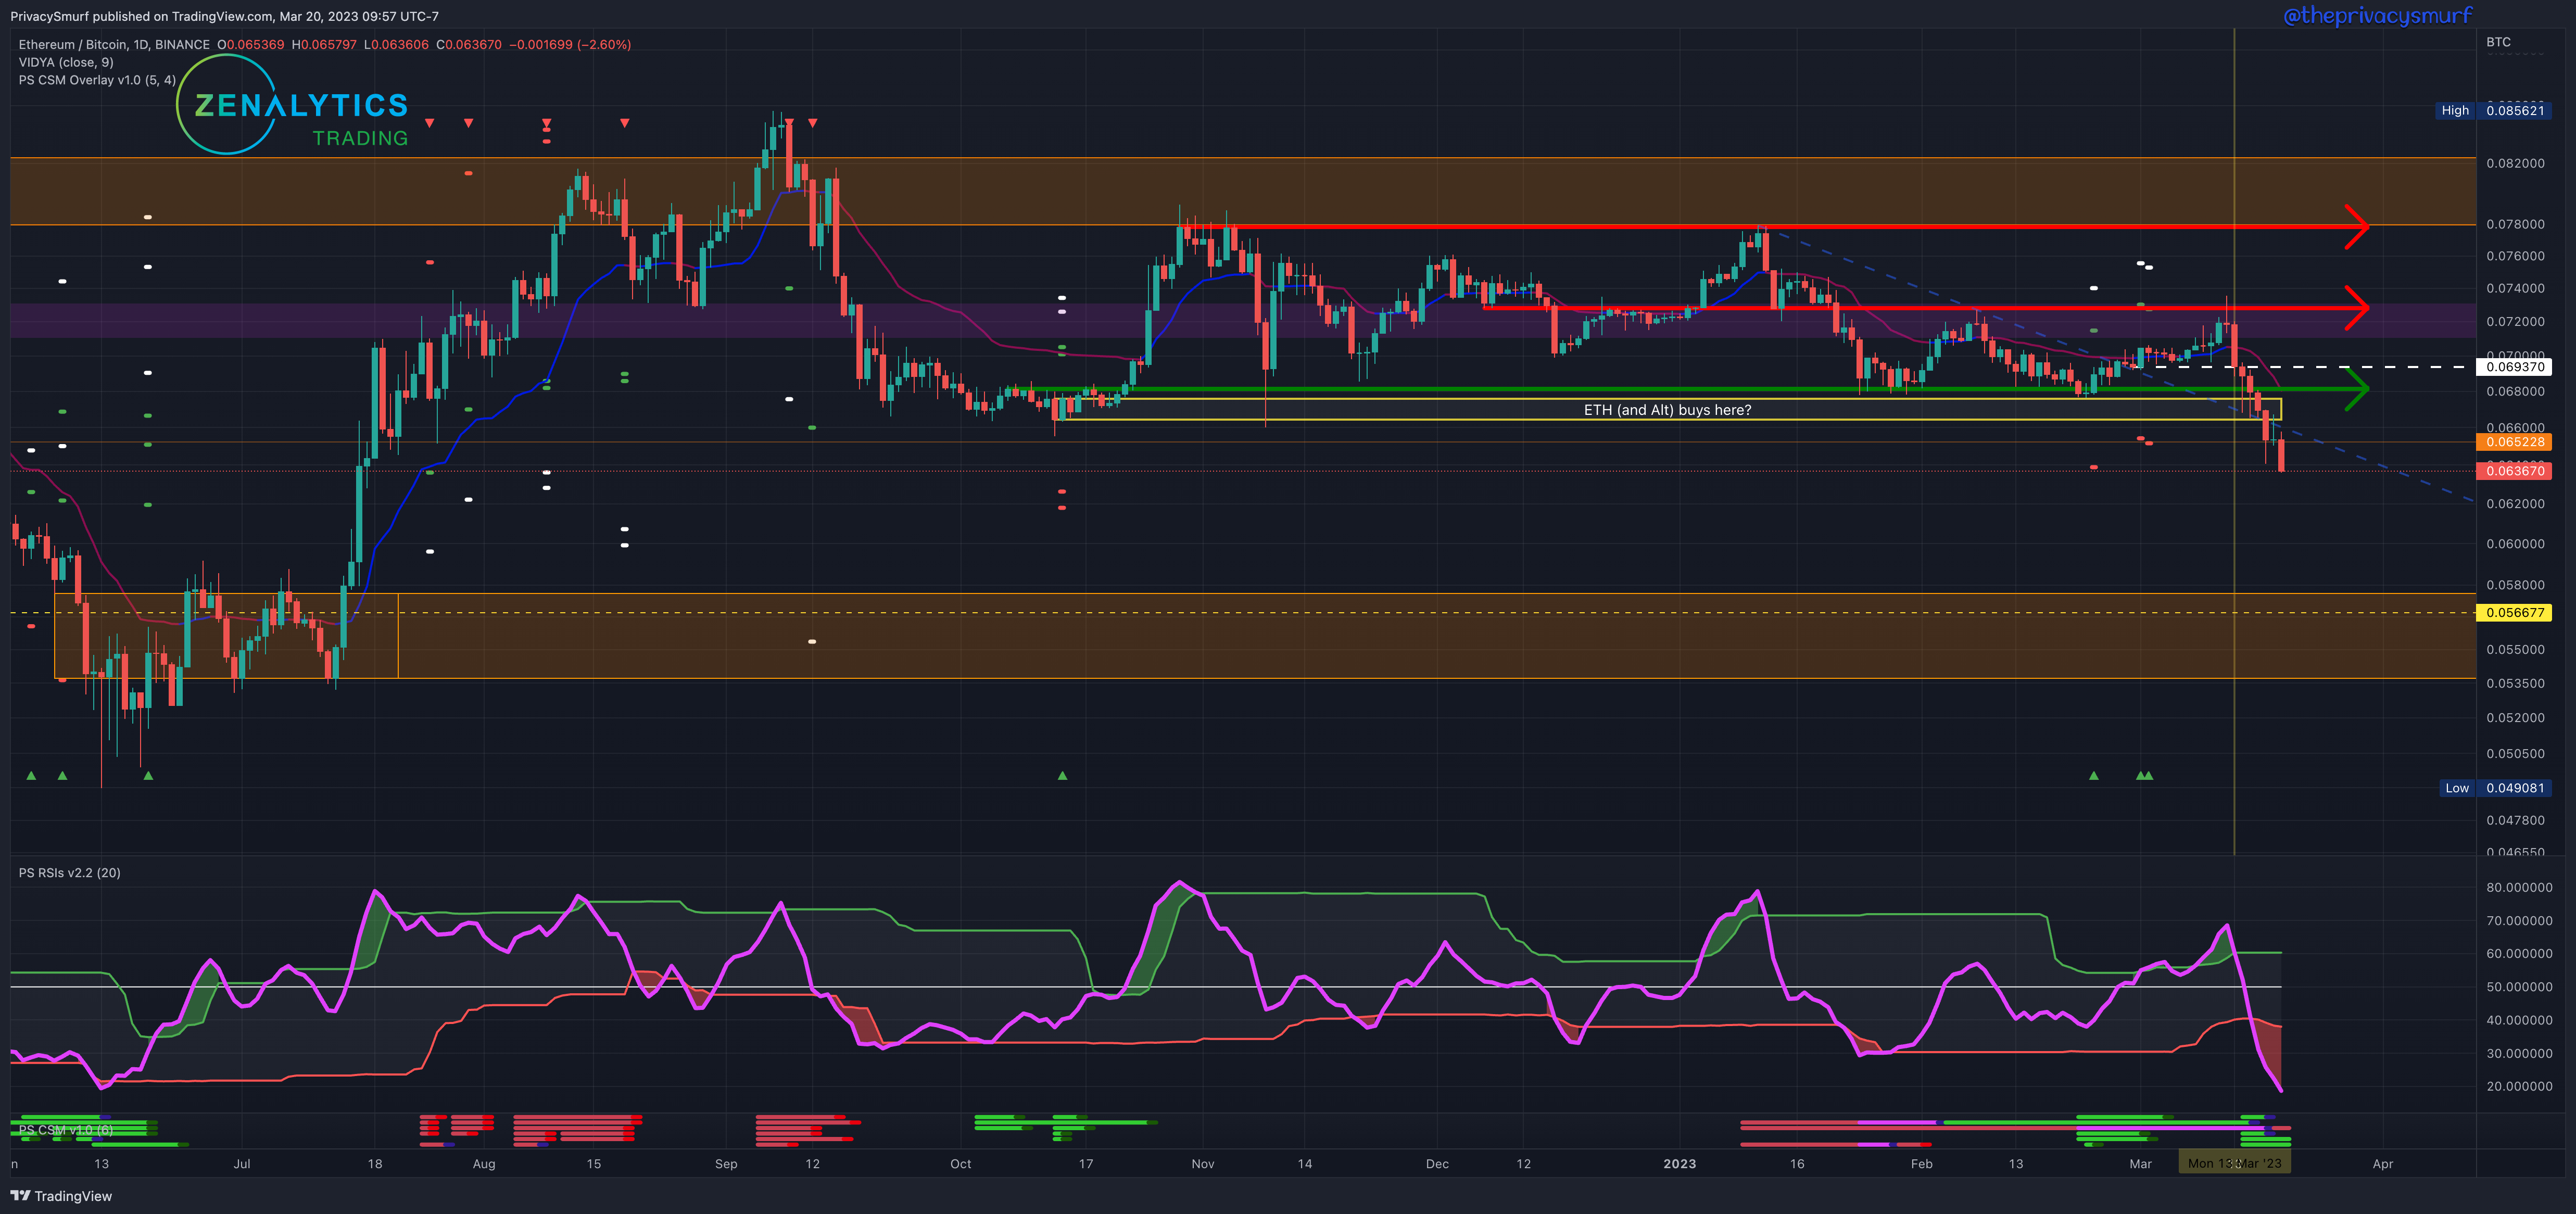
I have to zoom out pretty far to show the next lower level for ETH/BTC.
From last week:
”…the local range high again is confirmed in place around 0.072… If there are bullish divergences on the 2HR timeframe at the support I'd use that to start the next rotation from BTC to ETH...”
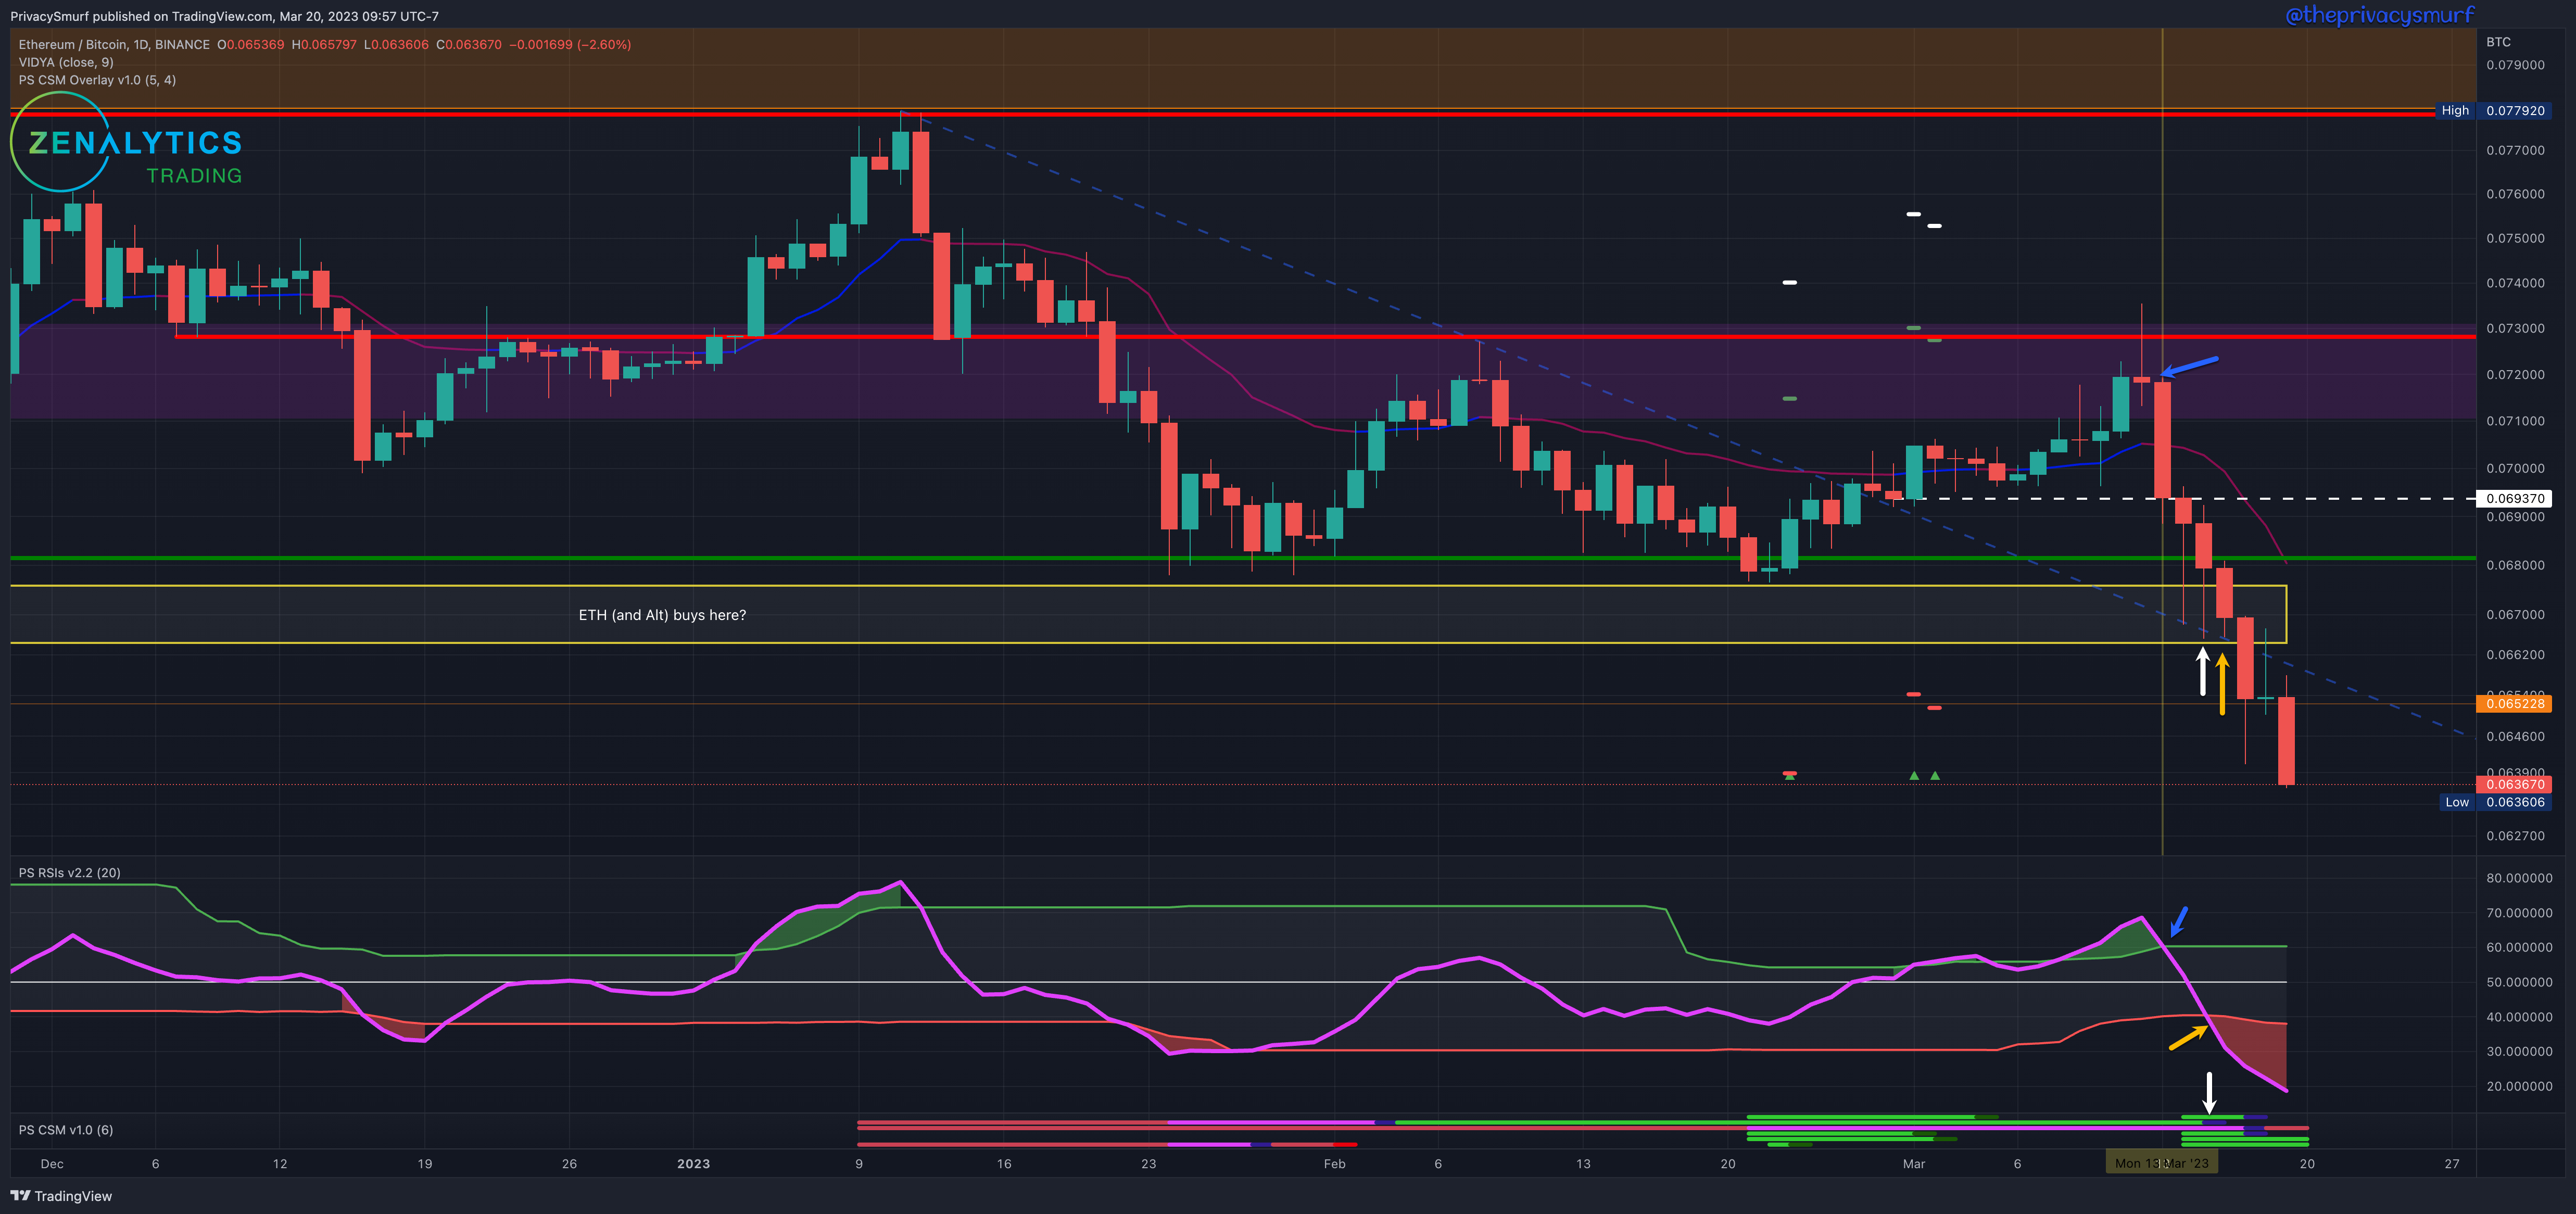
Monday evening confirmed the range high as the RSI closed inside the top band (blue arrows). Bullish divergences popped up on Tuesday and Wednesday on the 2HR timeframe(unpictured) as ETH/BTC traded into the support zone and bounced off the descending trendline (price chart white arrow). A rotation of ETH to BTC was entertained but by the close of the daily chart on Wednesday the Correction Strength Meter showed invalidation bullish reversal conditions which suggest a bearish continuation and a rotation back to BTC is indicated because BTC will be the stronger asset relatively. The next day the RSI breaks below the adaptive bottom band (yellow arrows) and the bottom falls out of the price chart.
Given the current technicals for the week, I’m not entertaining the idea of a new rotation at least until the RSI can move back into the bands, which would suggest a local bottom.
My bias this week is bearish although I'm not exposed and making no moves in reference to this chart. There's no historical support until around .062.
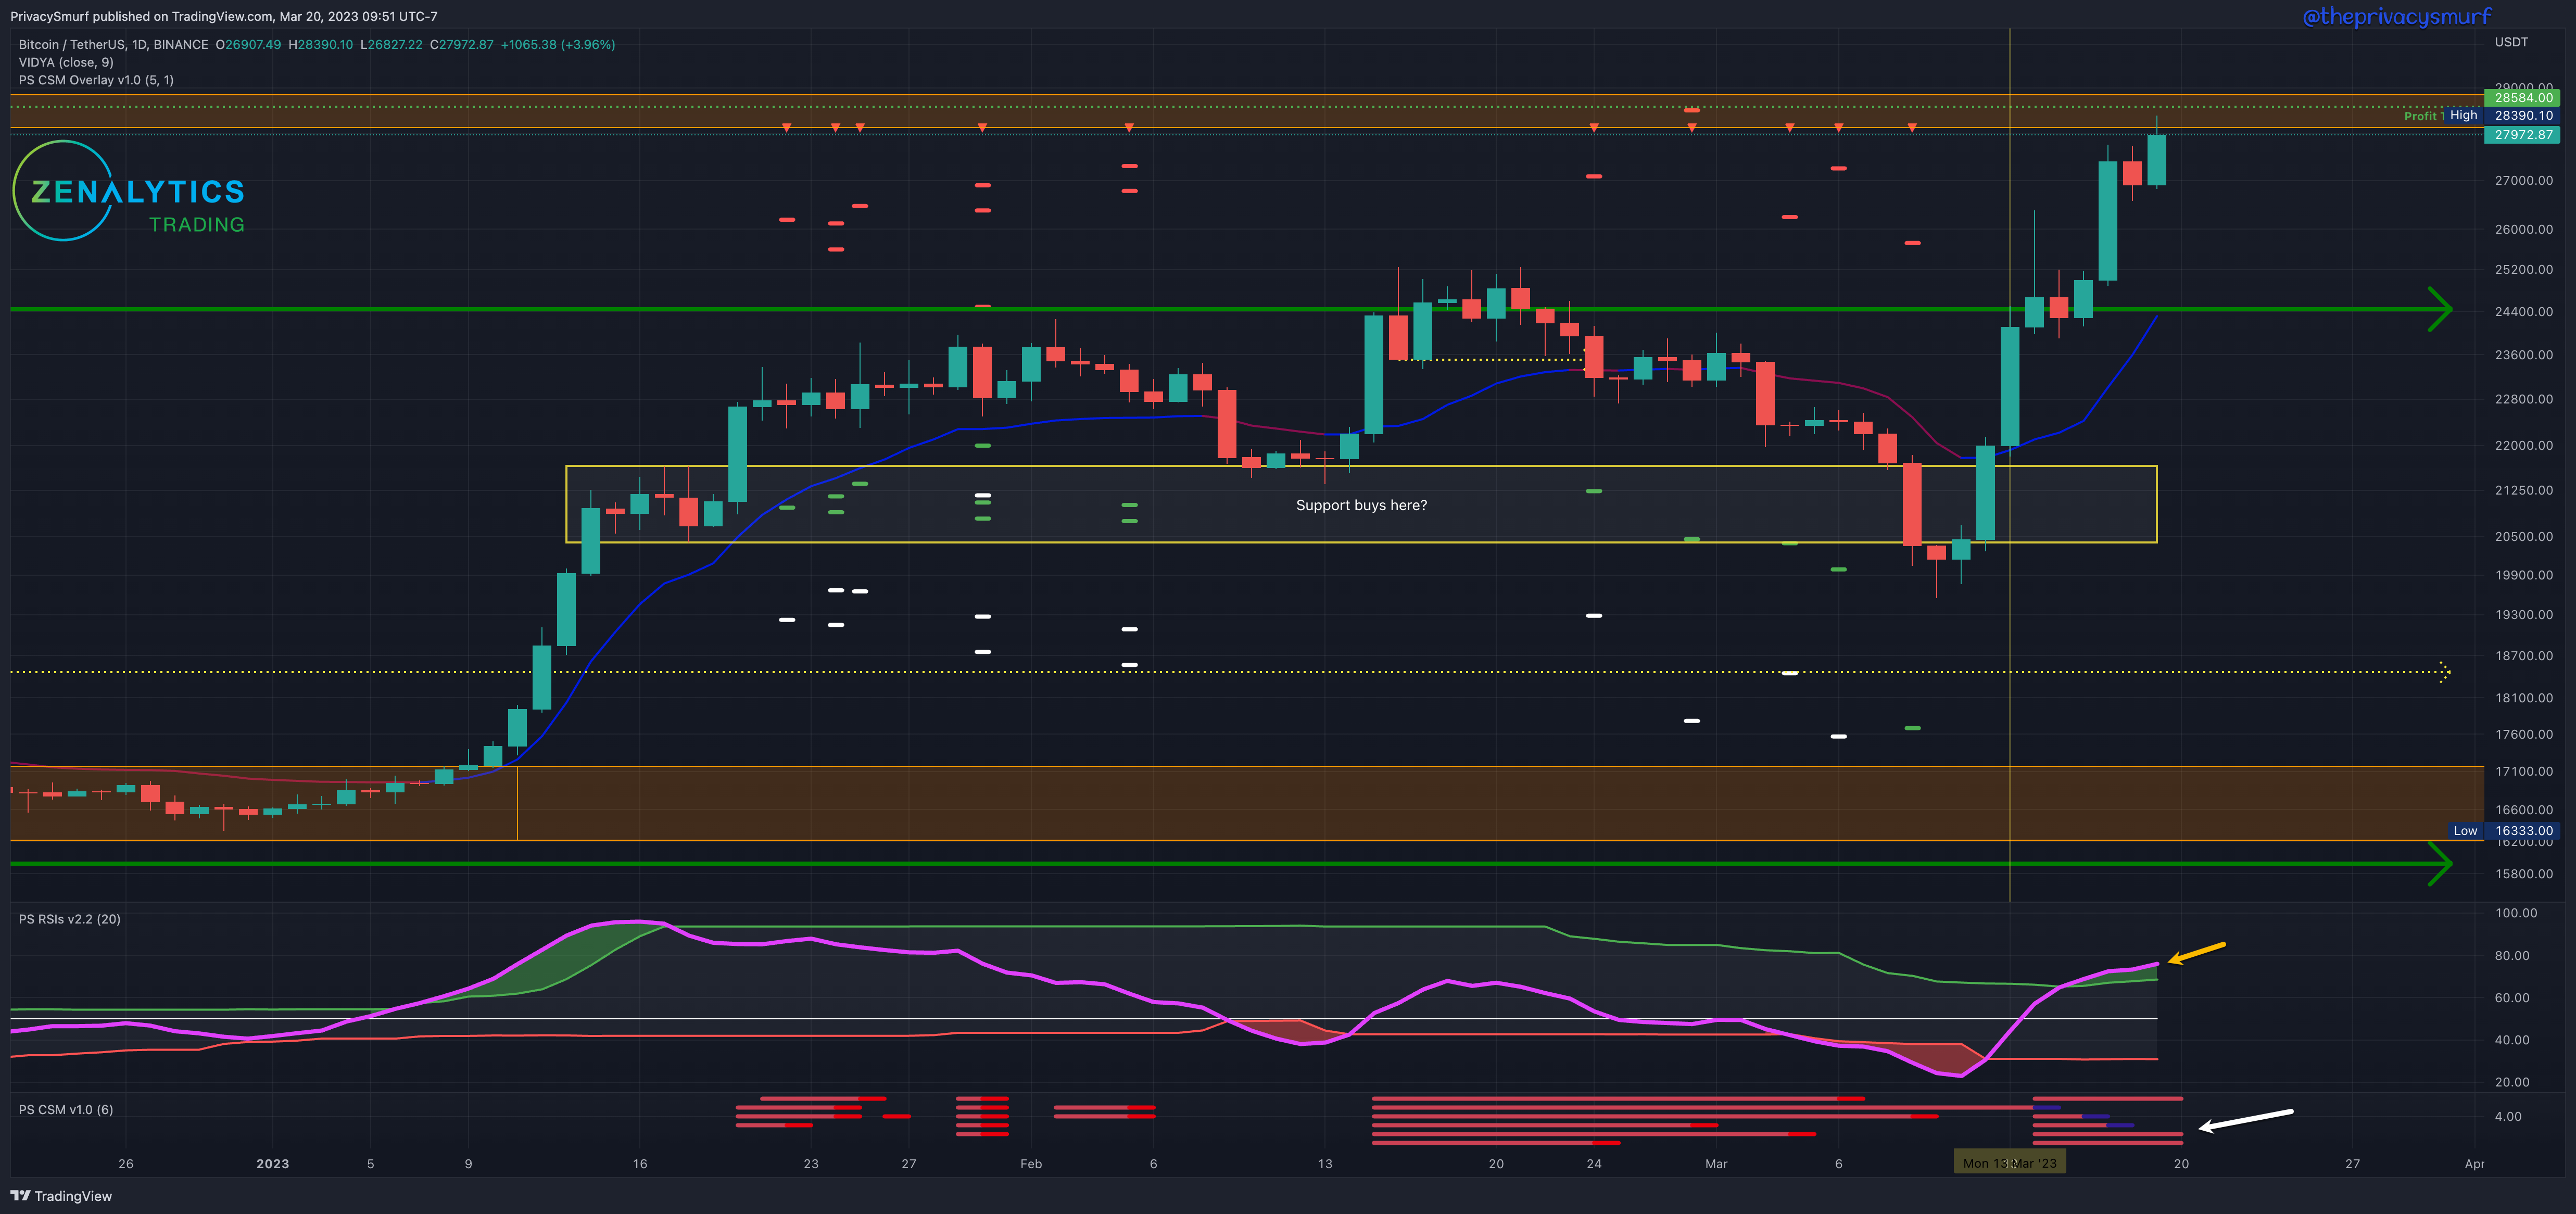
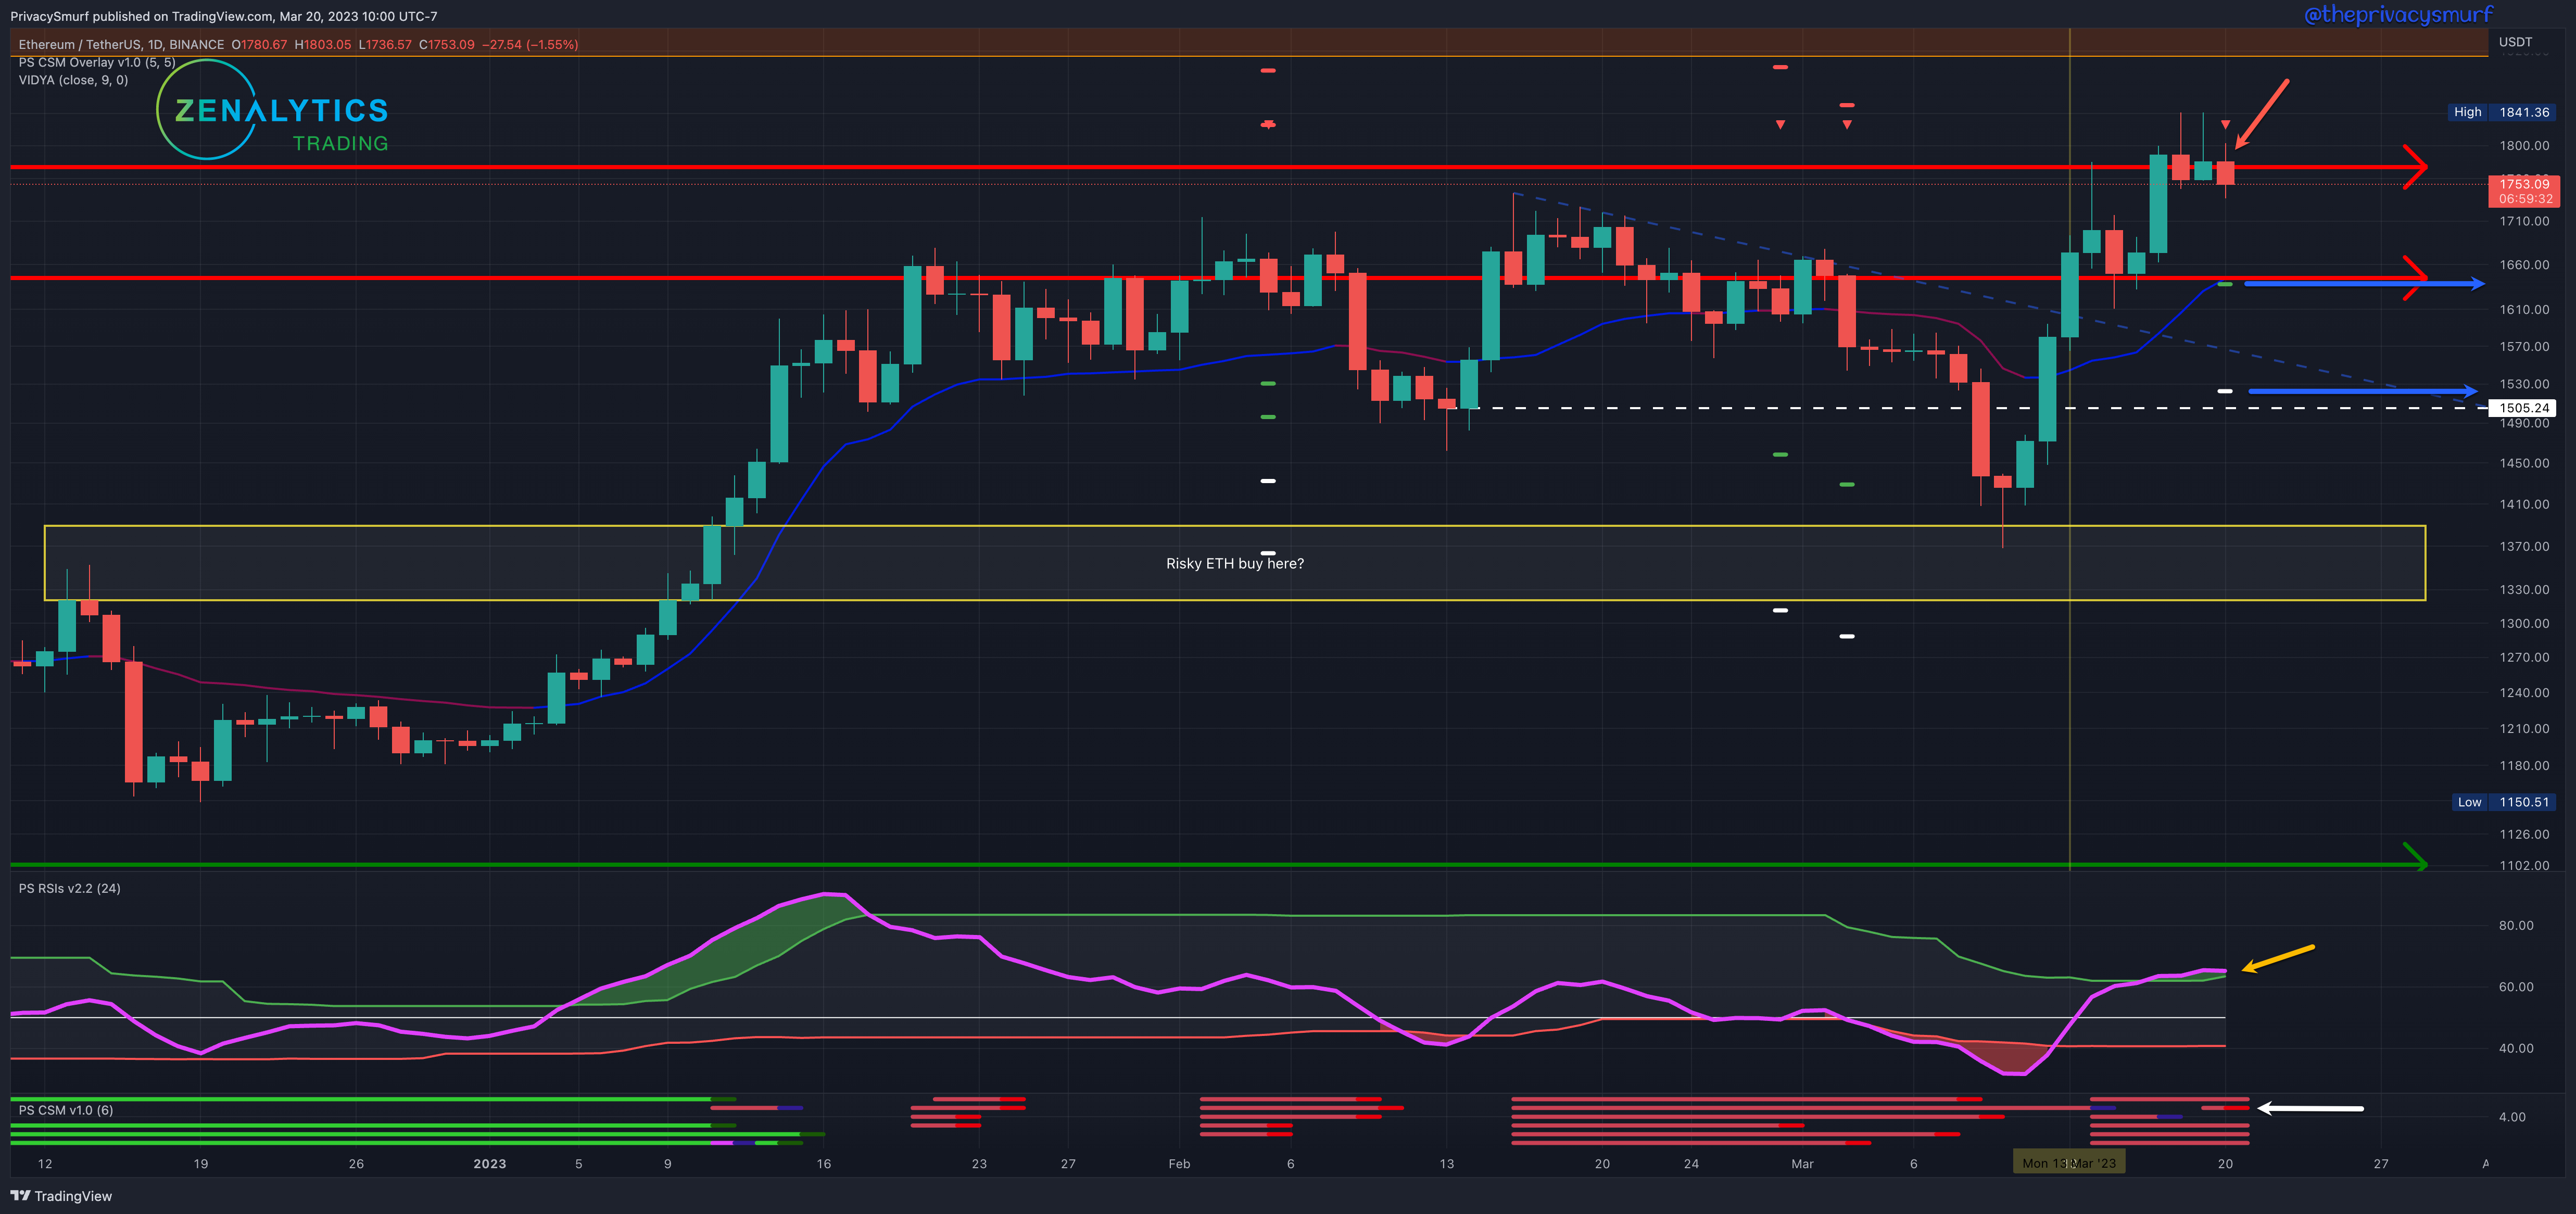
ETH/USDT Daily Chart
https://www.tradingview.com/chart/xbB6lkZu/
From last week:
“… RSI is also making its way toward the midline and top band. Breaking above those would suggest the potential for even greater bullish impulsivity than we have seen... If the 20-minute and 2hr charts are showing invalidation of the bearish divergences at those levels I'd take the long play for the breakout…”
Similar to BTC the invalidations of bearish divergences started popping up on Tuesday along with the RSI breaking above the adaptive top band, multiple confluences suggesting the potential for bullish continuation instead of the failure of the overall bullish move. The follow-on price action was stifled though at the next higher resistance and didn't get the same type of bullishness BTC experienced.
Looking at the live chart today including the unclosed Monday candle, the Correction Strength Meter (white arrow) is plotting an unconfirmed bearish reversal trade signal despite the new highs. The initial target looks to be coming in somewhere near the prior resistance that now may be a support at $1640 (blue arrows).
Given the week's current technicals, it will be important to monitor the RSI. If it curls back into the bands that would suggest that the resistance is our local range high and the bearish targets are very much in play. Staying above the top band and I would expect more bullish price action to tease another bullish breakout.
My bias is still bullish as I'm long from the breakout from the lower ranges as suggested last week, but if I weren't in a long position I wouldn't be opening a new position here until higher as we are still under untested resistance. As we are in pretty much the same setup here are my two considerations for entry if I were not in the market.
The 2hr chart is already signaling failure from the resistance but it's pretty risky in the face of all of this bullish price action. If the structure around $1730 fails that's a better place to entertain a short with the stop above $1800.
If the 20-minute and 2hr charts are showing invalidation of the bearish divergences at $1820 I'd take the long play for the breakout.