

Sunday Synopsis #1
Sunday Synopsis #1
The best day to start working towards a better understanding is today.

Here we are. Day 1. Thanks so much for joining me in this new venture.
The Sunday Synopsis will be a weekly look and update to the big picture for Bitcoin and the market as a whole. This is a beneficial process for both traders and investors. Investors with a full picture and occasional finger on the pulse of the market can identify when conditions are forecasted to or are beginning to shift. This insight can keep you in your profitable positions longer and also prevent leaving money on the table through drawdown. Traders with a full picture can identify higher probability trade setups. They can also better choose methodologies to employ as not all strategies work well in all types of market conditions.
This newsletter subset will be posted on Sunday evenings (US Pacific/ UTC-7). Free subscribers will receive the Sunday Synopsis like this one on the 1st and 3rd Sunday each month and paid subscribers will be updated each week. The 1st Sunday of the month and the 1st Sunday of the quarter will have a bit of a deeper look than the regular weekly posts. If all that sounds advantageous to you consider the paid subscription.
A signal through the noise:
Unless you’ve had your head in the sand you are aware of Bitcoin’s recent descent of over 50%. In my trading and investing I strive to disassociate myself from the news and psychological need for finding out why things happened. Ultimately the reasons to be found can be a great many things or none of them. More often than not those true conditions can’t be identified until it’s too late to do anything about it. That’s of no benefit to my portfolio so I dismiss it. Regardless of what you believe the cause was for this decline in price it all was forecasted through various means of technical analysis. Through this newsletter, you will become more familiar with the methods I study and apply. Hopefully, they will stick with you and help you in your financial pursuits as well. Very little of what I do is beyond stock indicators on Tradingview and the parts that aren’t I’ll be covering them on Topical Thursdays as time goes on. You really don’t need fancy indicators and signals to be profitable in the markets.
Here we go…
For all those HODLers and investors out there BTC on the weekly chart remains in a bullish trend based on market structure despite all the recent bleeding. Taking out some profits on BTC positions in the green to create some sideline cash for dip-buying wouldn’t be a consideration for me until a weekly chart lower low close below 32271.
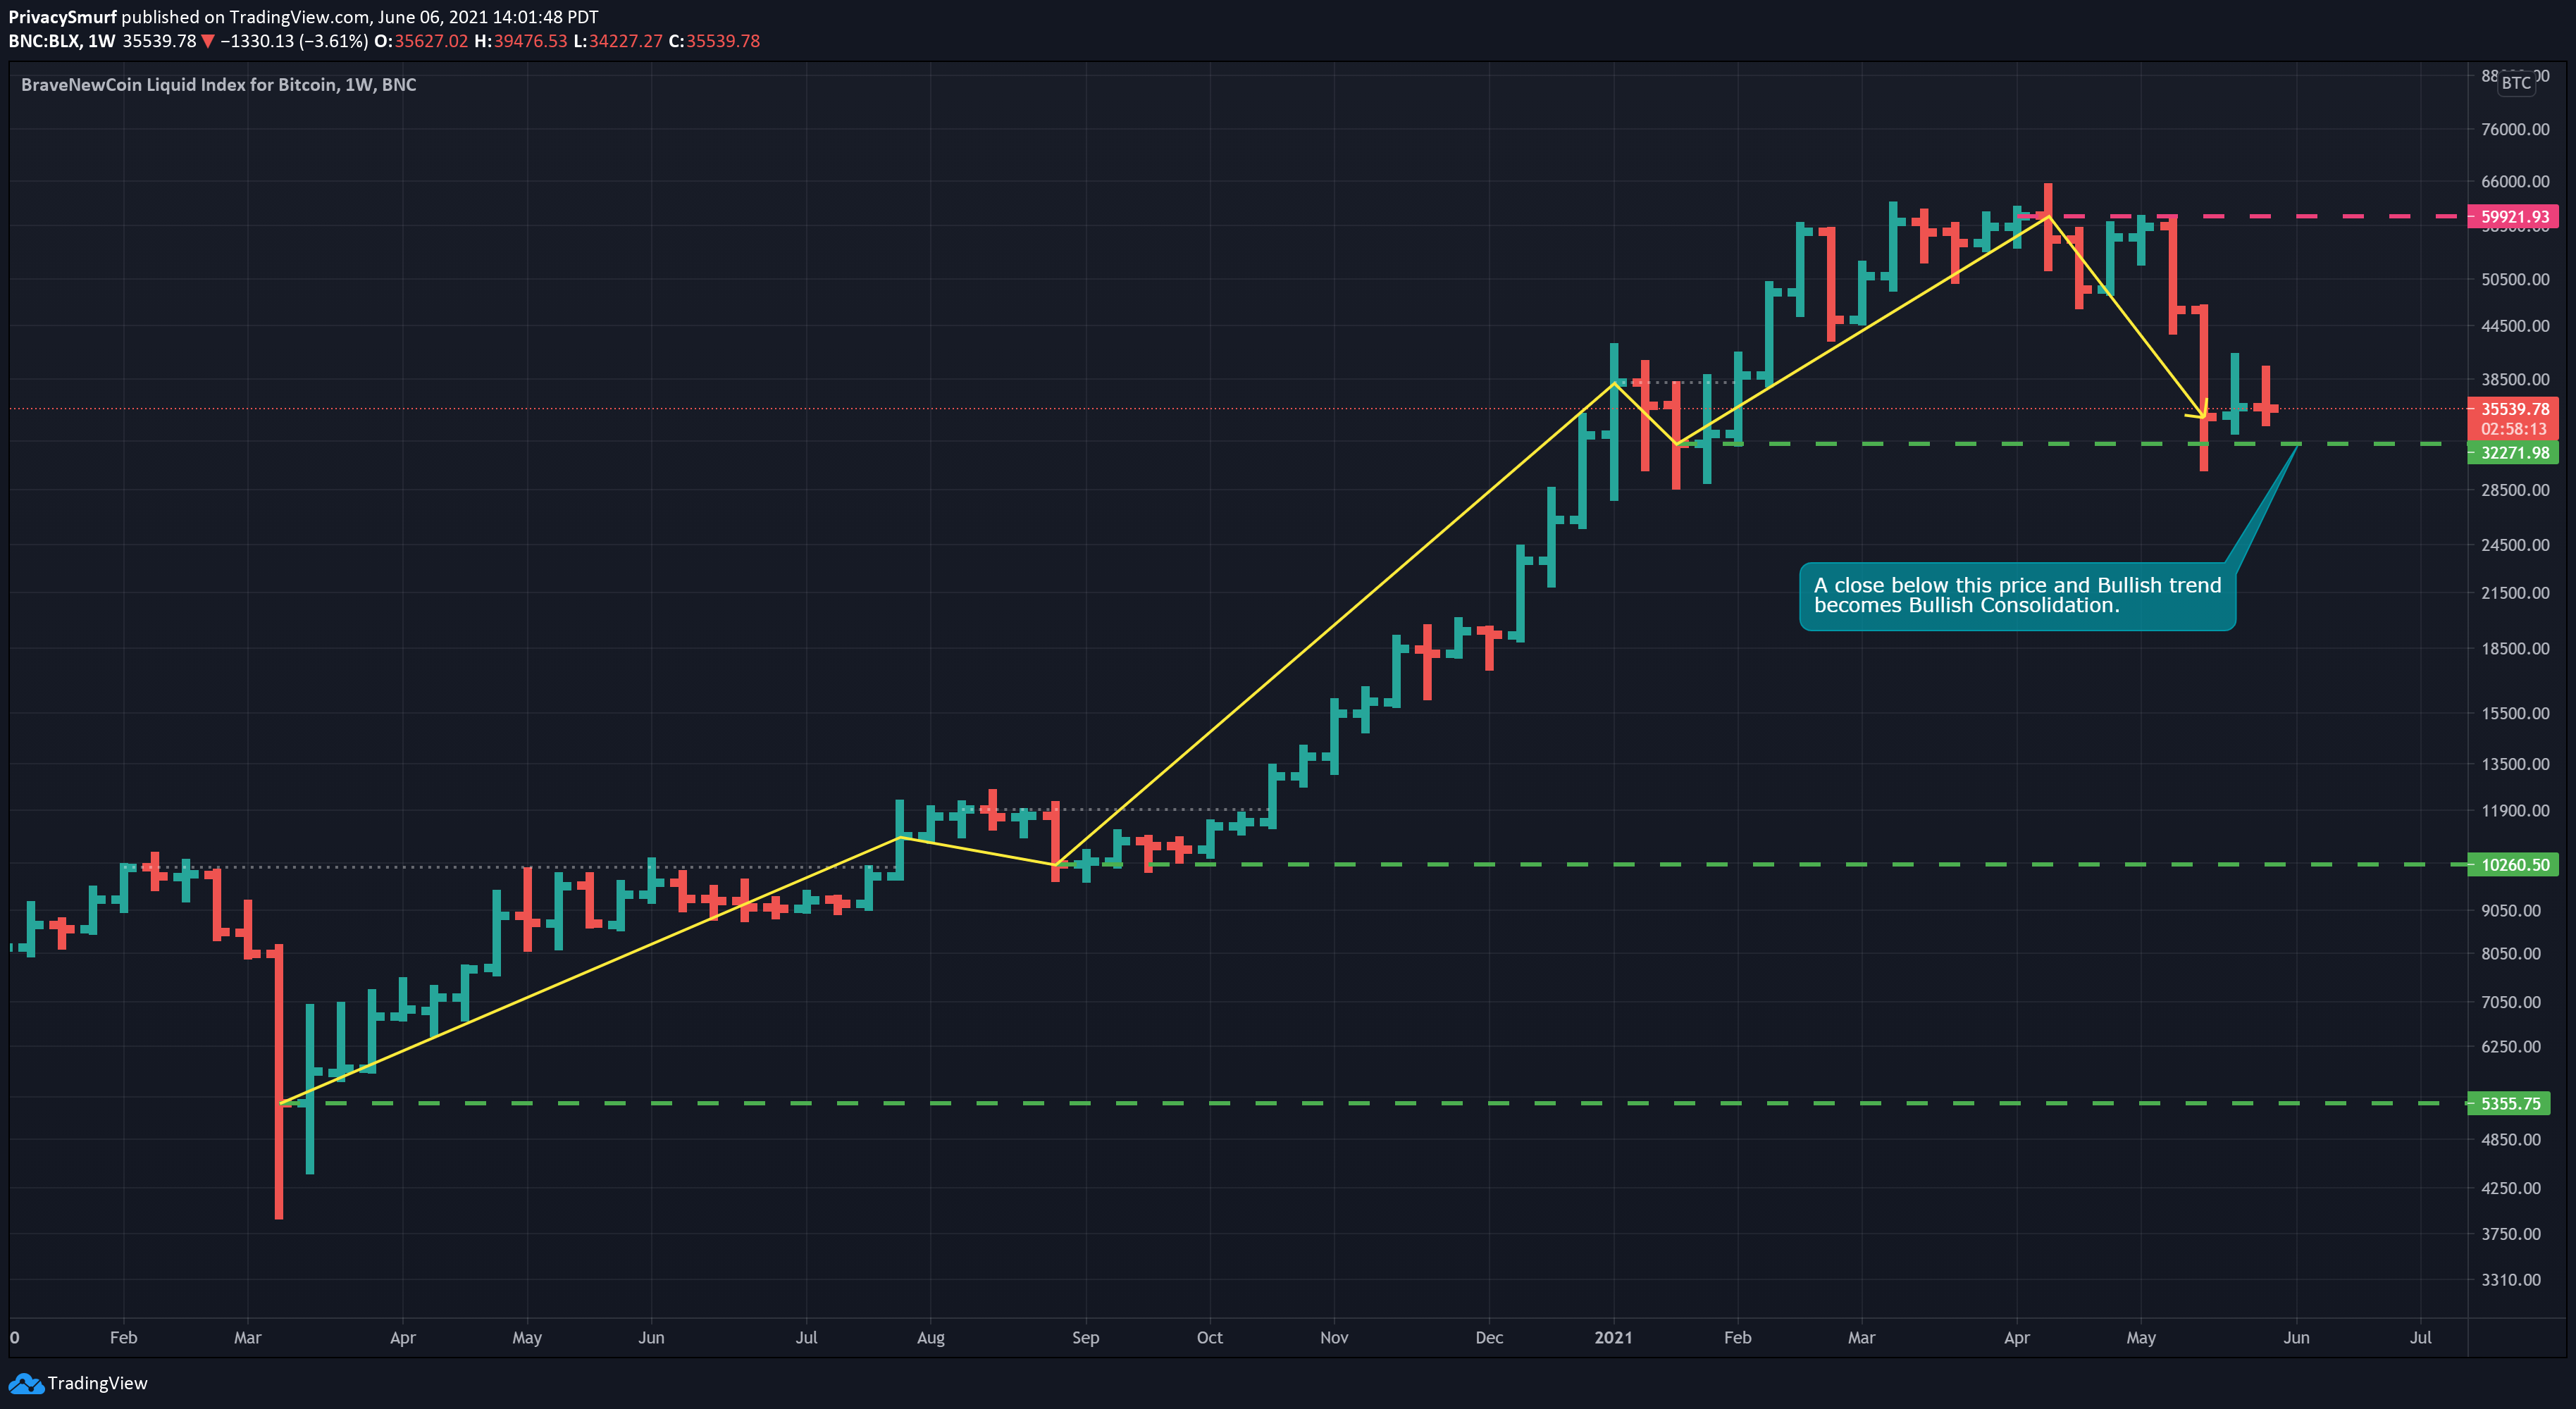
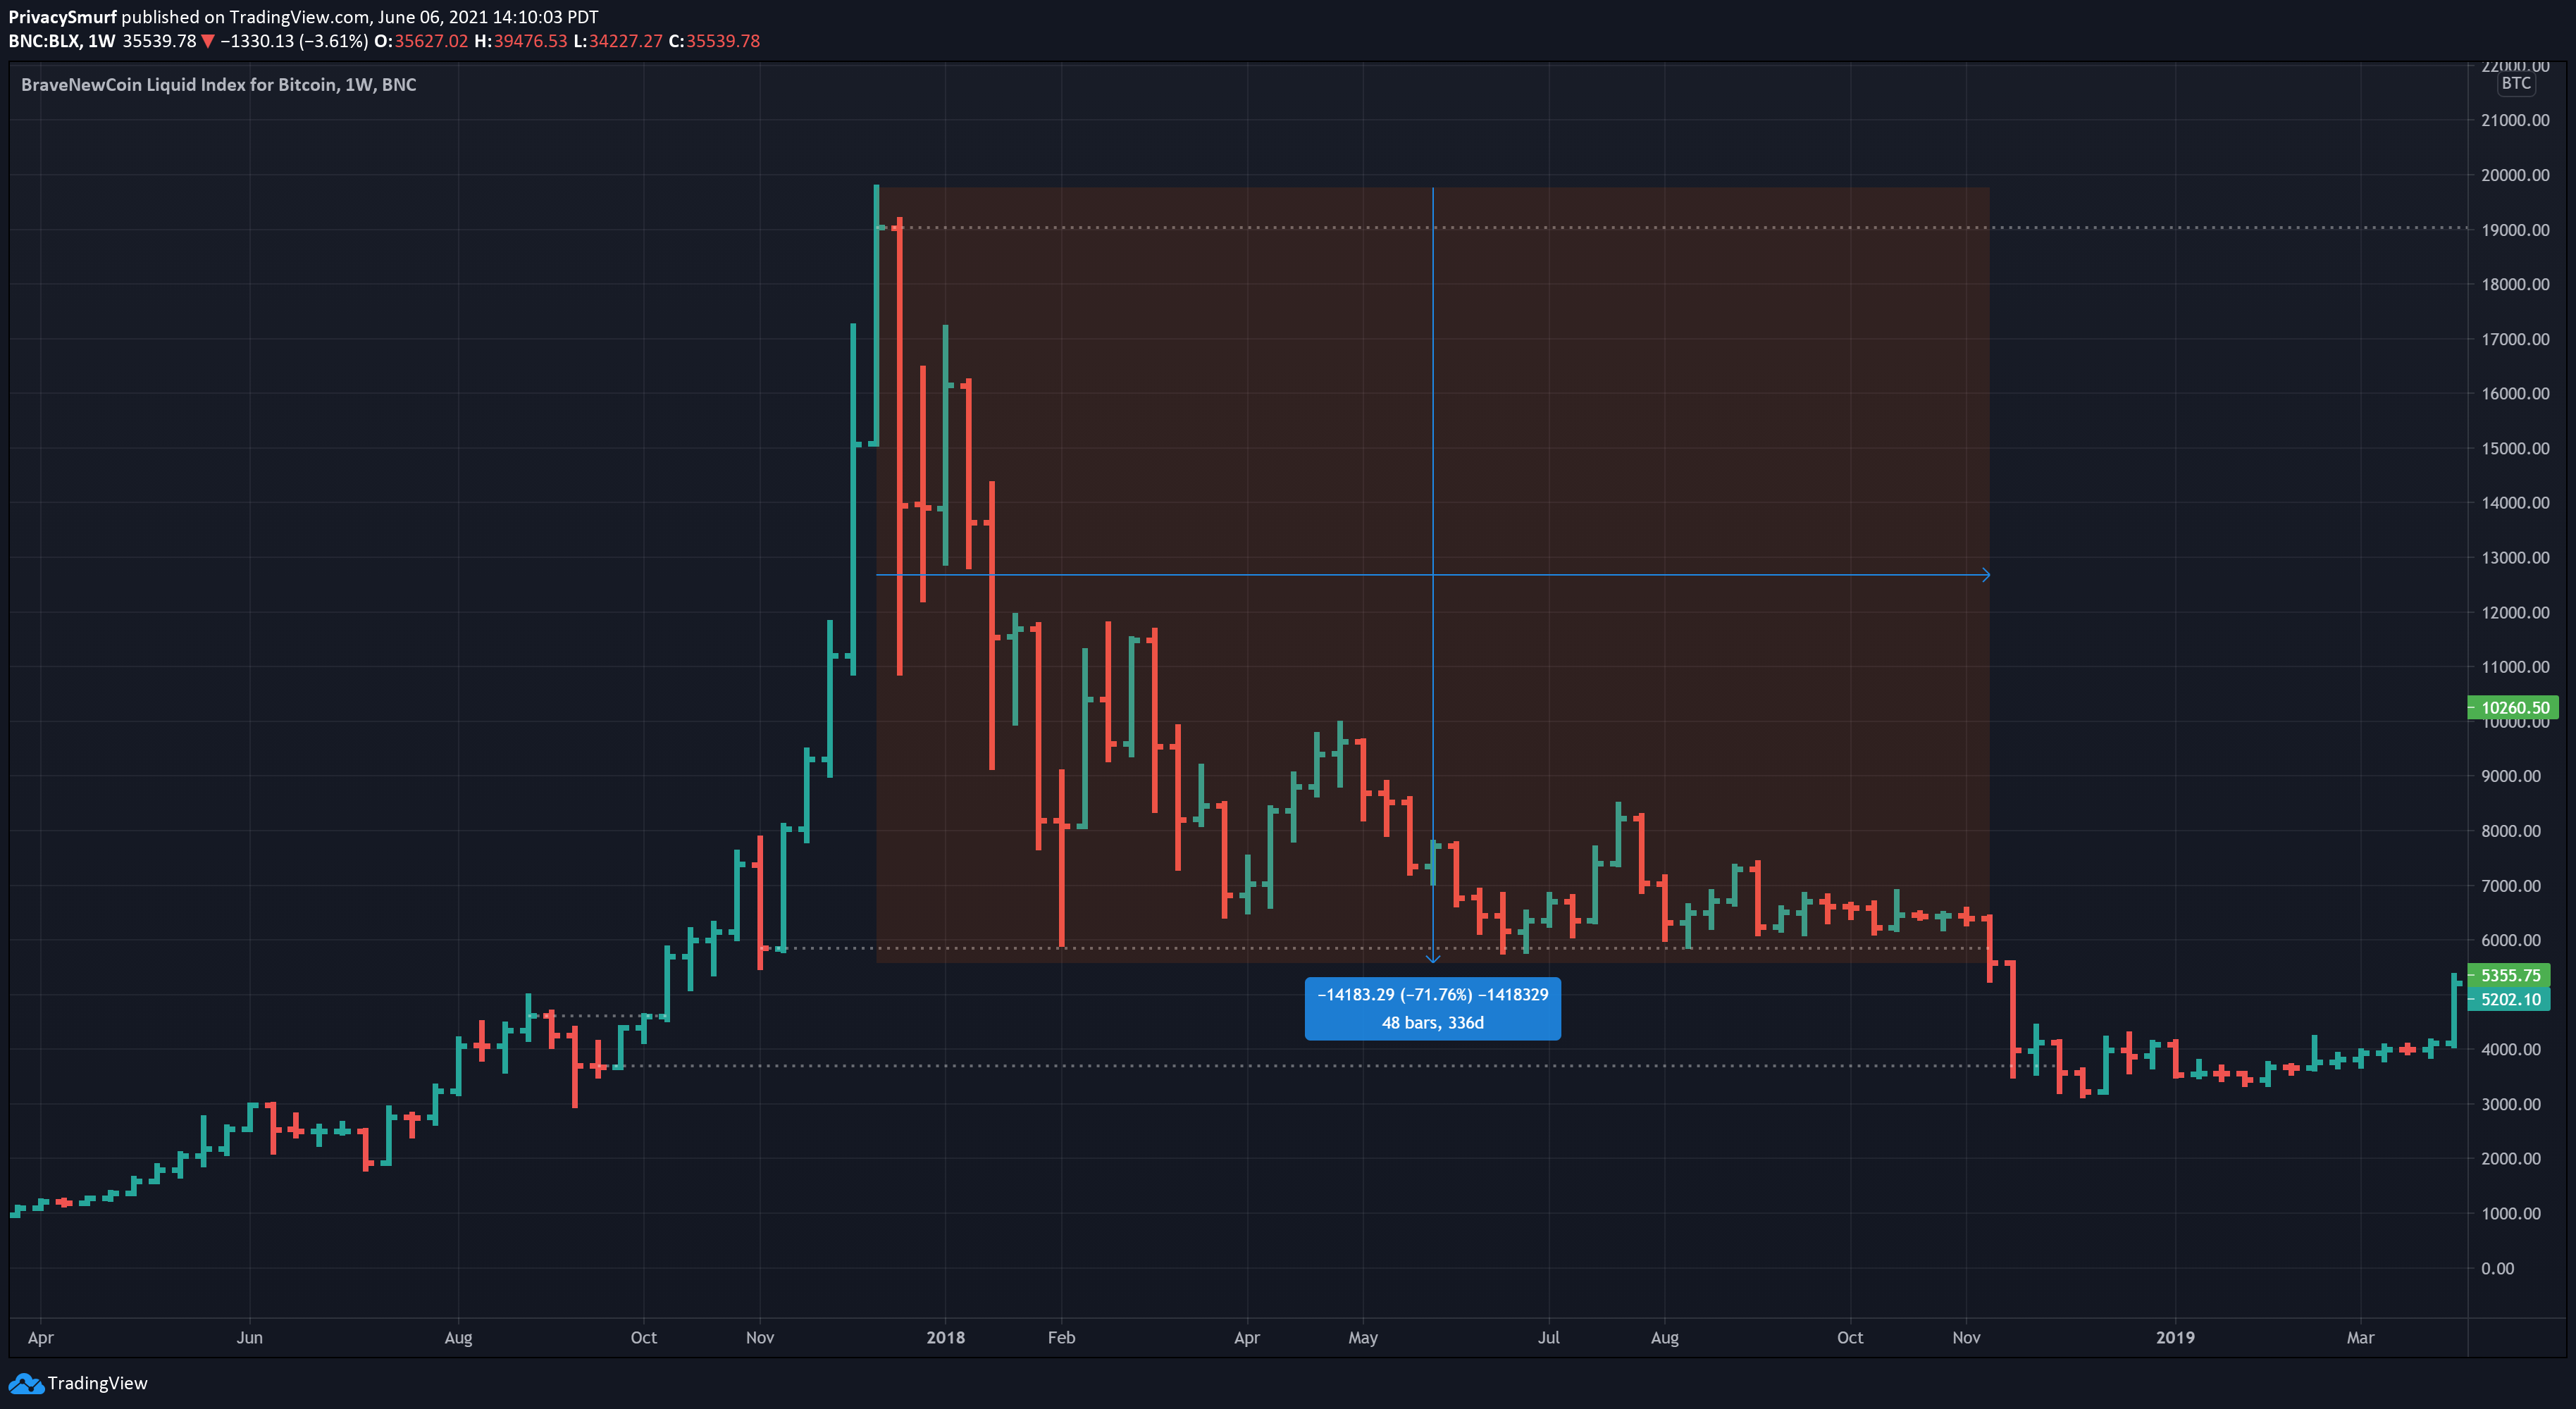
For the sake of comparison, the runup to the peak in 2017 due to FOMO (fear of missing out) retail buying took almost a year to break market structure to the downside while we currently have returned to the weekly structure support in under two months. While the current correction is near a market structure trend shift it isn’t presenting similarly to a long-term bearish picture after a blown-off top like in 2017 shown below.
Post-halving in 2016 there were multiple retracements to the existing market structure supports prior to the peak.
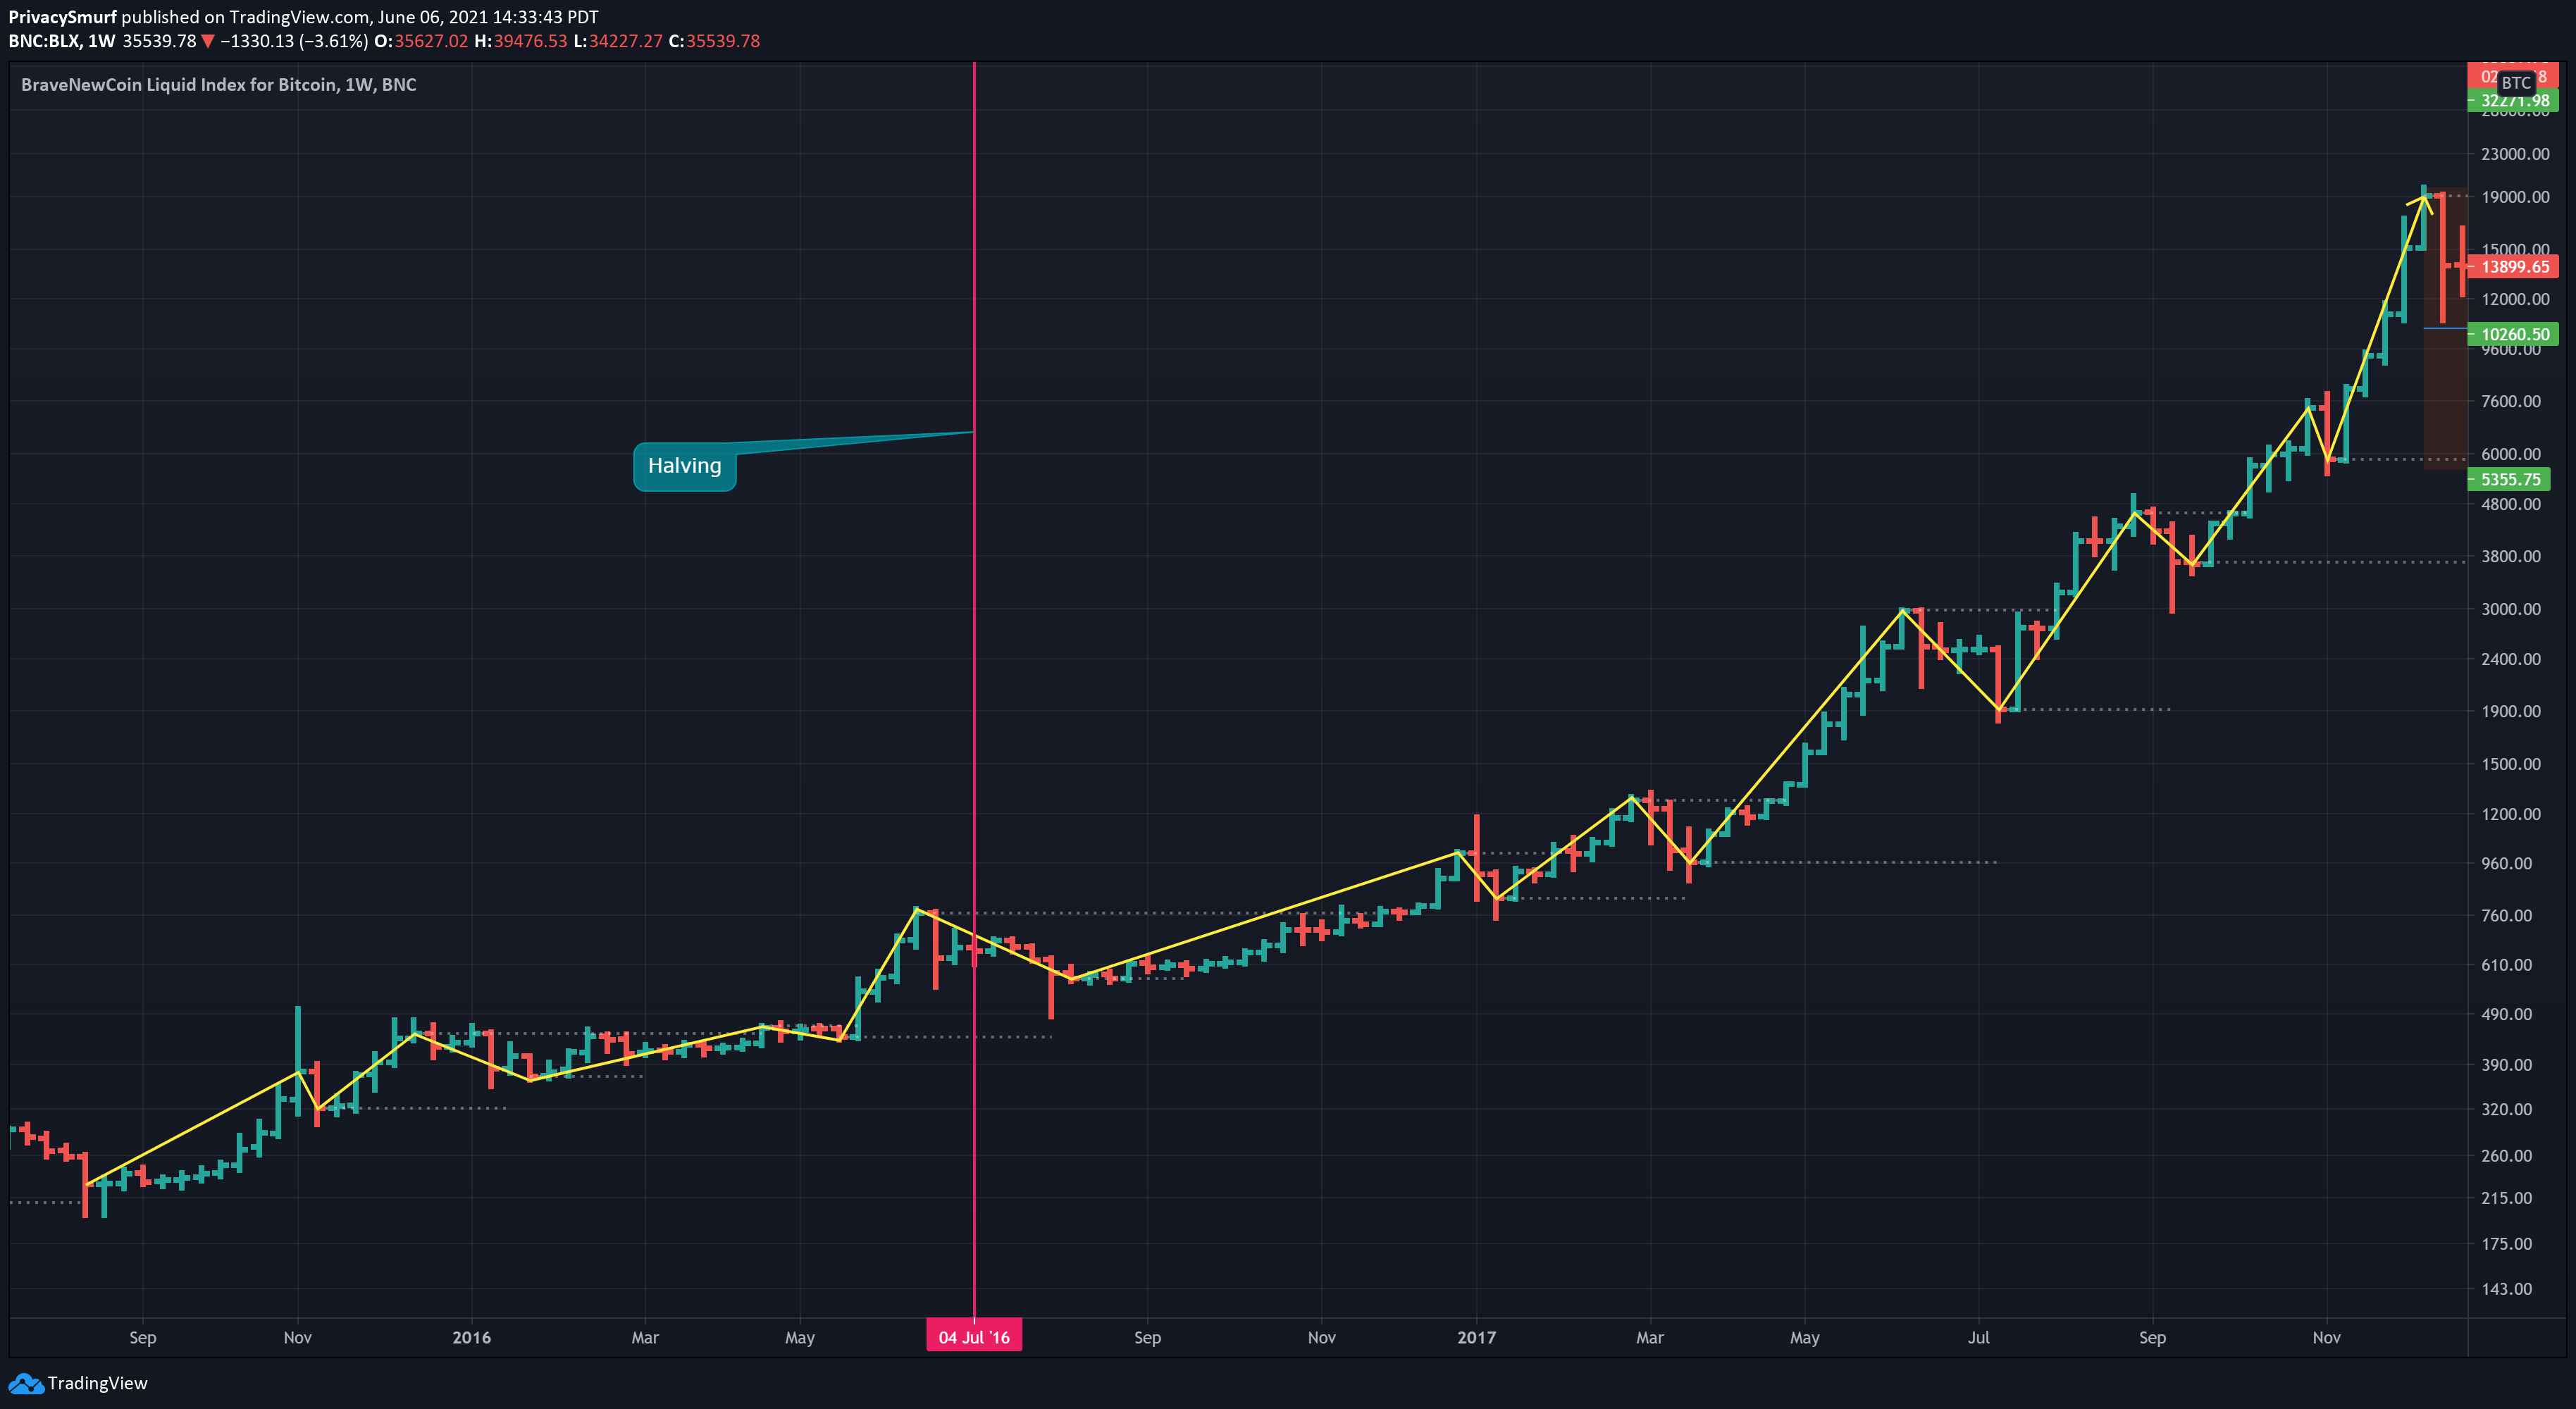
The timing of the current retracement and existing market structure is not all that dissimilar from the 2016 post-having runup.
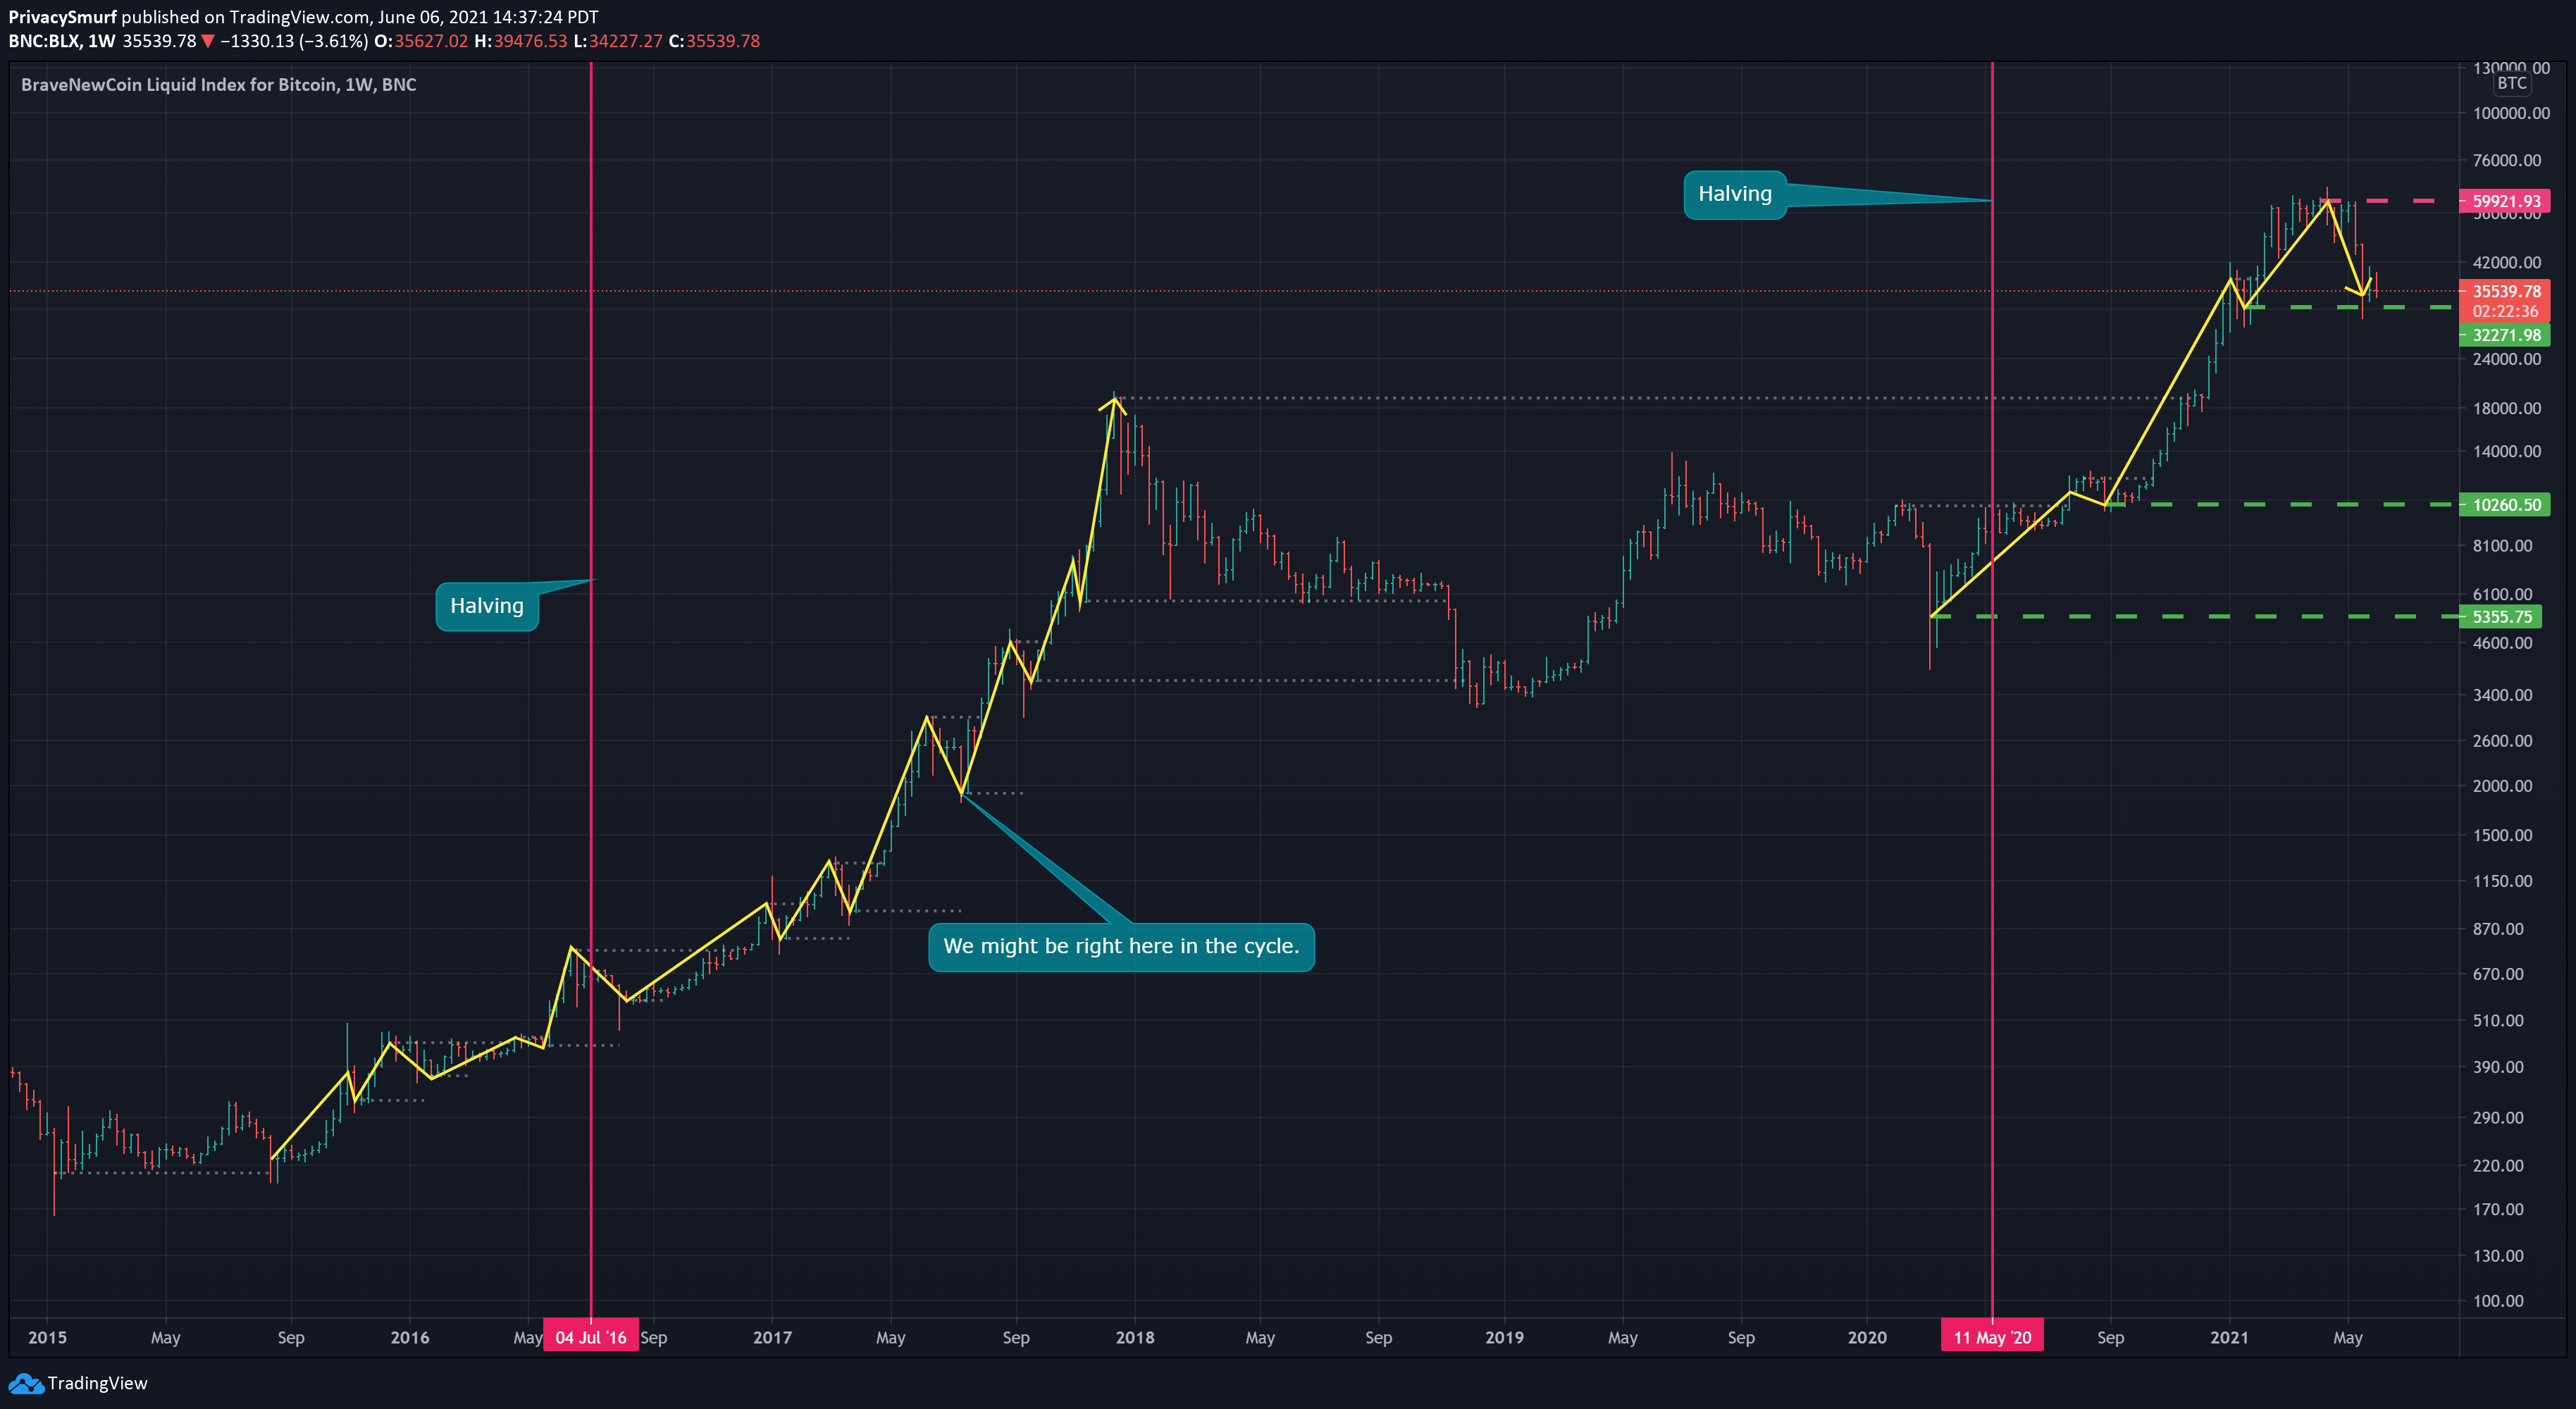
Takeaway: A close eye will need to be kept on weekly closing prices as they can signal further bearishness or at the least price stagnation and consolidation on a close below 32.7k.
Price patterns are often repetitive on many assets. BTC is one such asset with commonly repeating cycles. Here is a chart depicting the current cycle in play on the BTC weekly timeframe. The black line is the weekly closing price. The wavy line is the model forecast.
The current dominant weekly cycle is 42 Weeks, 21 weeks of bullish price action, and 21 weeks of bearish price action depicting a cycle bottom around August 9th. This price cycle taken without any additional TA, buying at the exact cycle low and selling at the exact cycle high has been profitable 66% of the time. All models are erroneous as they are projections of past price action applied to the future so blindly buying the cycle tops and bottoms is ill-advised. Better applications are to use projected dates to start looking for technical signals that validate cycle peaks and troughs to increase probabilities of profitable investments and trades.
The weekly cycle bottom on Oct 19, 2020, coincided with a break of a market structure resistance confirming a bullish trend shown with a green up arrow below. A long swing trade could be entered at the week’s close. The cycle peak on March 15, 2020, when given a technical filter using the RSI proves to be a very profitable exit. The RSI was showing bearish divergence as early as mid-February. Bearish divergence shows that buying pressure is decreasing although the price is increasing. More often than not this is an indication of a pending price correction to the downside. A common exit condition using the RSI is exiting when the measurement crosses below the 70-line, the red up arrows below. Exiting at the first signal would have netted a 246% gain on the position. Waiting for alignment of the cycle peak AND an exit condition signal on the RSI the position would have a 331% gain and minimal profits left on the table.

The caveat with cycle analysis is that in general, most assets go up in the long run. Timing and trades are always better to the long side when considering long-term positions. Price won’t always go down when on a cycle downtrend. Consolidation and ranging prices are just as valid as prices going down when analyzing cycles.
Takeaway: BTC is currently forecasted to be in a weekly cyclical downtrend. Prices may continue ranging and consolidating through early August. Watching for breaches of market structure resistance (unfortunately at ~60K) OR looking for bullish divergences on price action oscillators (Momentum, CCI, DPO, MACD, RSI) could provide for solid technical long term entries when coinciding with the August cyclical bottom.
Dropping down to the daily chart for the traders BTC has been in an established bearish trend since May 15 with closing prices in a range between 40.6k and 34.6k.

In that range ascending and descending trend lines anchored to highs and lows show psychological regions of support and resistance. June 12th is the date of convergence of the two angular trendlines. As that date draws nearer odds of erratic price action increases. Operating with caution would be wise as there’s already been one fakeout to the topside as price closed above the trendline resistance but failrd on the test of it as support.
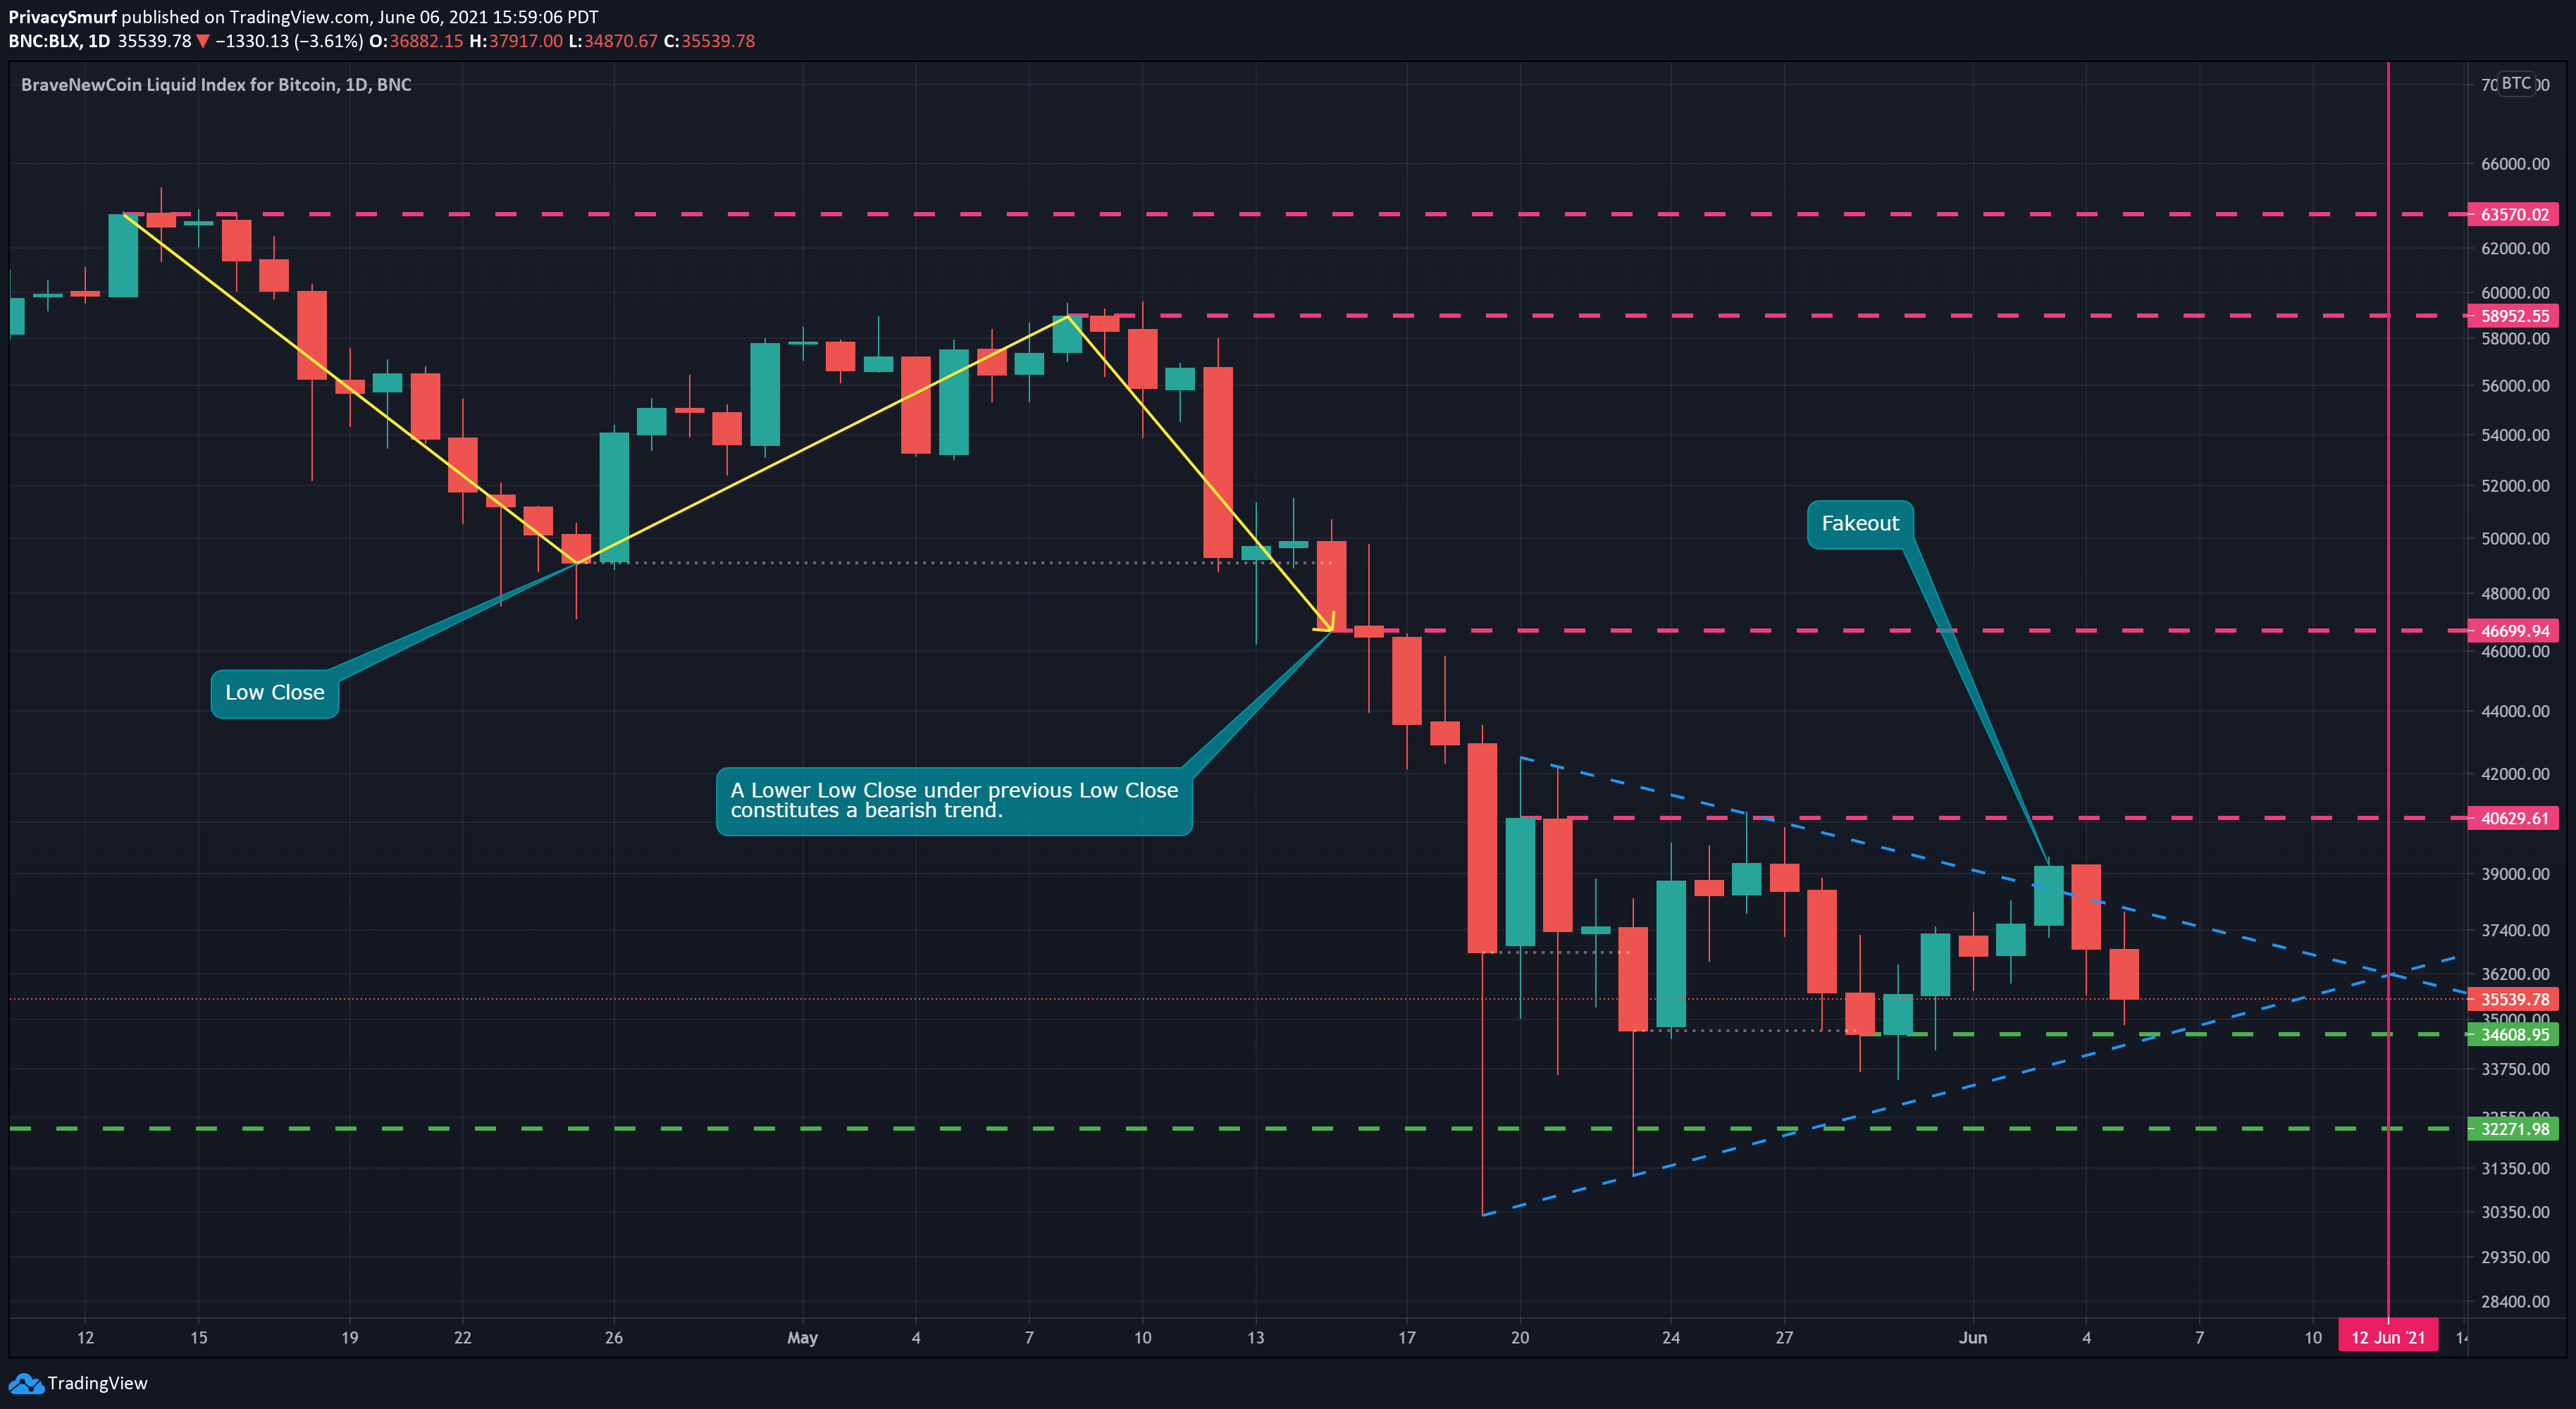
The dominant daily price cycle of BTC is currently 40 days, 20 bullish and 20 bearish. It’s the most repetitive daily cycle for BTC. Depicted below the model is forecasting the departure from the cycle bottom. This coincides with successive higher low closes shown on the chart above. Buyers are trying to take control of the price.
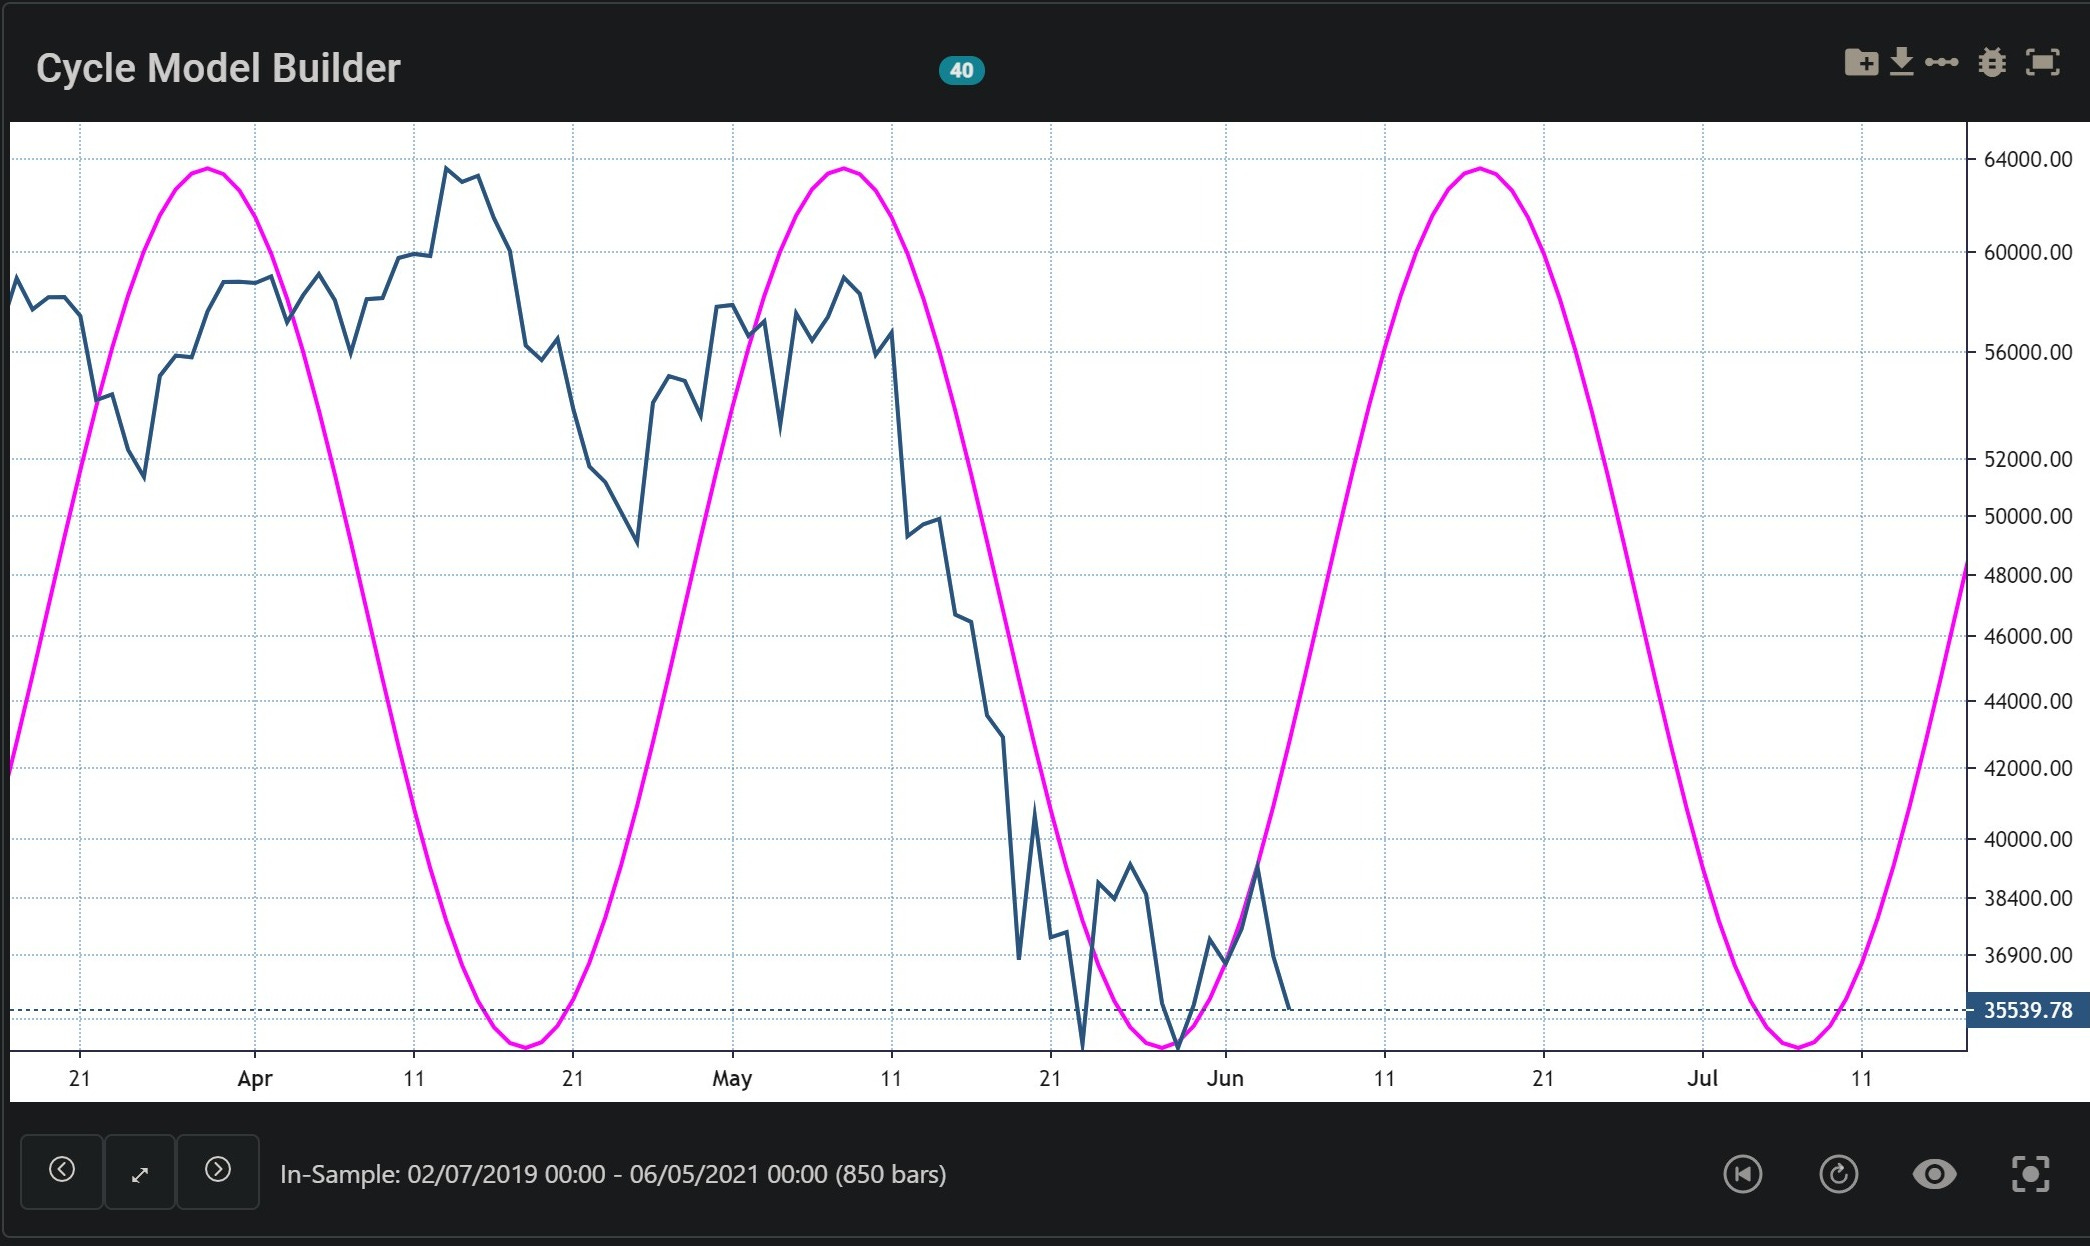
Takeaway: Patience is the strongest option until the market can pick a direction with some sort of forced action to take place sometime before June 12. Waiting for a break of the angular trendline and hold on a retest will define the directionality of near-future price action.
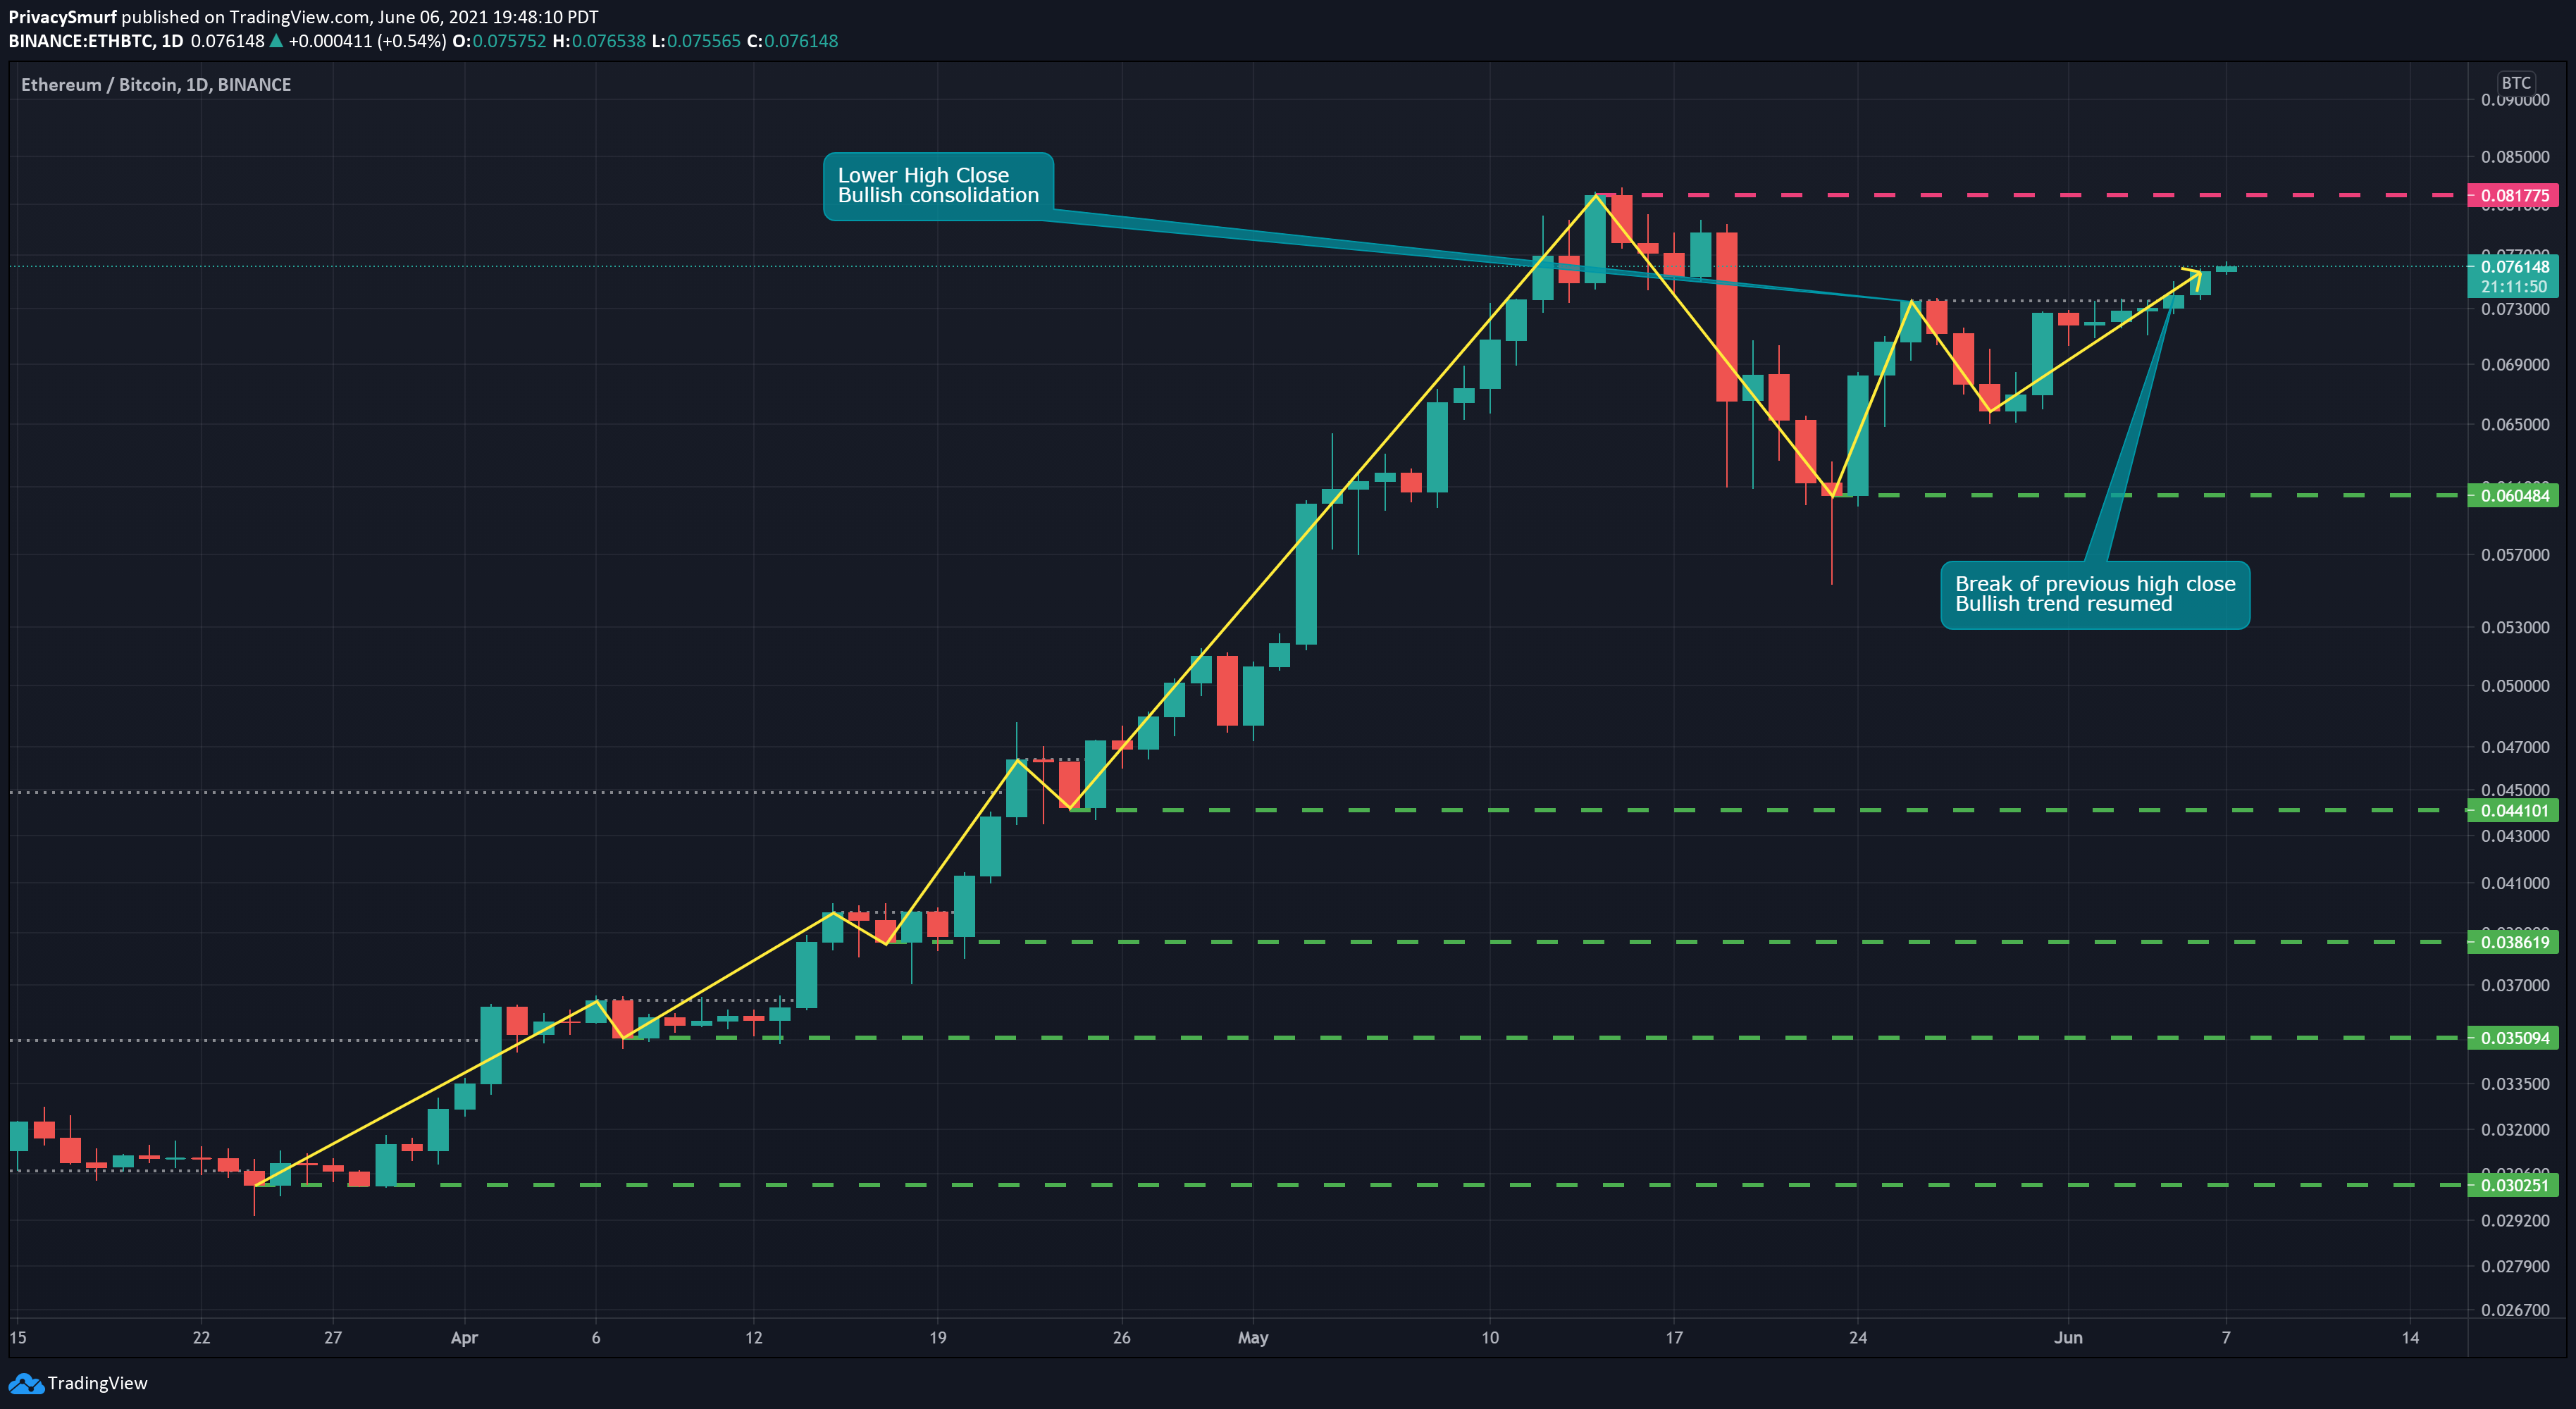
A quick glance at ETH/BTC shows a bullish trend but slight weakness in that trend as it set a lower high close before resuming the bullish trend. The higher close at .081775 will now be acting as resistance as ETH gains in value against BTC.
ETH/USDT is in a similar consolidation setup as BTC/USD except for a bit better-looking picture. There’s less selling pressure on the daily chart. With the value of ETH increasing against BTC as shown above if the two assets remain correlated and both experience breakouts to the upside ETH could have a stronger runup than BTC.
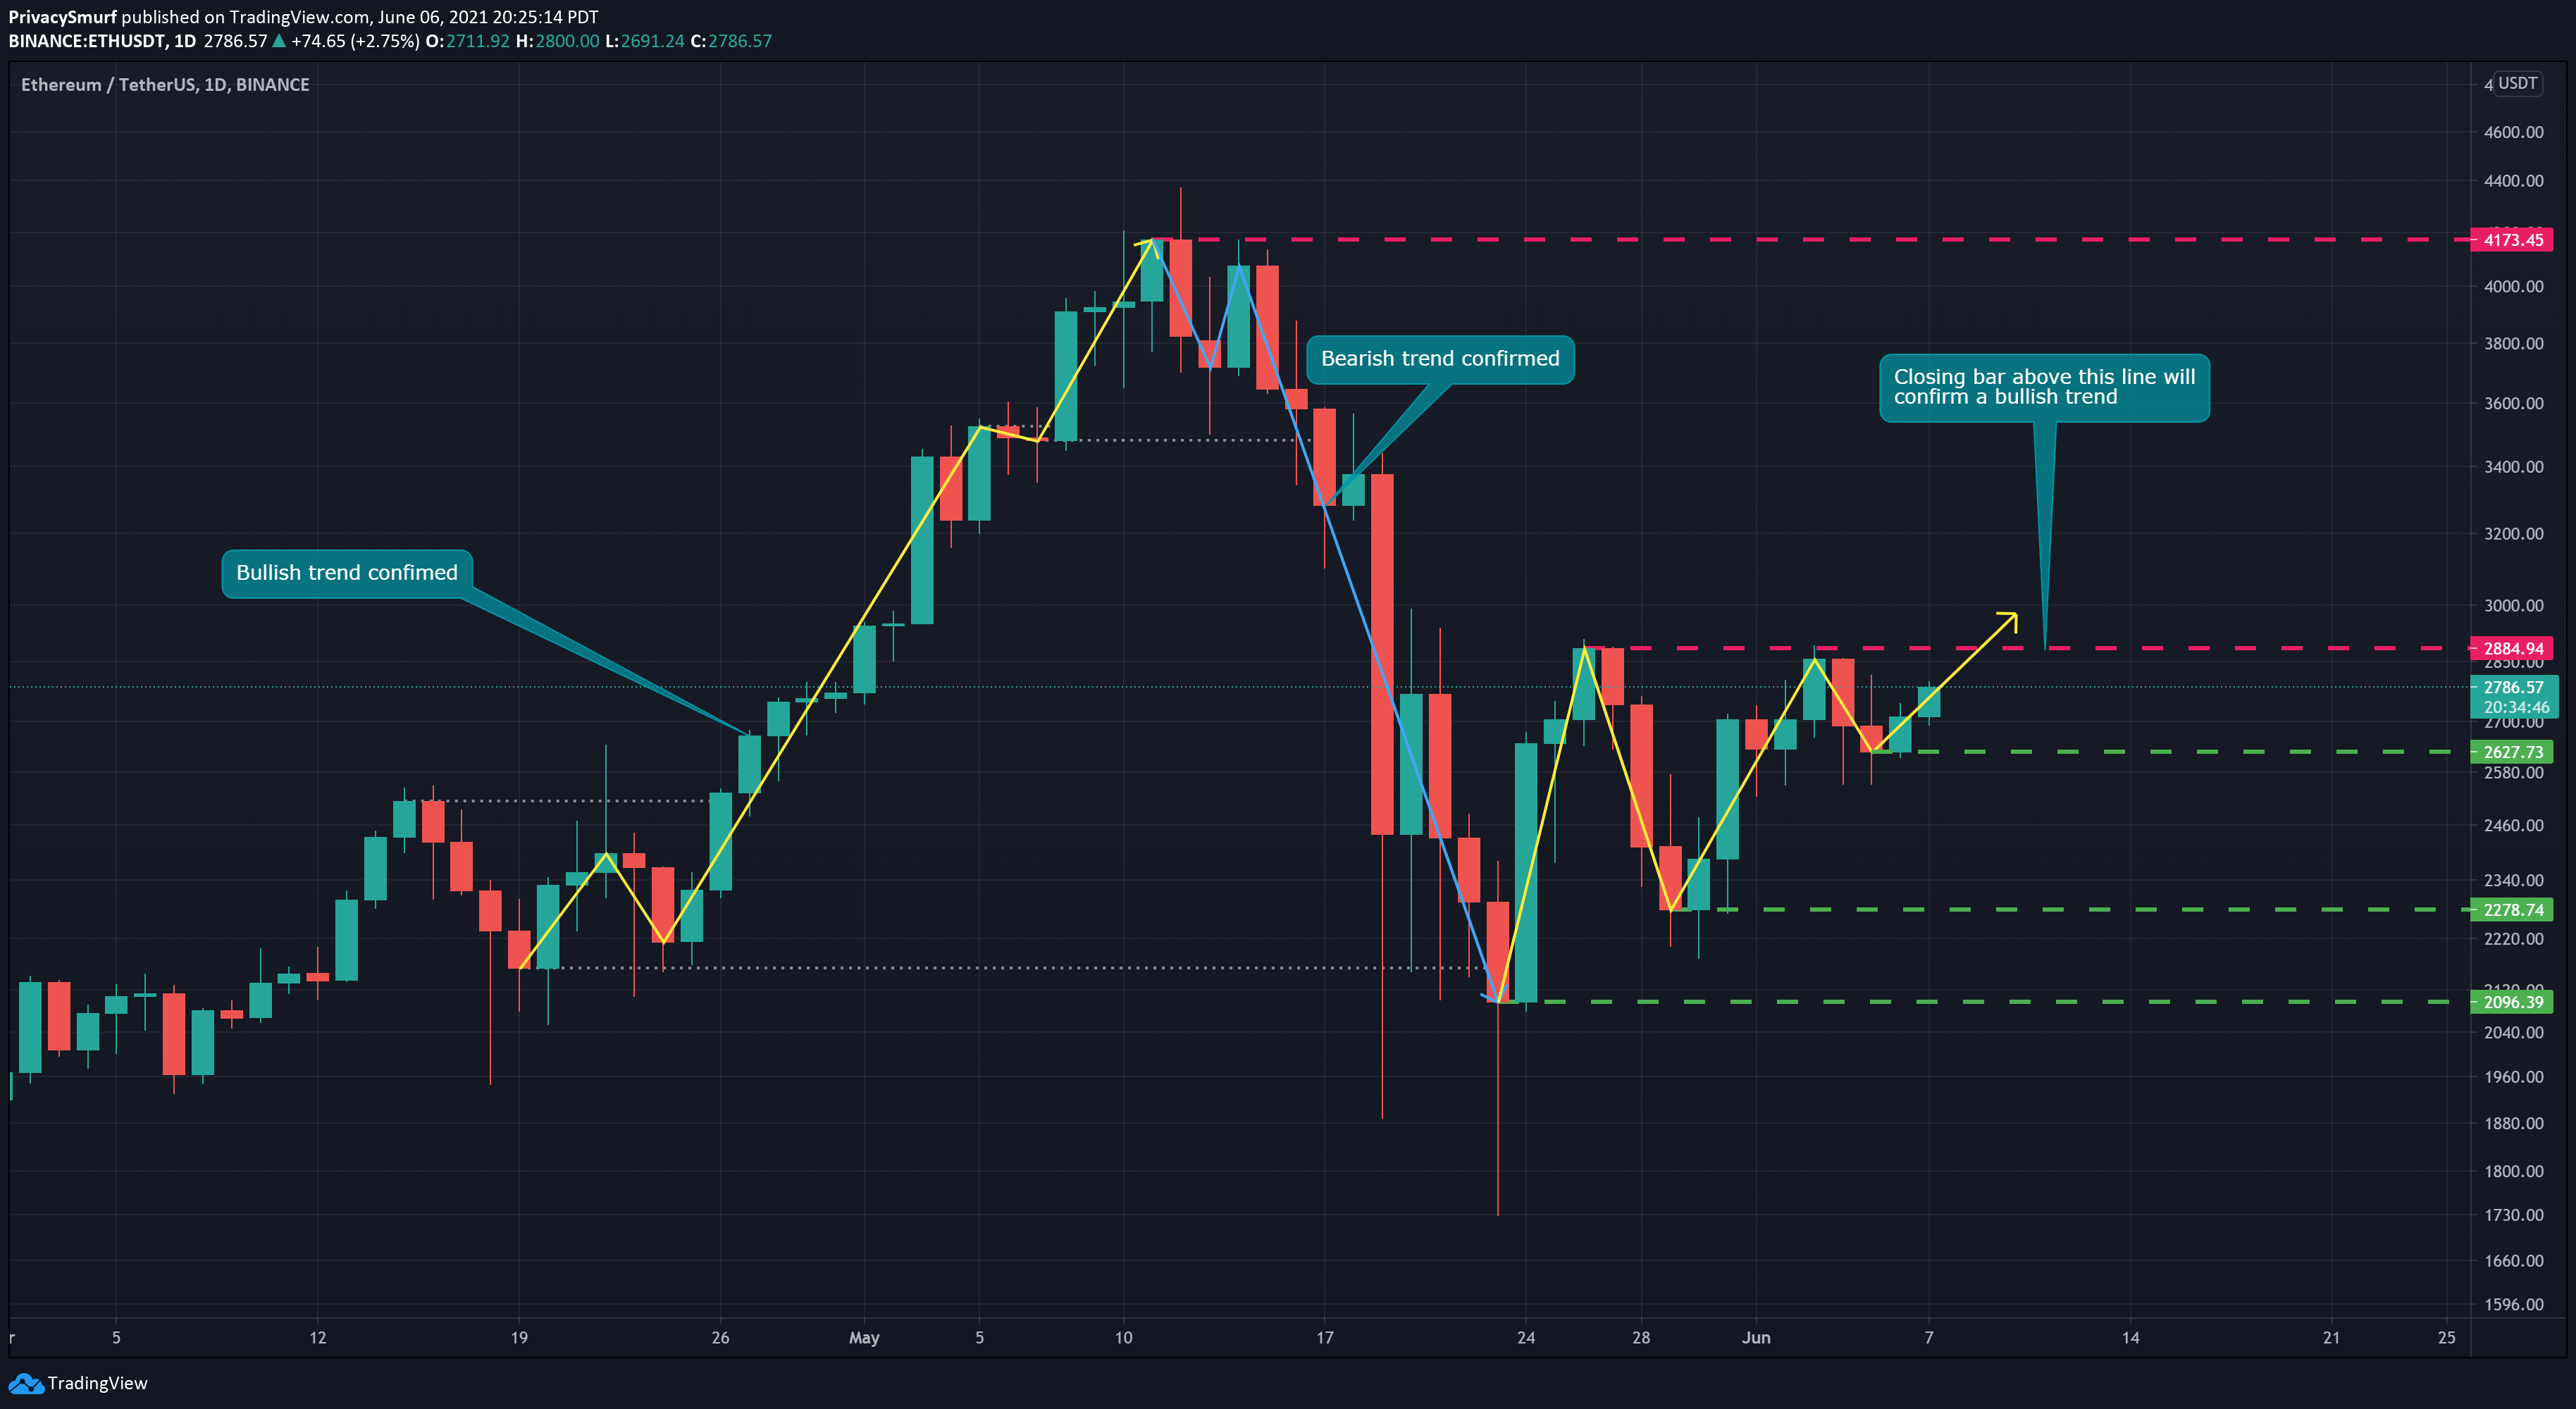
Takeaway: ETH is presently showing more signs of strength against USD than BTC is. ETH is presently showing signs of strength against BTC. In preparation for potential BTC and ETH breakouts from resistance take some time and flip through different ALT/USD daily charts. Find charts with a similar picture to ETH with higher low closes and approaching a resistance. If BTC and ETH make their breakouts these correlated charts have a high potential for doing the same and can produce some profitable trades.
That’s a wrap for the first Sunday Synopsis.
Next week’s issue of the Sunday Synopsis will be for the paid subscribers only so if you want it you have to subscribe. Monday, June 6 I’ll be posting the Micro Monday Newsletter which will be free for all subscribers for the first week only. It will be focused on the traders and highlight things to note on the intraday timeframes and potential trade setups.
See you in the next issue.
@theprivacysmurf
I LOVE IT...😳😱🤯!!!
I need more cowbell...
Hey Terry, like your video posts, this is PACKED with information! I am adding this to Monday agenda for carful review!