

Sunday Synopsis #17: Stealing the show
Sunday Synopsis #17: Stealing the show
BTC hogging the spotlight...


I know I normally start the analysis with BTC/USDT but we have before us a perfect learning opportunity. Here’s an update from a chart concept I introduced last week outside of the newsletter on Facebook. I have it labeled as the Crypto Money Fountain in my tradingview list.
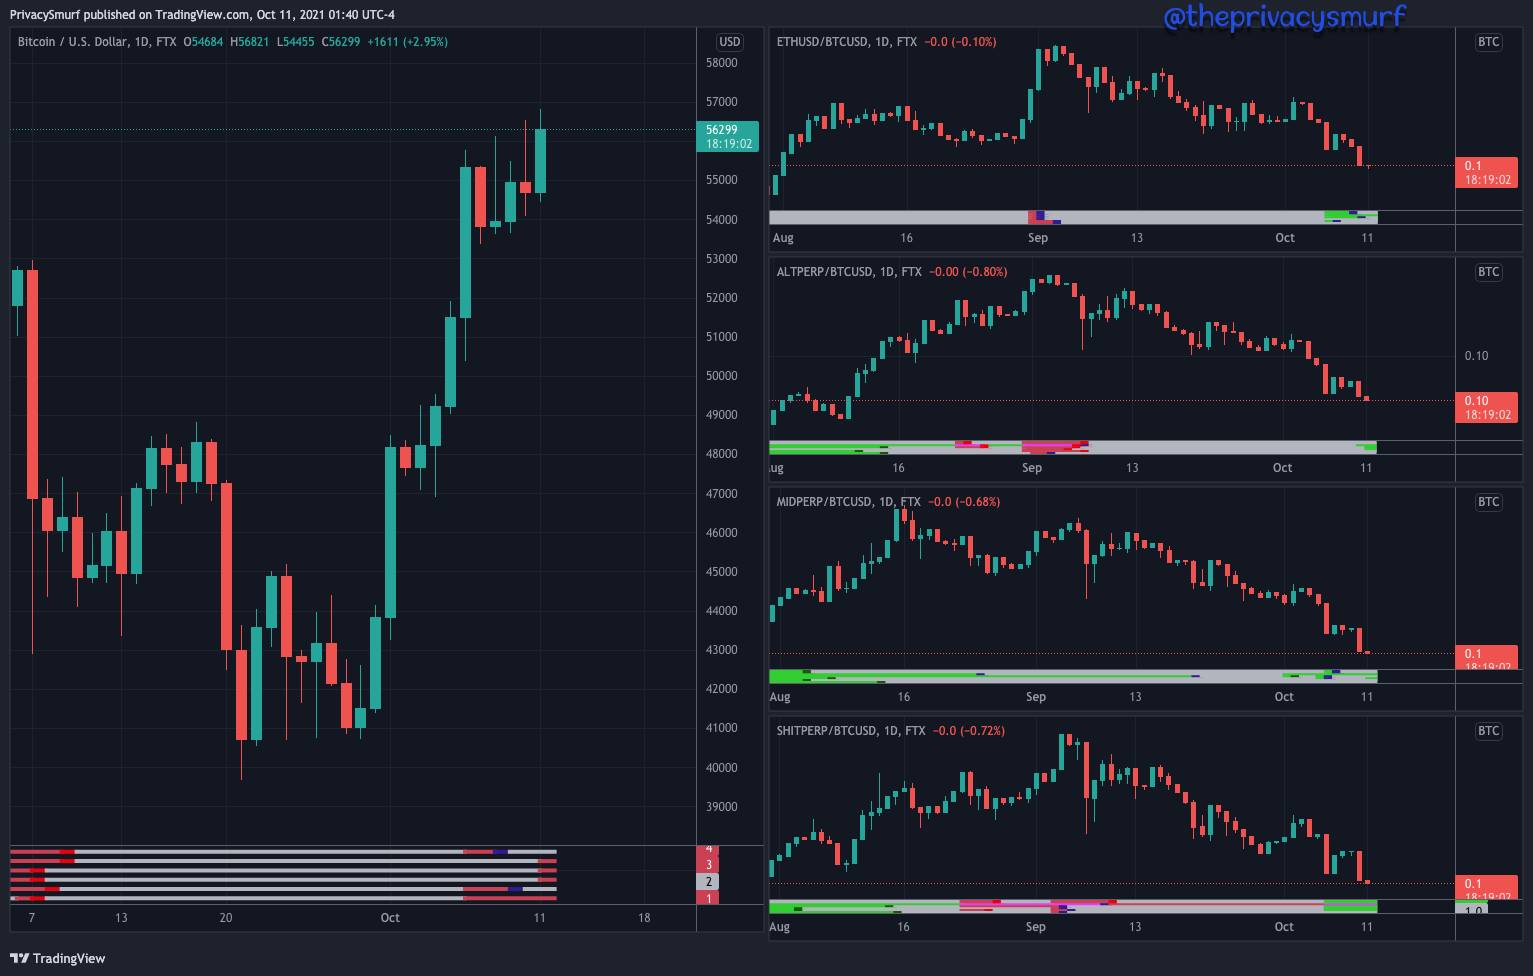
What I’m going for with this chart is to show how money is flowing throughout the market. On the left, we have BTC/USD. On the right from top to bottom, we have ETHUSD/BTCUSD, ALTPERP/BTCUSD, MIDPERP/BTCUSD, and SHITPERP/BTCUSD. I’m dividing FTX altcoin indexes by BTC. It’s meant to illustrate what type of coins are performing well or poorly against BTC. The typical money flow in the crypto market is fiat to BTC, then BTC to ETH, then into large caps (ALTPERP), then into mid caps (MIDPERP), and finally into small caps (SHITPERP) before returning back to BTC. Looking at the chart we can see that BTC is outperforming everything. Most of the money is moving into BTC both from cash and from alts selling into BTC. How does one use this information? Be careful with your alt exposure in trades. Typically BTC will influence alts but it’s even more so now. In these conditions when BTC goes up, alts will decline. When BTC declines, alts will decline further. This can also be depicted in a BTC.D (bitcoin dominance) chart but I like this visual more as it can show where money is going instead of just knowing that it’s present or not in the marketplace. On the bottom of each window, I have the (in beta) Correction Strength Meter indicator. It’s showing that BTC is showing a possible bearish correction setup, but setups don’t really mean too much without a confirmation trigger. Also, an interesting point is a bullish setup on the SHITPERP chart. Money is showing up in speculative low cap coins. Potentially new retail money is getting introduced to the market through these cheap overhyped coins in social media. Typically DOGE was visible front-running bullish alt seasons. Maybe this is happening now.
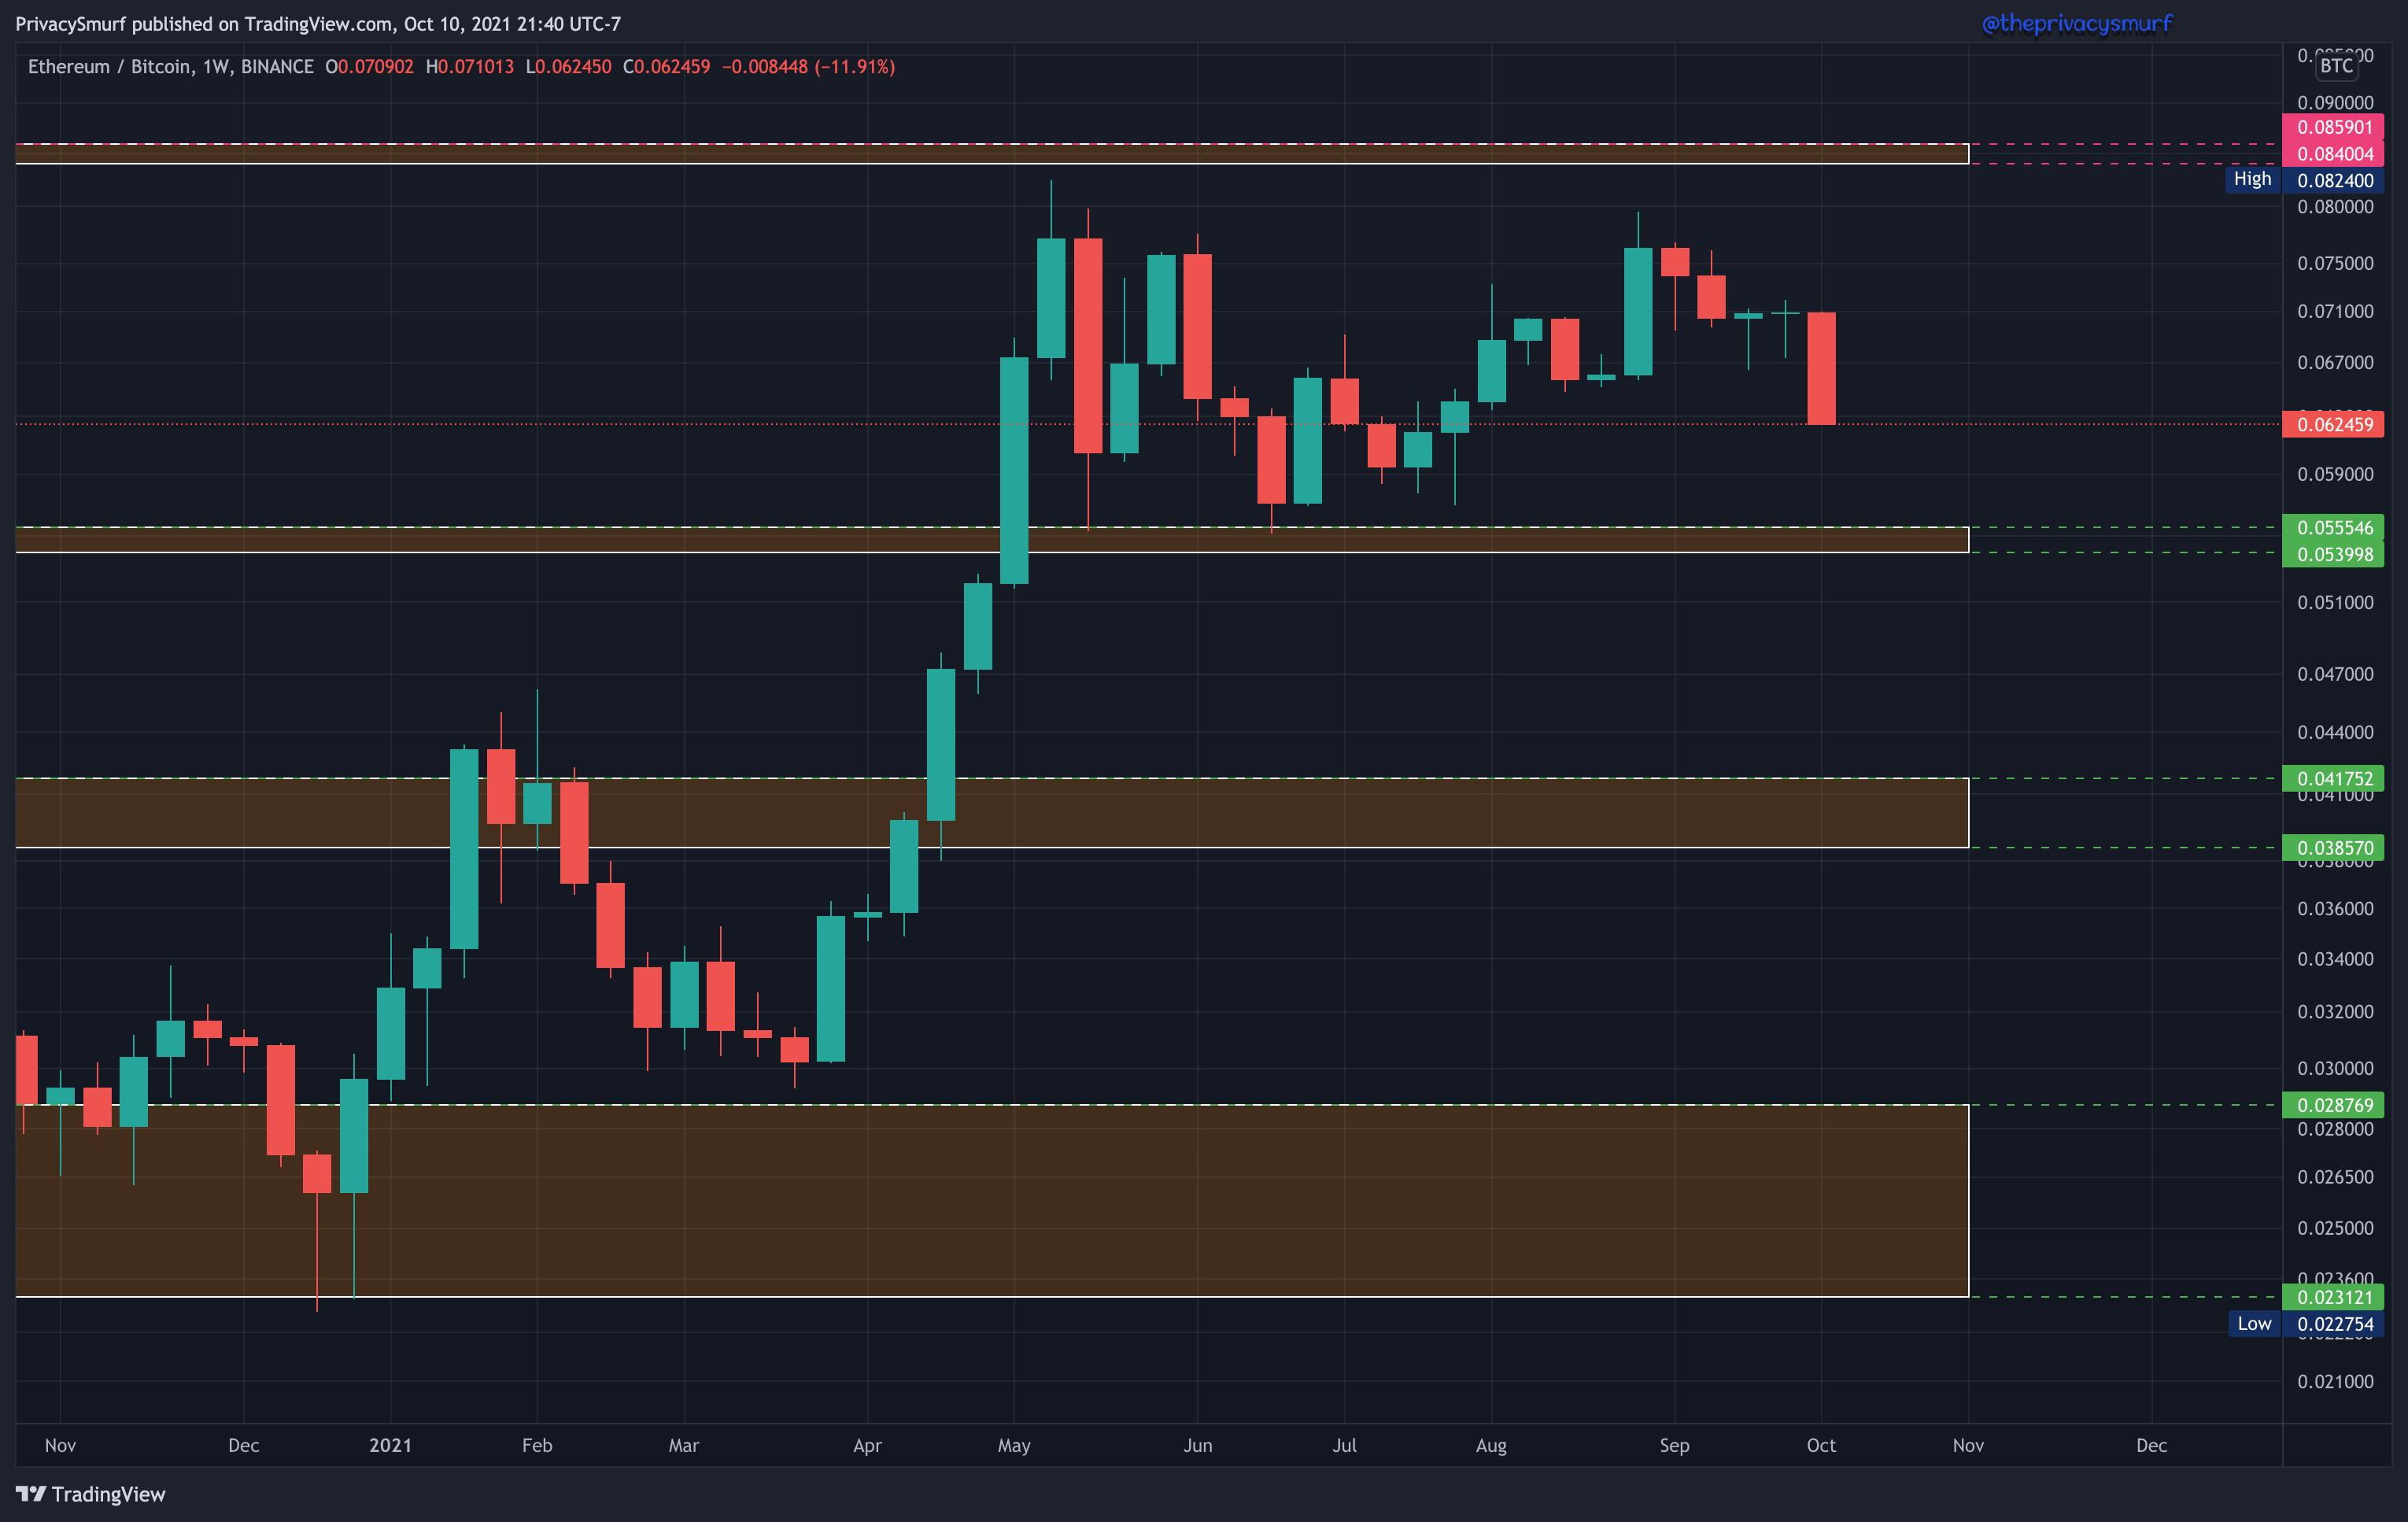
ETH-BTC ← chart link
I’m moving over to this chart next because I think it’s a more important next step. ETH fell hard this past week in terms of value compared to BTC. Establishing a new weekly low close is not a great picture. I expect some continuation to the downside at this point with some support showing up around 0.053 - 0.059 BTC where it may be an opportune price to buy some ETH with BTC for the bounce. It’s still BTC’s show unless some support shows up.
The daily chart we can see that the ascending trendline was broken, weak support around 0.064 BTC (prior support) was tested and has failed. I added back in a descending trendline that was broken in early August. I think it’s likely we test the trendline again and it’s currently sitting around decent support. I’ll be watching for bullish candle patterns to look for buys ETH with BTC at a spot upwards of 0.056 BTC.
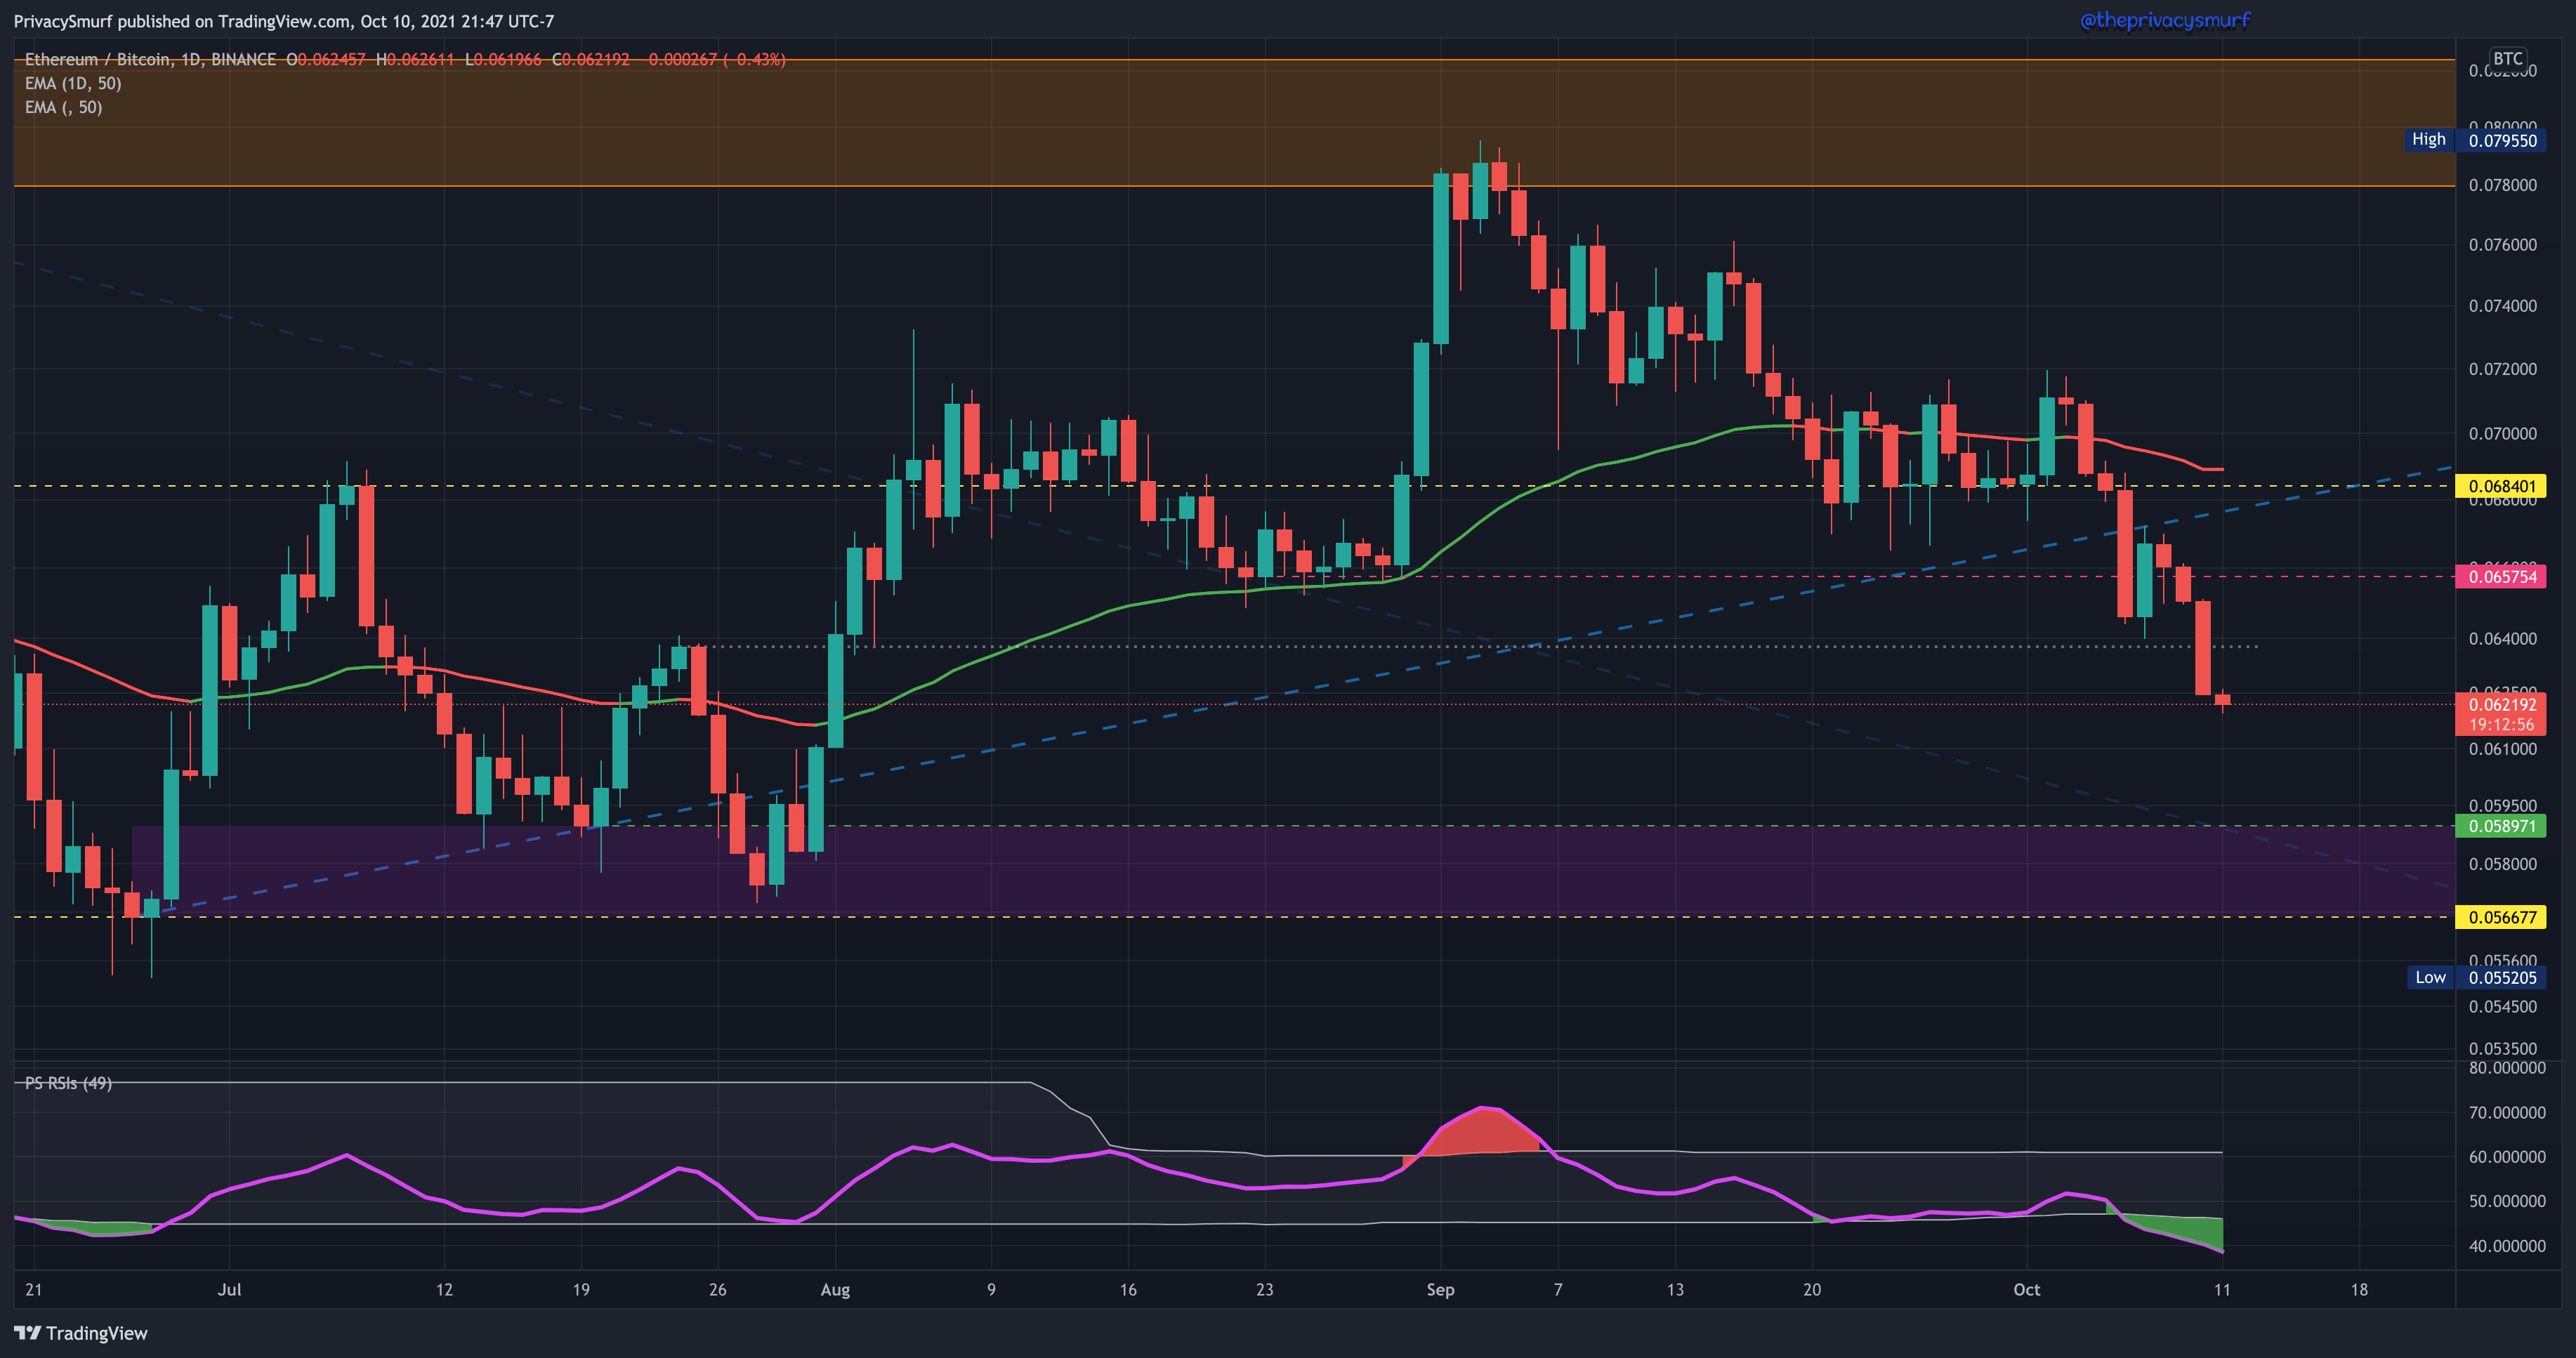
Keep in mind with this chart failing BTC is going up in value.
ETH/USDT ← chart link
Overall ETH had a lackluster week. This particular candle formation is a doji. Where the close and open of the bar are nearly identical and occurring near the middle of the bar. It is showing indecision in the market. Neither bullishness nor bearishness. It’s not wonderful but it will often lead to some sort of good price action afterward. There’s no way to make a good assessment of that directionality on this chart though.
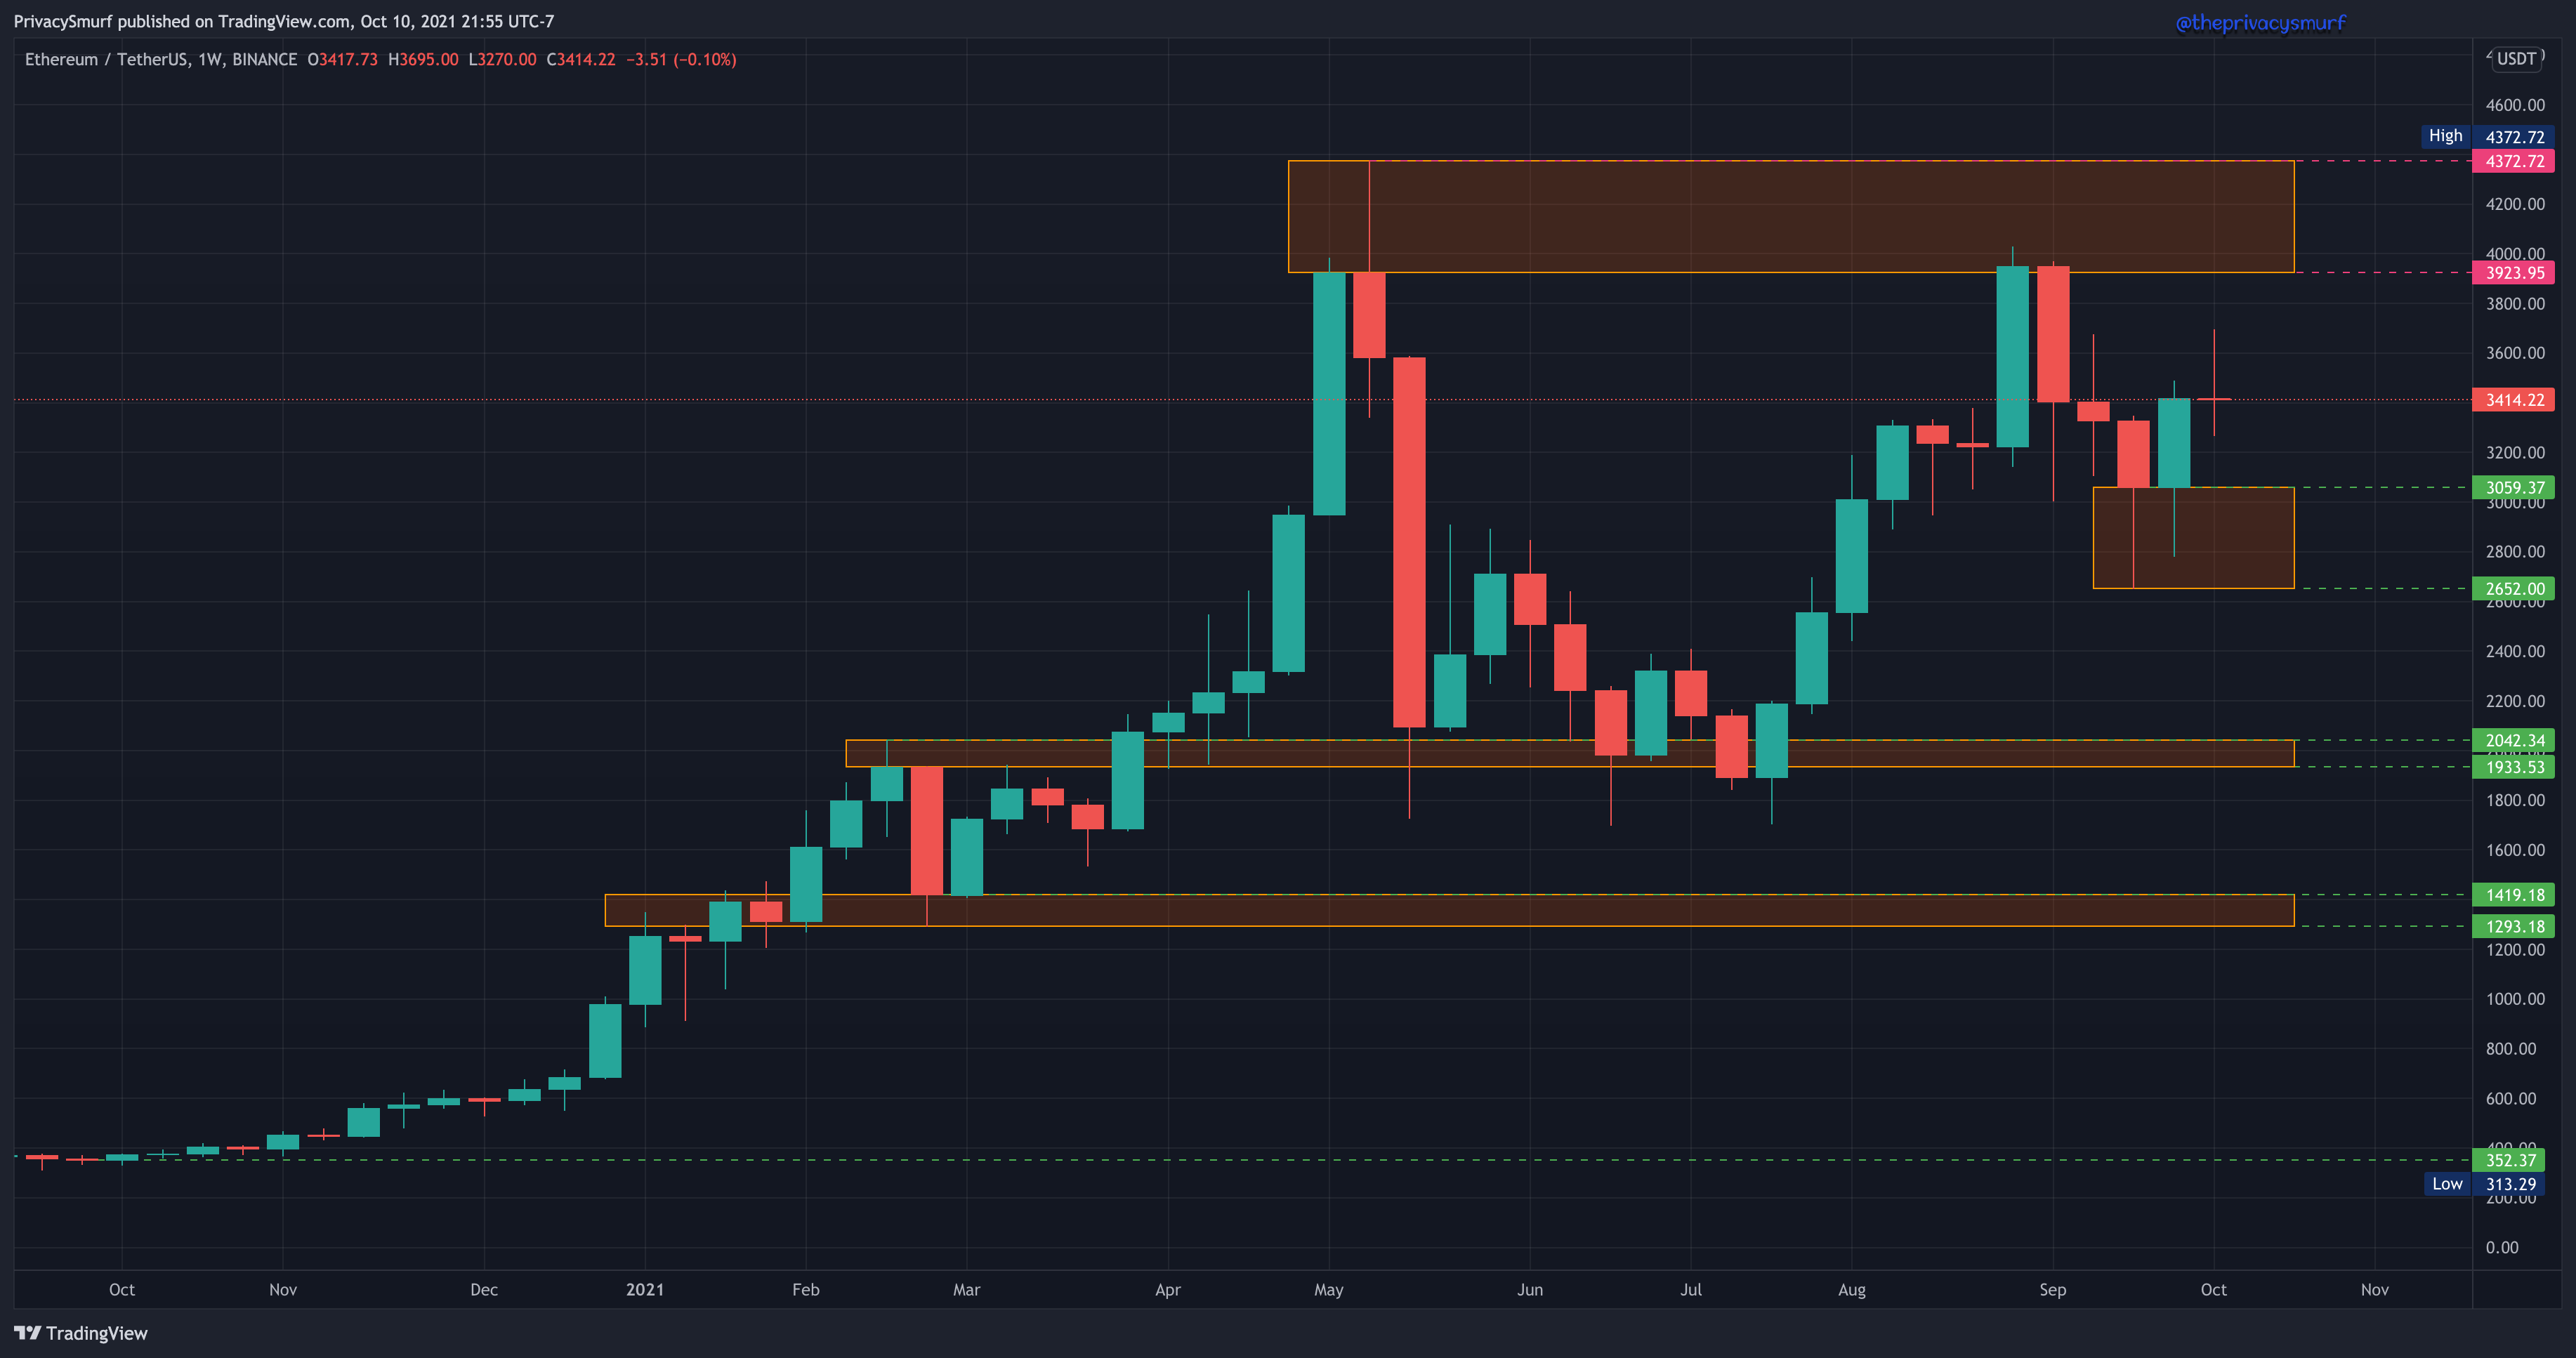
The daily chart shows the $3700 ceiling holding for now. I expect $3200-$3375 to be the support for the next day or two. The 50-day EMA just over $3200 will be the line in the sand for a bullish case. Failure there may happen though if volume slows during the week or BTC makes a big push up, as we talked about in the ETH/BTC chart. I’d be buying a bullish candle pattern at $2652-$3000.

With the RSI trailing down between the bands I don’t see much reason with this current picture to think ETH is going to bust into new highs this week.
BTC/USDT ← chart link
Now for the headliner. That risky bullish engulfing candle last week turned out to be a good bullish setup. The next weekly resistance structure is up at $60K. We may be testing that soon. I think at least 58k is a likely bullish target this week.

We are in a pretty interesting spot looking at the daily chart. We have another bullish engulfing candle closing above a resistance. The RSI is still above the top band so we may have a little bit of bullishness left but it doesn’t look like the setup to carry us above 60k. That can always change later in the week though. If this resistance ends up holding a retracement to $52K-$53k could be a really great setup to the long side if the oscillators support a bullish thesis.
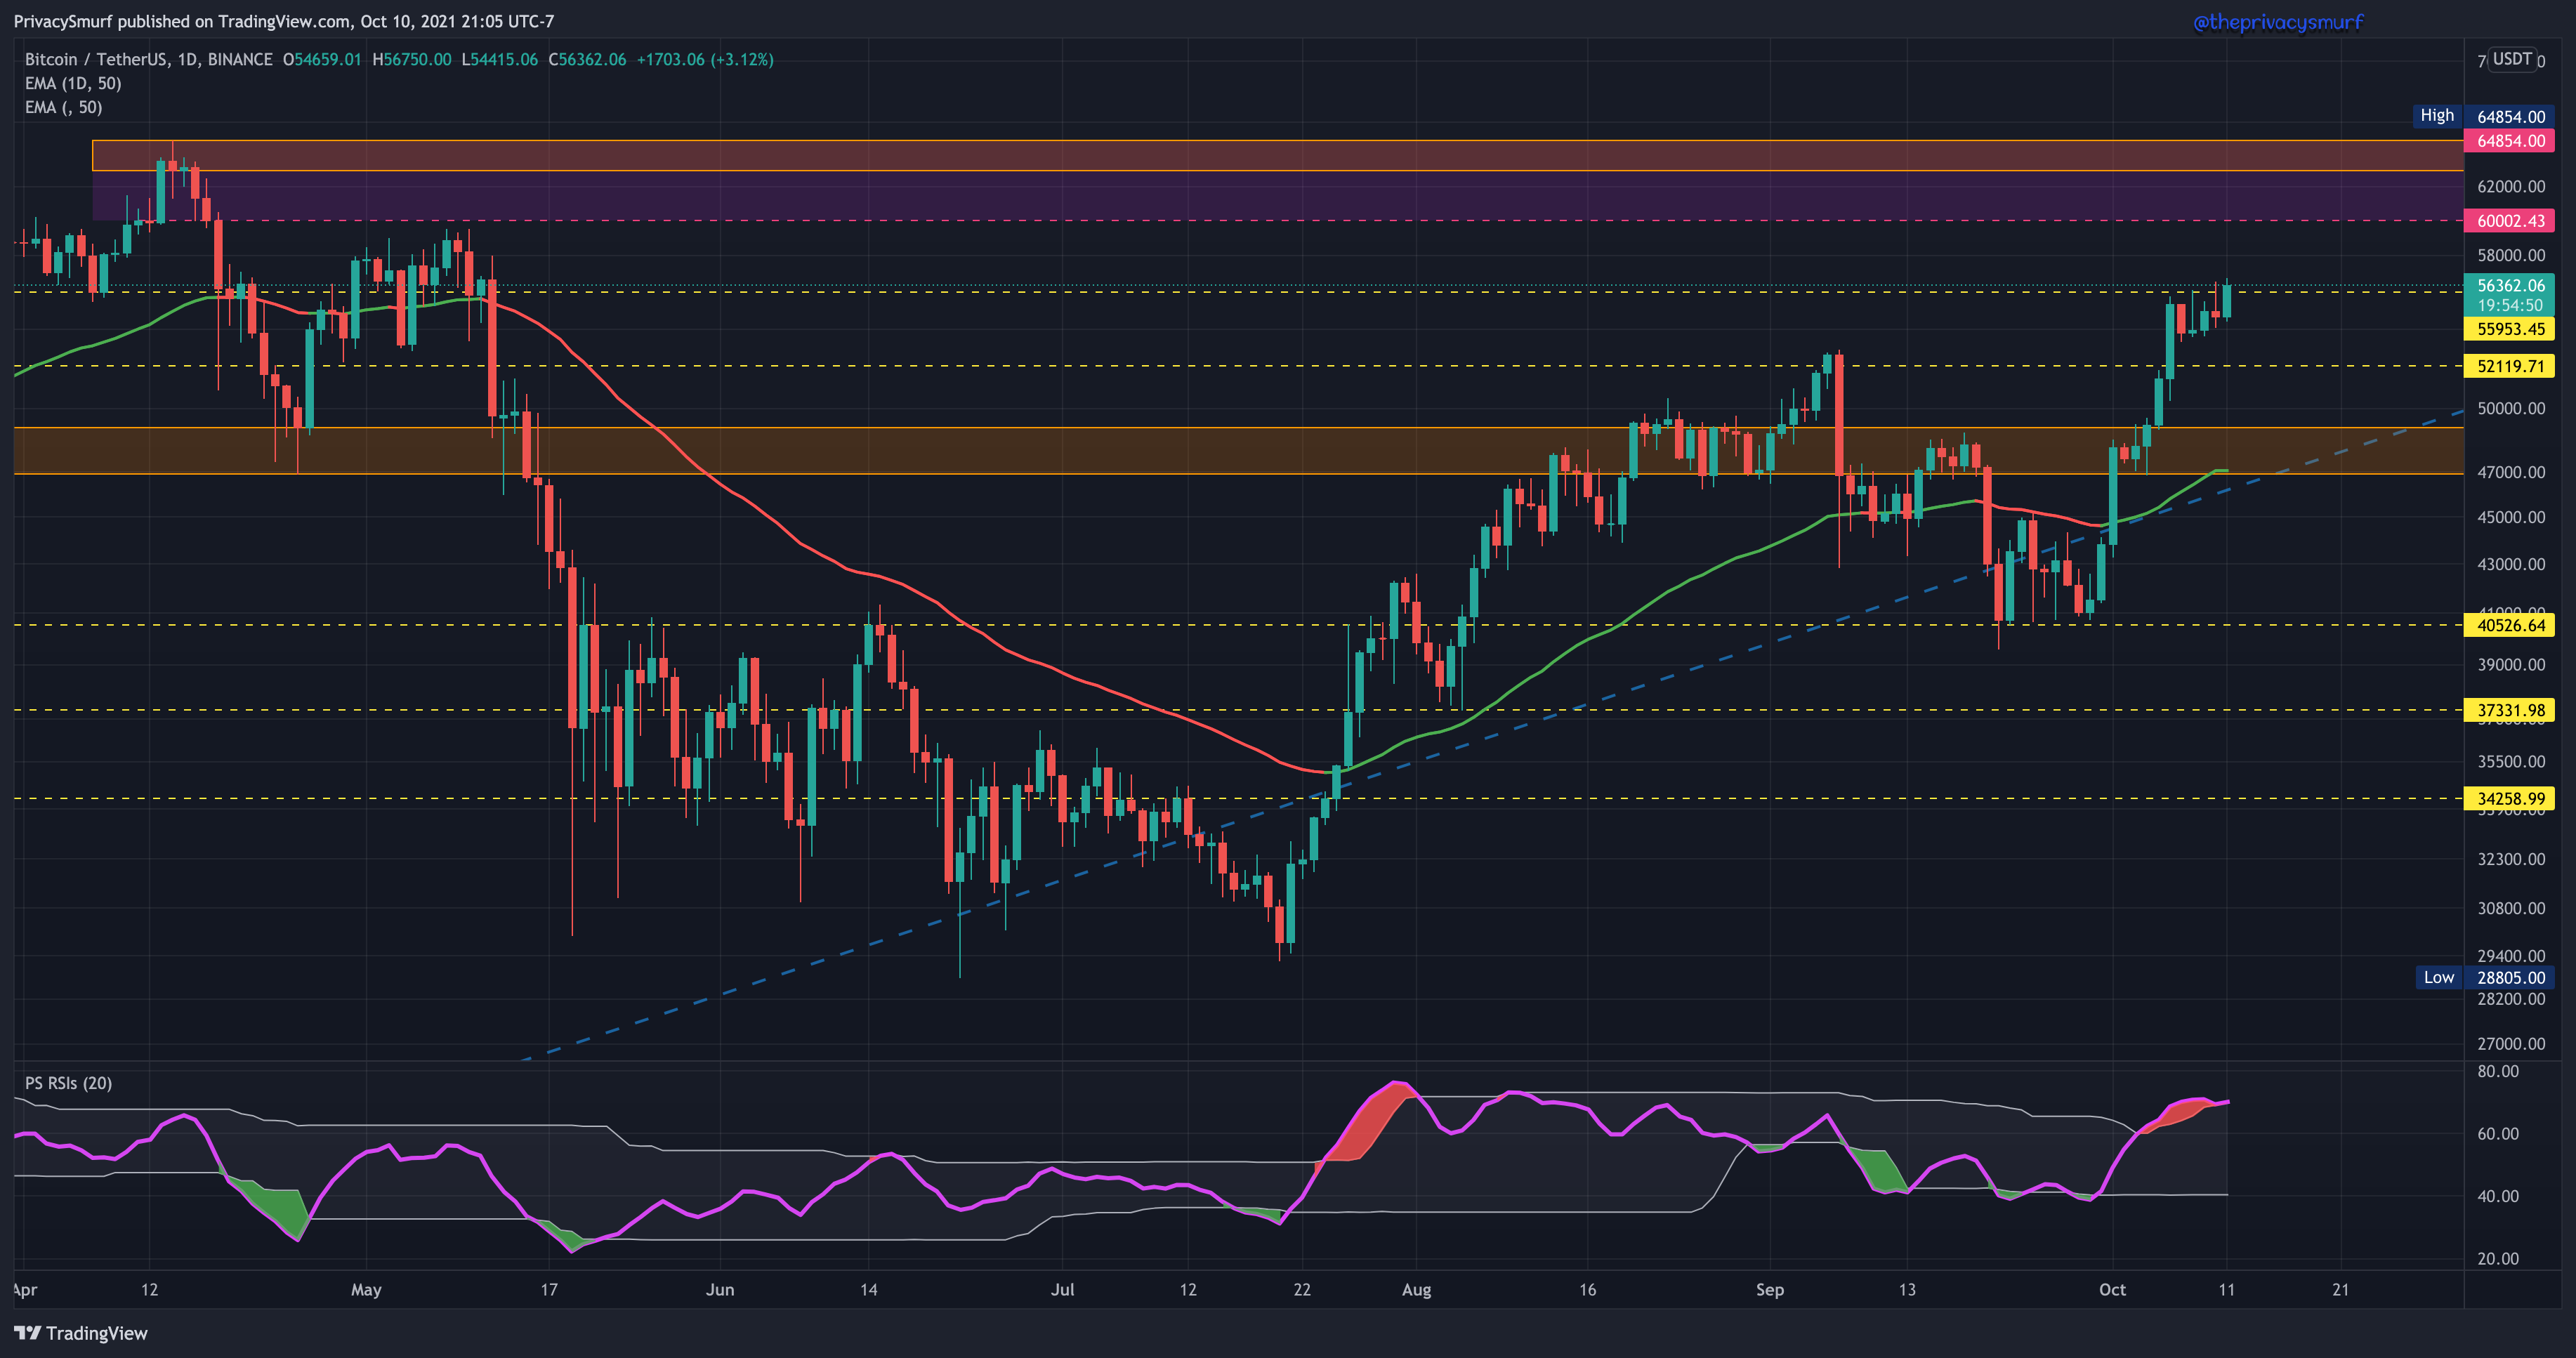
The current breach of the $53K mark led me to reevaluate the standings of BTC in the market cycle and its potential future put out in the Tale of Two Bitcoins post. I’m happy to report we’ve now checked off more boxes for scenario 1. It’s possible the price points I speculated in scenario two are just wrong and we are still on that track but there’s no way to know that. What I’m watching is how price reacts to what I think is an inevitable retracement to $50-53K. If BTC can manage to hold above that price point through this month that’s a strong sign for the Q4 cycle to mean new all-time highs. Keep an eye on the ETH/BTC chart (look for bullishness) or at least BTC.D (look for weakness) because these charts will show when it’s time to get into altcoin positions. Until that happens most alt coin rallies across the board will most likely be limited in upside potential. Since the rally starting in late September you can see that BTC has had most of the gains across the market. With BTC hogging the attention you will get more returns by just being exposed to BTC right now, with CAREFUL speculation on small caps and privacy coins.

See you in the next post. I haven’t decided what the Thursday topic will be yet. Drop a comment if you have something you’d like to have covered. Also, leave your suggestion of one or two altcoins for the Saturday alt coin showcase.
Cheers,
@theprivacysmurf