

Sunday Synopsis #18: So close
Sunday Synopsis #18: So close
We want new ATH right meow!


BTC/USDT ← chart link
It’s always a pleasant surprise to have expectations exceeded. Last week I posted the following regarding BTC.
The RSI is still above the top band so we may have a little bit of bullishness left but it doesn’t look like the setup to carry us above 60k. That can always change later in the week though.
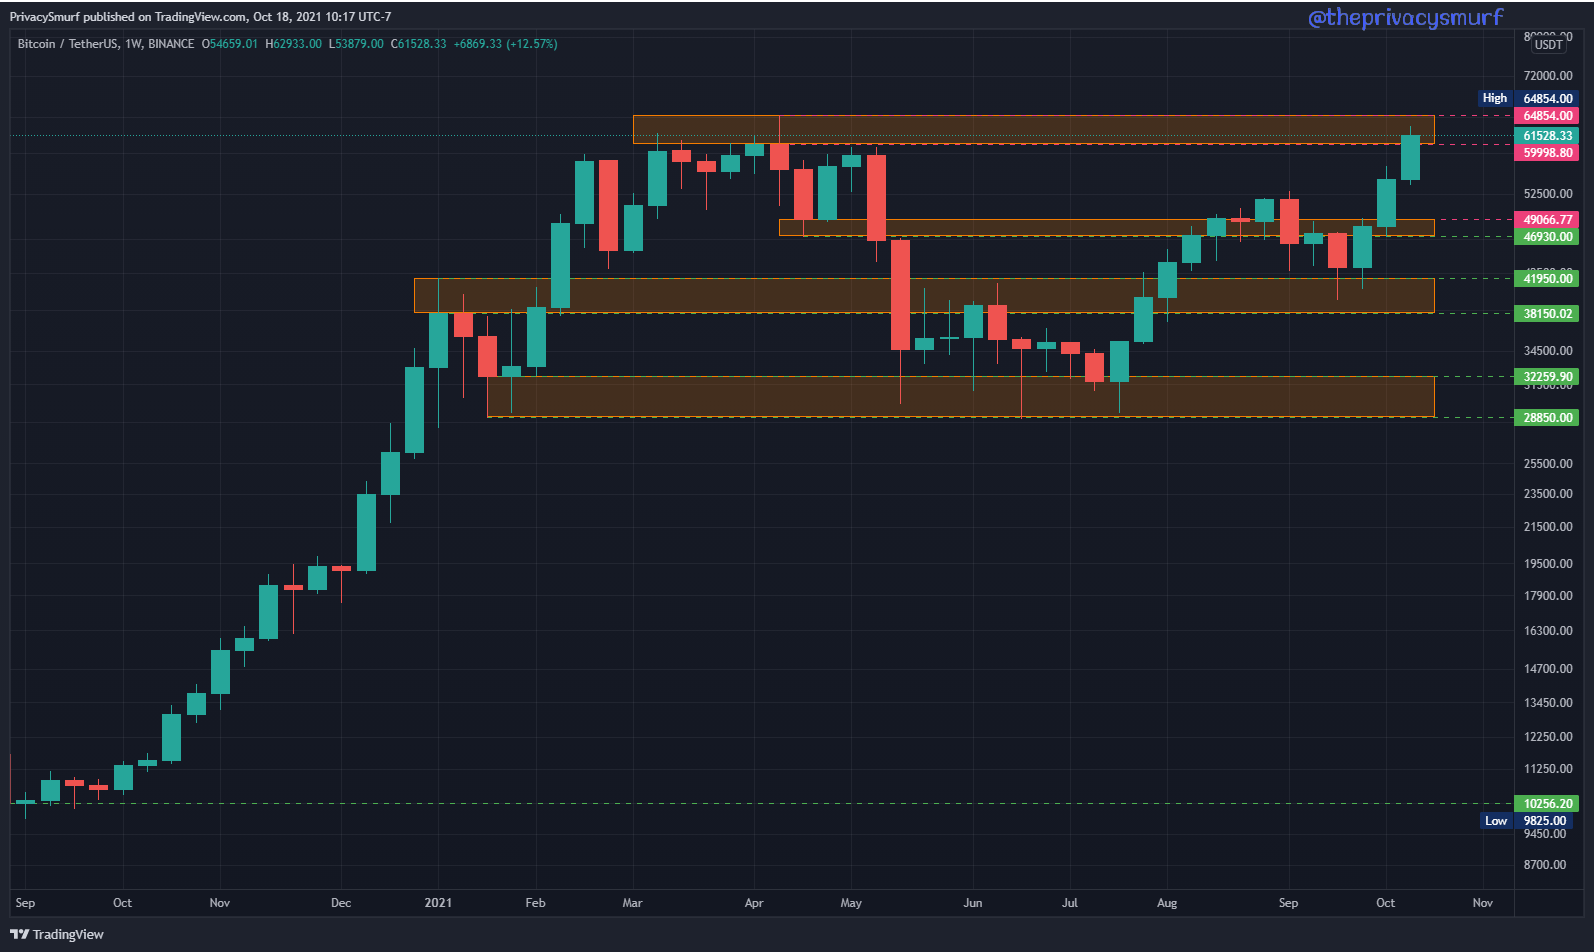
The price sat stagnant under 58k until Friday when it broke through resistances and above $60k. Here’s what the weekly chart looks now. From a market structure standpoint, this weekly close above the previously highest weekly close presents a case for bullishness as it officially establishes a bullish trend, a low pivot point in July, a high pivot in late August, a higher low in mid-September, and a new higher high close this past week. This is also the highest ever weekly close. One tiny thing to keep in the back of your mind is that market structure alone is not the best indication of future trend direction. The same scenario, although inverse, presented itself in July. The close in the second week of July was also confirmation of a bearish trend and a break of market structure support that brought up the possibility of further retracement to $19k, yet price reverse and brought us to where we are today.
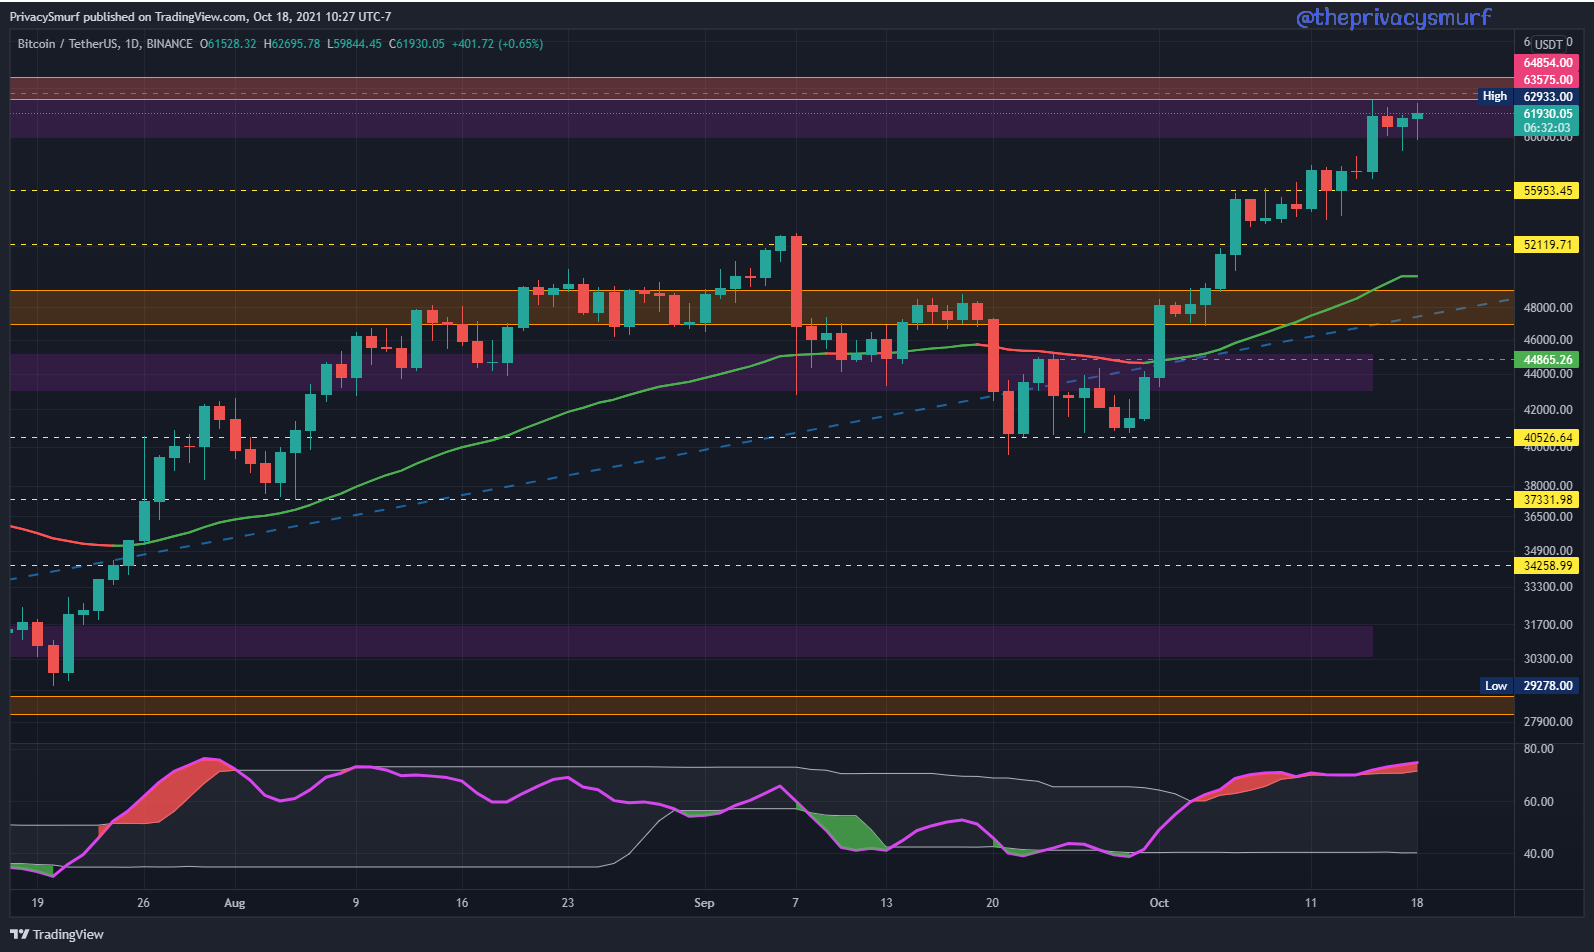
The daily chart shows plenty of resistance still being worked through. A promising aspect in all this is the recent measurements on the RSI are in line with the price on the daily chart. There are no bearish divergences, the new highs in price are accompanied by new highs on the RSI. There’s no reason to suspect dramatic decreases in price and when there are retracements supports are more likely to hold up.
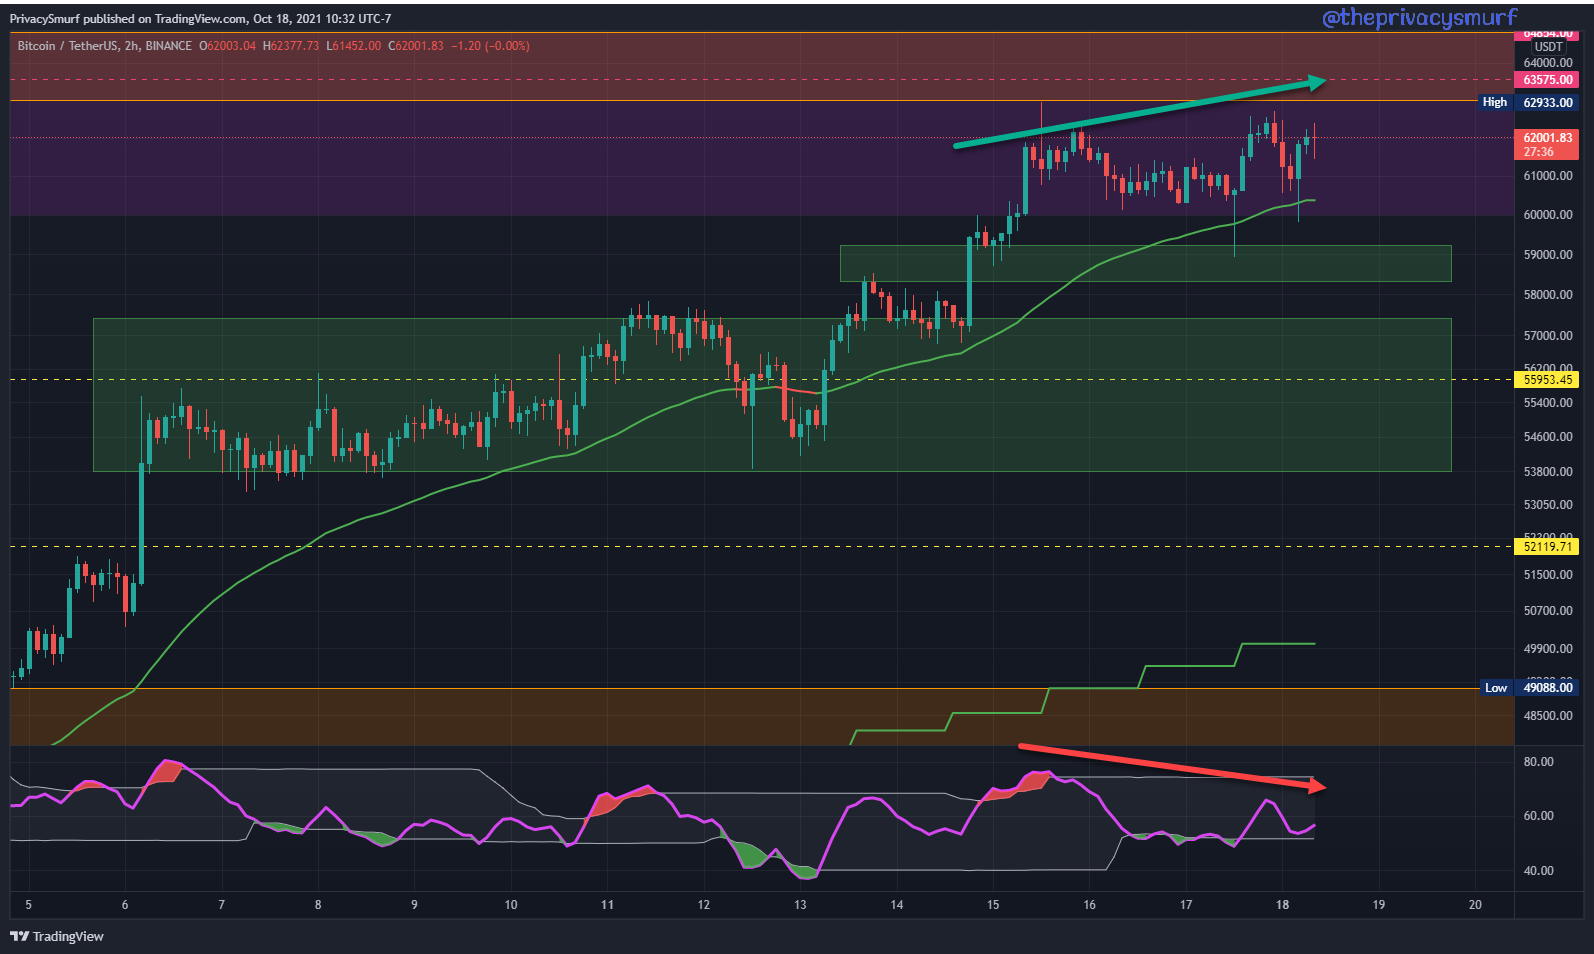
When the crypto market gets as bullish as it is oftentimes retracements to test major support won’t happen. I’ll evaluate multiple possible entries for positions on the daily chart with supports from the 2HR or 4HR chart. Below we have the 2HR chart showing signs of bearish divergence. The most recent highs are not met with new highs on the RSI signaling the potential for a retracement. Since the daily chart price action is still in line with oscillators I’m not anticipating a big pullback. Note how in the past month the 50-period EMA has barely been touched. This EMA is one potential entry point, although risky as it’s been tested more frequently as of late and may be getting weaker as support. The next zone down around $59k is another possible entry point. I personally like this zone and caught the last wick down for a short-term trade. For medium-term and long-term positions with the least amount of risk, but the highest potential for missing an entry is the large zone from $54k-$57k. This is the zone where I add to long-term spot positions, as I feel that’s the support needed to be tested for the next parabolic rally. Way down at the bottom of the chart is the 50-Day EMA. I highly doubt price will retrace that far anytime soon but if it does I’m for sure adding to spot positions there.
ETH-BTC ← chart link
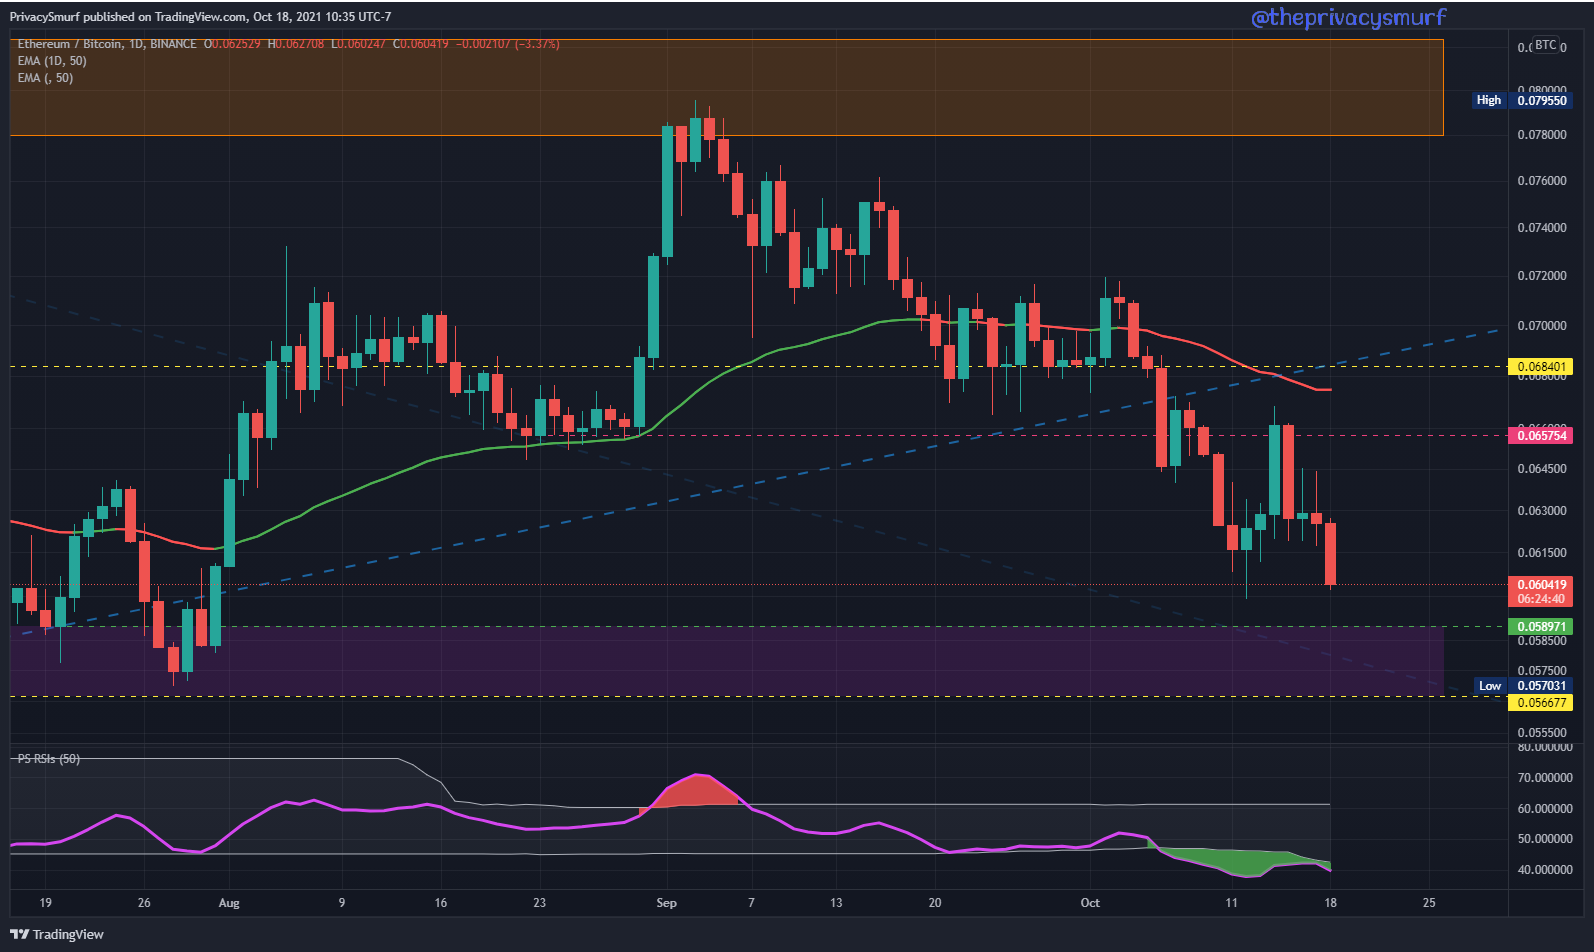
Things have changed but not changed in the value relationship of ETH and BTC. The week closed slightly higher than last week but is still technically in decline. There are not a lot of assessments to be made with this current picture so we can move to the daily chart.

The most recent price action is showing more testing of prior lows. The RSI isn’t showing any bullish divergence yet on the RSI. I wouldn’t be buying any ETH with BTC until the price ventures into support zone below at 0.056 - 0.058 BTC. This chart is still showing that altcoin exposure is still risky as BTC going up can make them decline and BTC going down can make them go down more. I’ll get more into this topic in the Thursday post. A bullish candle pattern here at these lows may not be a bad entry for a short-term trade but I think upwards price action will be limited to the 50-Day EMA and/or the resistance around 0.068 BTC so taking a small position in ETH and selling back to BTC at one of those areas could be a decent short-term trade.
ETH/USDT ← chart link
BTC/USD going up and ETH/BTC being stagnant means that ETH/USD also had to go up. ETH actually beat BTC to the punch rallying a bit earlier in the week, leading me to think that an alt rally could be on the brink. That is still a possibility in the near future but we still need the ETH/BTC chart confirmation of that. The future outlook is positive in my opinion but based on the previous market structure we need this week to close above $3950 to confirm a new bullish trend.

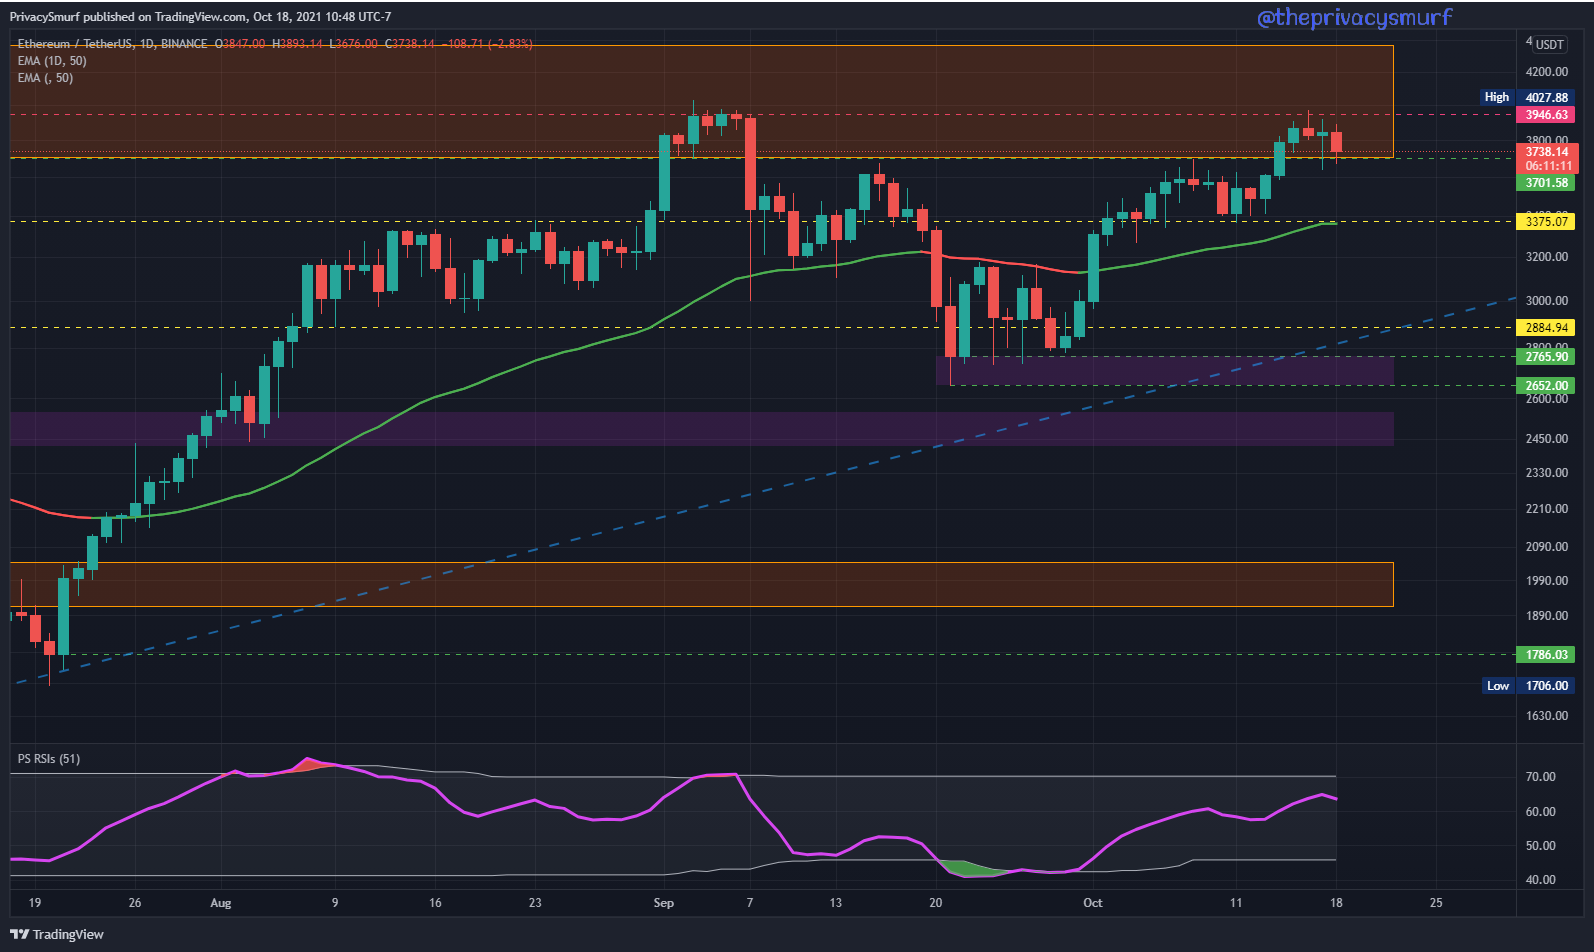
The daily chart, despite showing that a past resistance is still holding up, looks pretty good. The RSI is in line with the price so I’m not expecting any crazy bad price action to the downside. I like the 50-Day EMA being at a horizontal support level at $3375 as a possible entry position with a bullish candle pattern there. If BTC retraces too much though ETH will follow and I’d expect a price of around $3000.
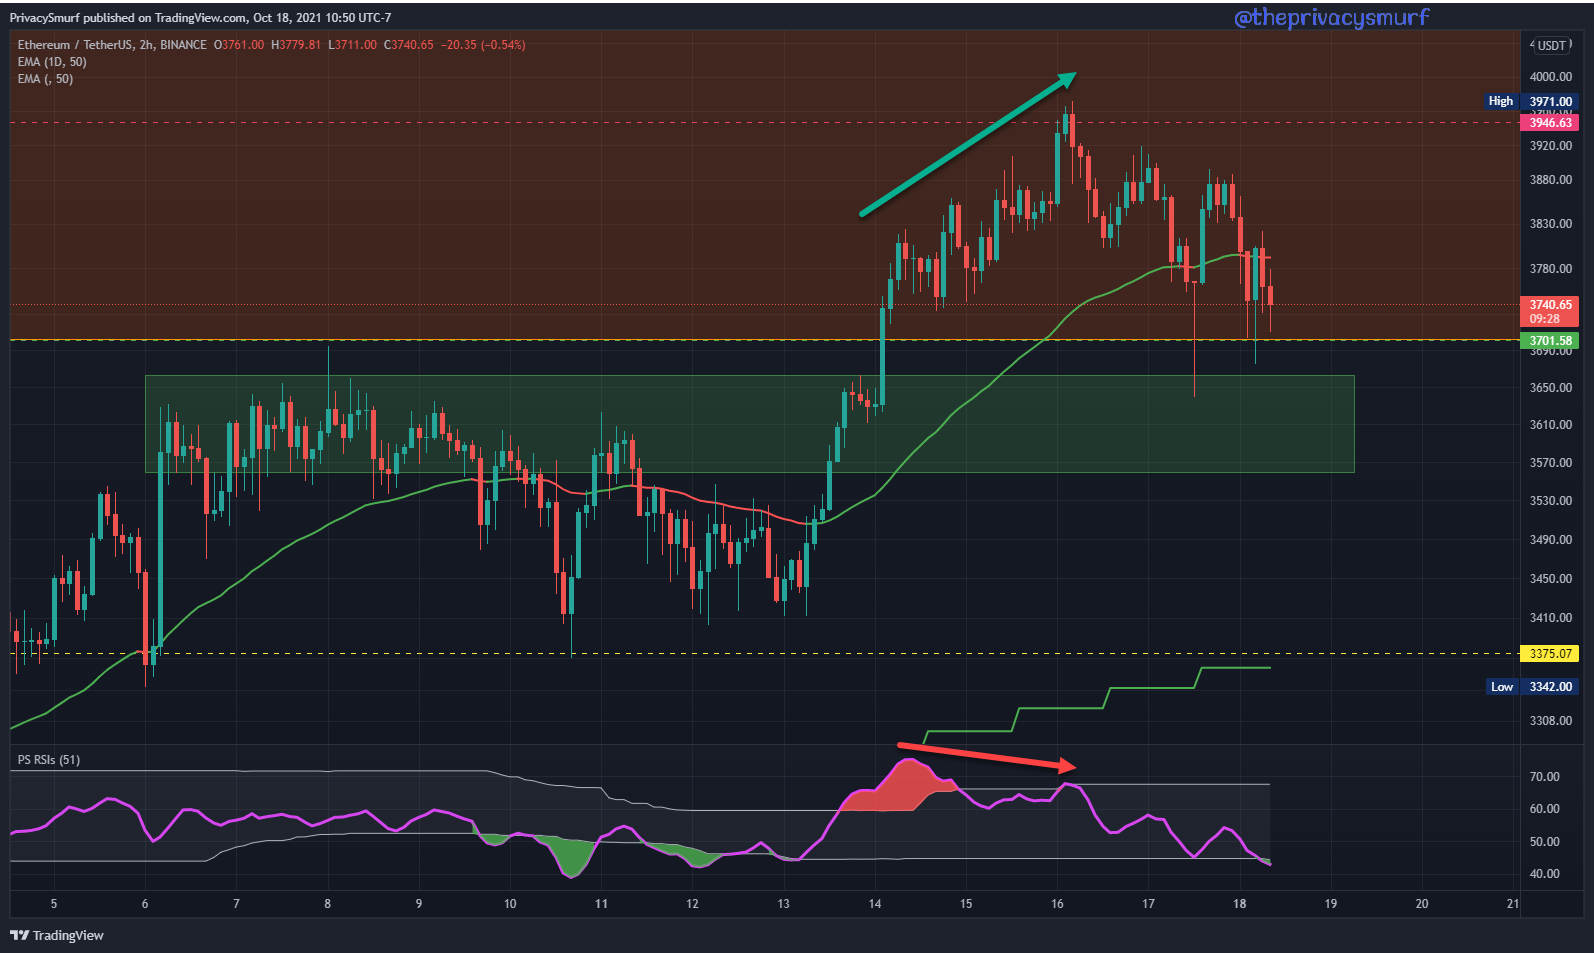
As I said earlier with the market being so bullish I will still consider intraday charts for possible entries. In the middle of last week, we saw a bearish divergence between price and the RSI. That retracement brought price down to test the former resistance as support which held. I like that zone around $3600 for a risky bullish entry to the long side. Ideally, I think $3375 is the price to be tested for the parabolic move but sometimes in these bullish periods, those pullbacks just don’t happen. The RSI is breaking below the bottom band so it’s likely that we’ll have the price at least come into the zone again this week.
I’ve got the internet sorted at the rental now so I’ll be able to get out the next few posts this week without any issues. I’ll be posting about ETH/BTC in comparison to Bitcoin Dominance and that whole value relationship for the Thursday post. I may also throw in a midweek update if the price comes down a little bit more. I’m really hoping for a retest of the low zones for this next leg up.
I also have a couple of interesting graphics from the 2017 run in comparison to now that I may bust out this week. We’ll see. It’s hard to be motivated on vacations, haha. Have a good beginning to your week. See you soon.
@theprivacysmurf
Right!