

Sunday Synopsis #21


I hope everyone who had a holiday weekend had a good one. To everyone else, I hope it was a good regular weekend. I for one ate way too much food but had plenty of fun with family and friends.
Over the weekend there we saw some market activity that I’ve written about before. I know it may feel shocking and worrying but it’s a pretty common occurrence. You can review these two posts. This type of activity is may simply be creating liquidity for a large long position.
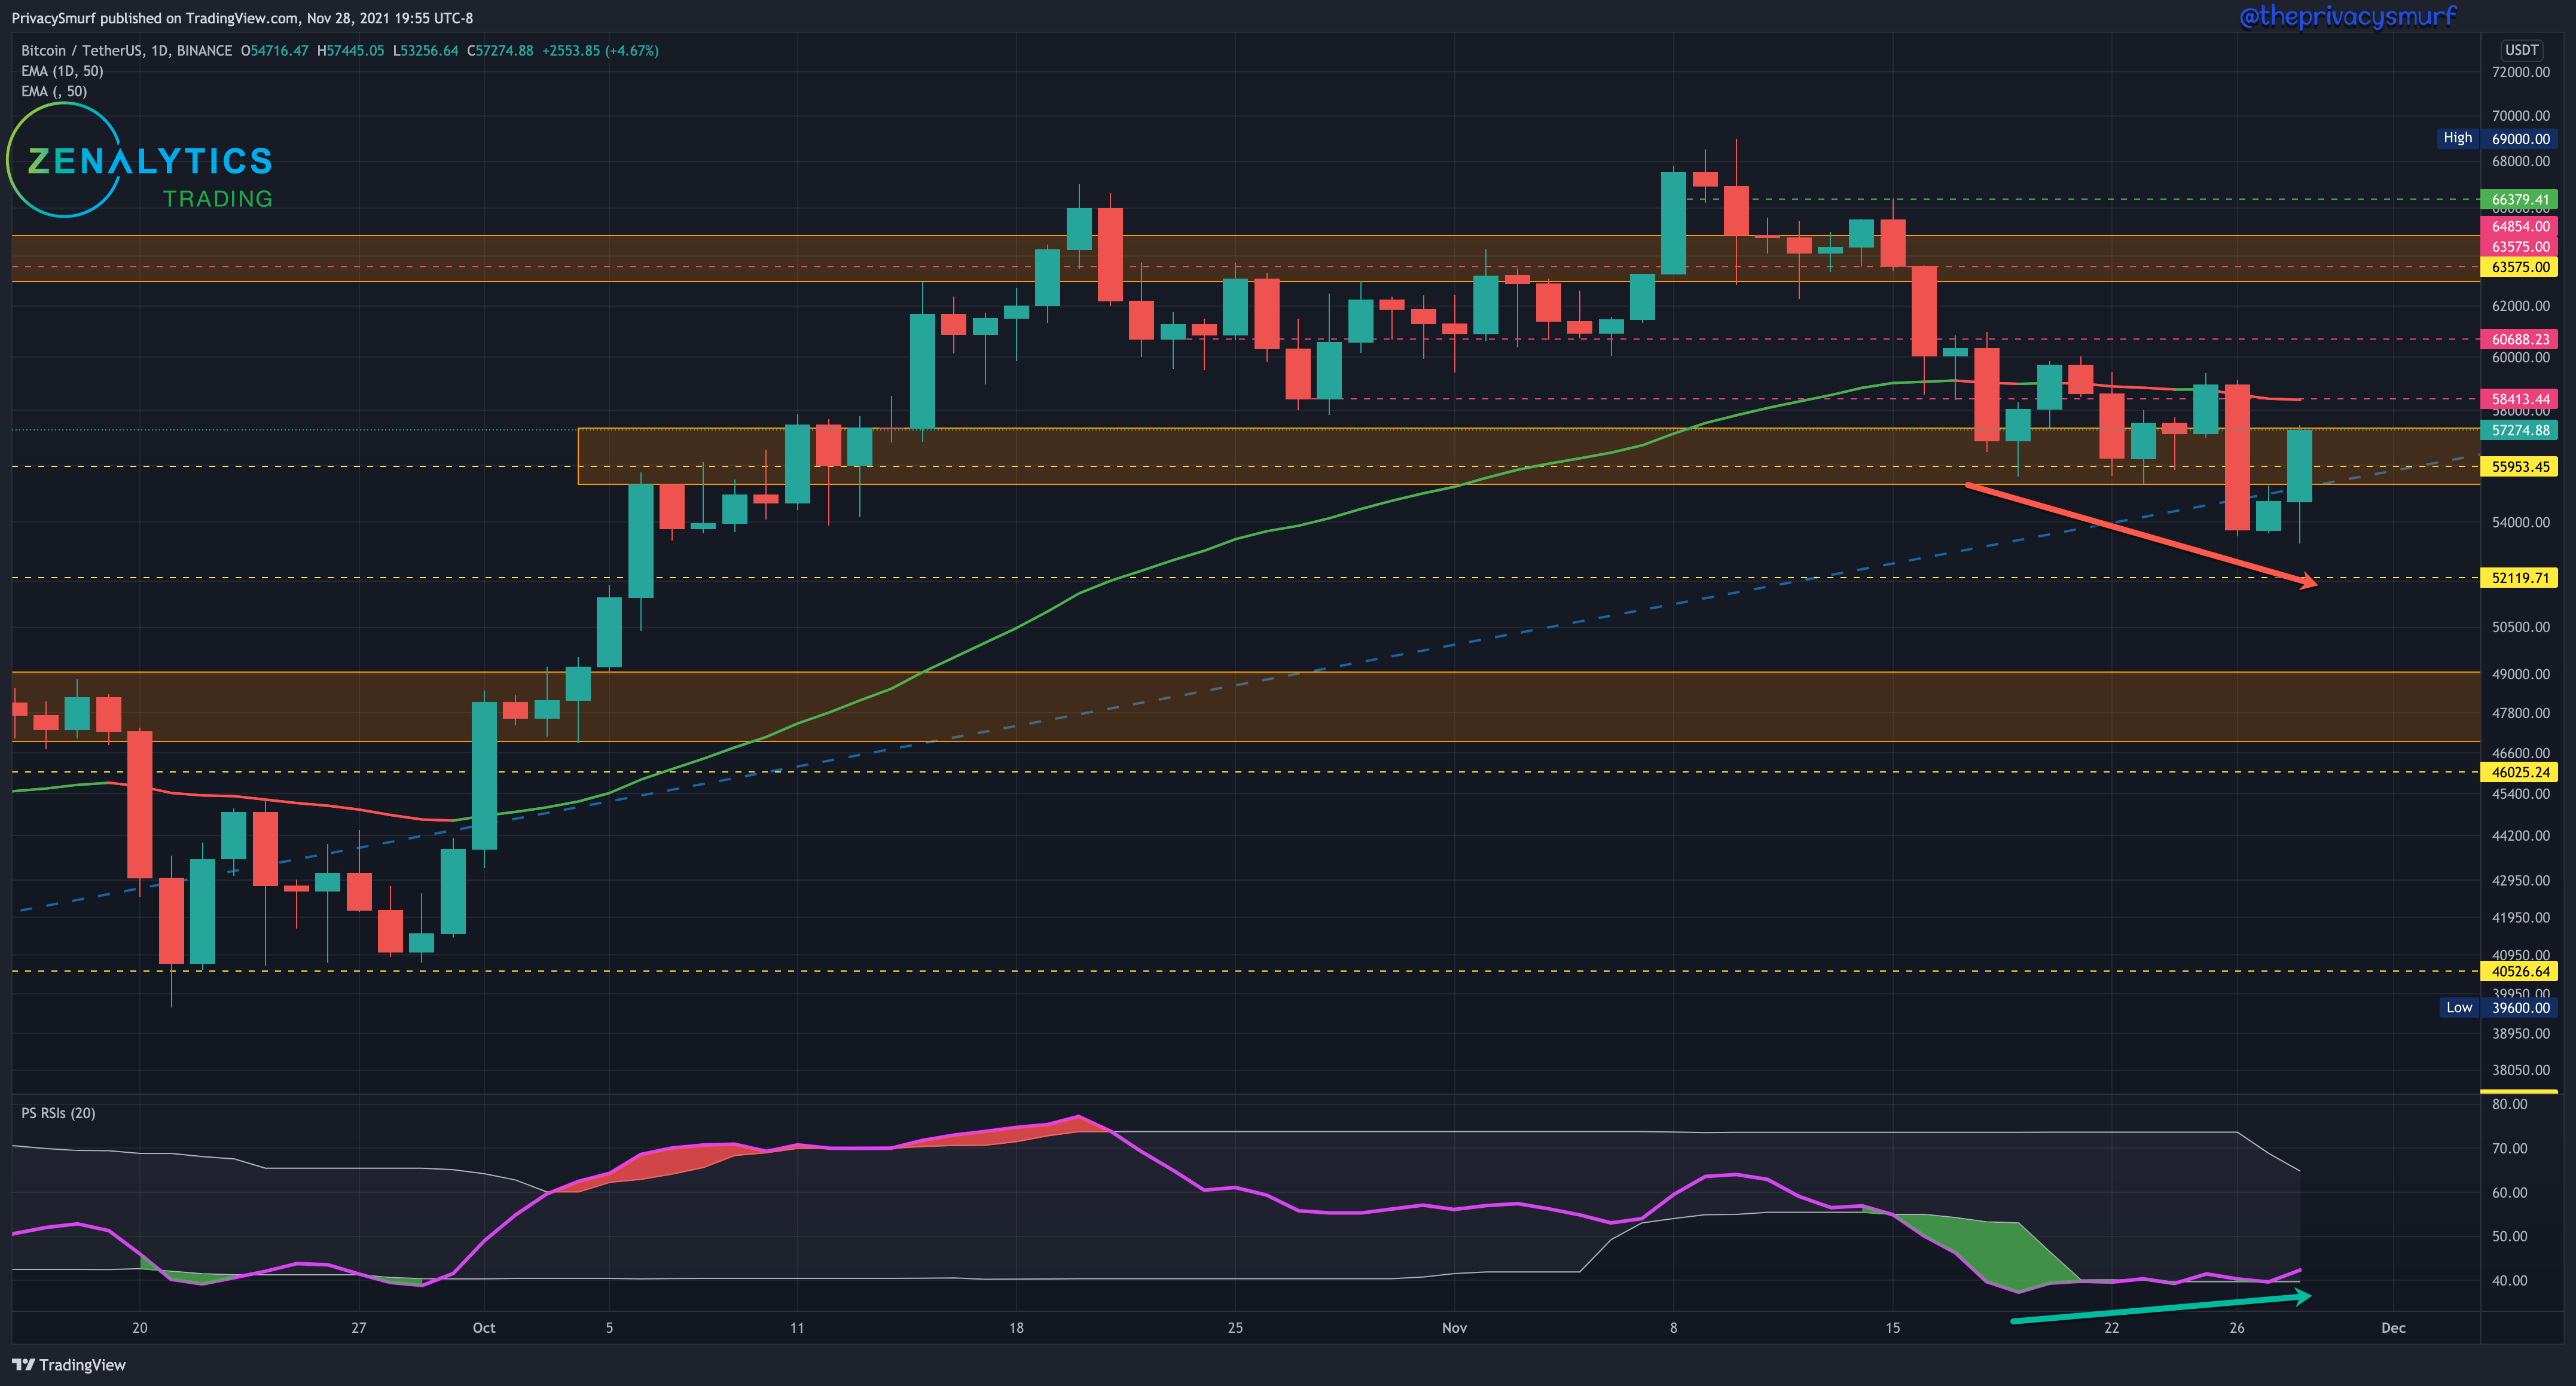
BTC/USDT ← chart link
Taking a look at the weekly chart we have another down week. The market structure is still bullish. The weekly picture will need a close below ~$52k for the bullish bias to change. I’d expect some level of support at that point as well. The week prior closing as a bearish engulfing candle doesn’t bode well for the near future but there is a clear battle for control of the price directionality because this past week closed as a hammer candle. I don’t like hammer candles as reversal signals so I wouldn’t trust that pattern to signal higher prices in the week ahead. Taking a look at the daily picture will help with determining that outlook. Here’s a quick refresher (← link) on the candlestick patterns I do trust.

The daily chart shows we finally got into the juicy buy zone I’ve been waiting for to add to my long-term spot positions. I do have dream buy orders set around the zone at 48k but that’s still just a dream at the moment with no real expectation of hitting those prices, but you can’t get a good fill if you don’t have an order into the order books. One thing of note is the minor bullish divergence with the new recent lows. The prices have been getting lower but the RSI has been steadily (dragging its feet) moving up. This shows the potential of the floor being set. I don’t like the setup so much for a trade because there technically hasn’t been enough time to declare it a valid divergence with the methodology I trade, but from an analytical standpoint, there IS a divergence between price and the oscillator. Another thing to note is the price action under the 50-Day EMA. This will now be acting as resistance. Also, take note of the price action around the long-term ascending trendline. We have a very similar setup as the price action at the left side of the chart. I wouldn’t be surprised to see the price compressed around the 50-Day EMA and the 54k, potentially as low as the $52K over the next week. We are in a consolidation period at the moment. A strong day or two over the 50-Day EMA could invalidate that idea. Even so with that, I would expect resistance to come in around $60.7k.
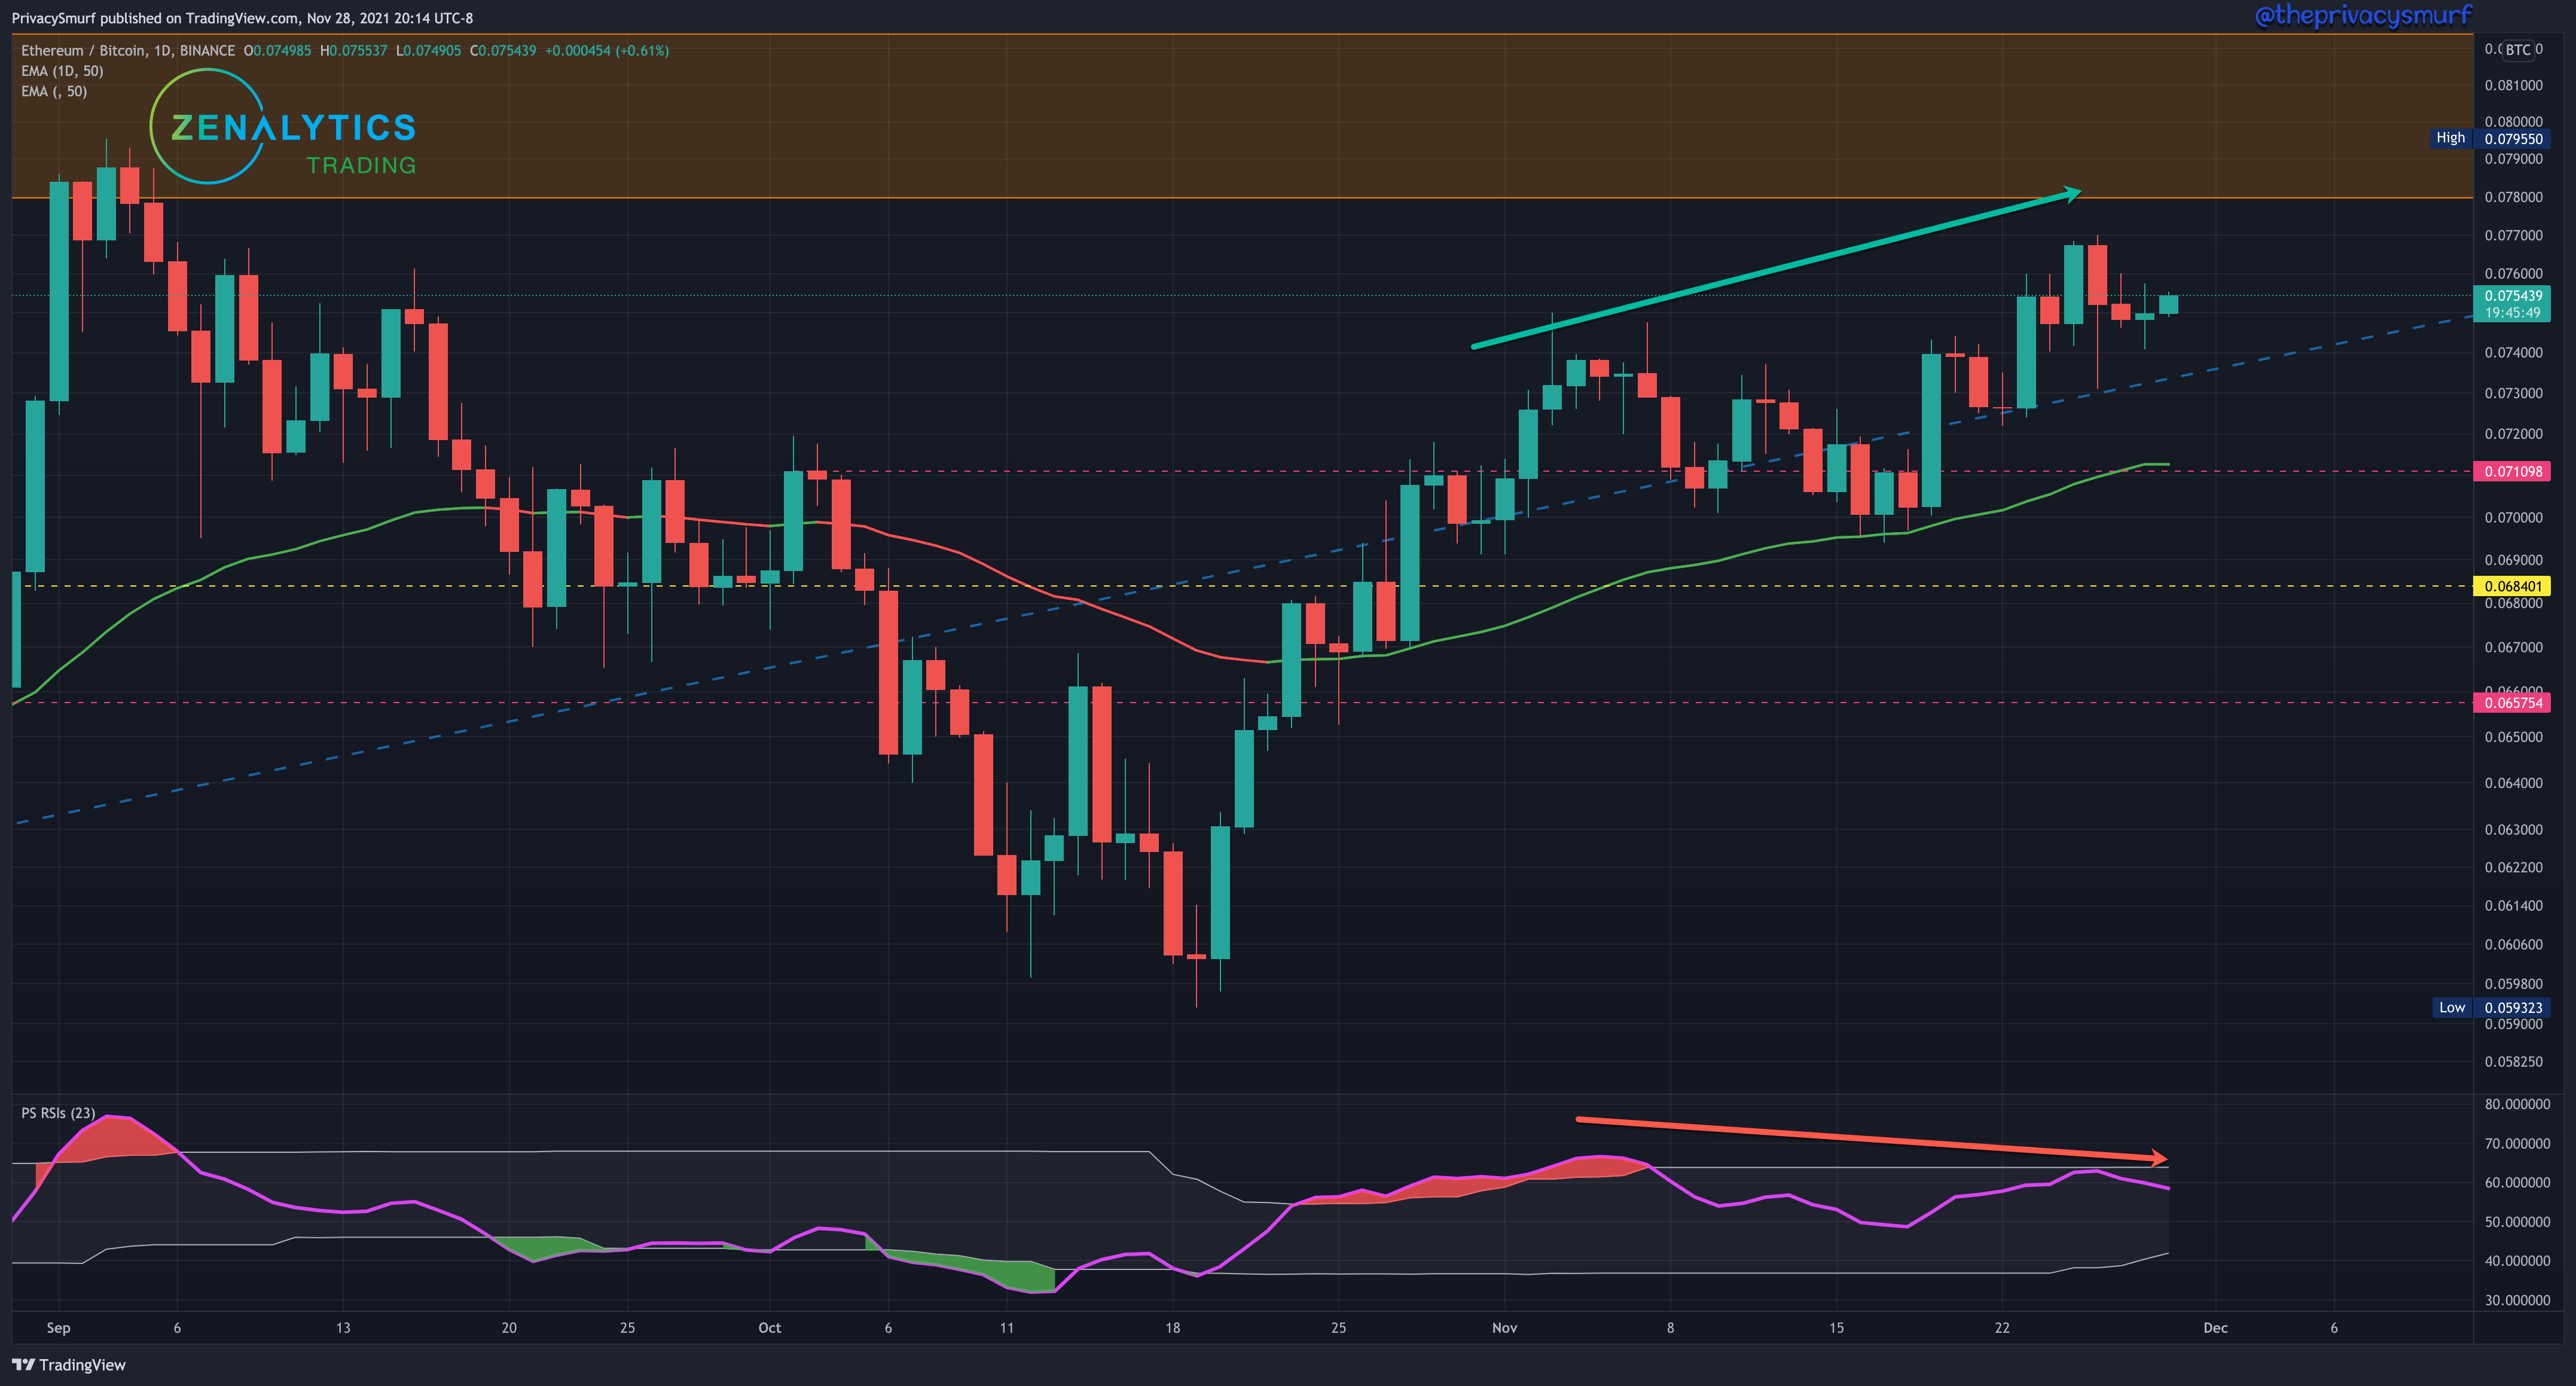
ETH-BTC ← chart link
ETH/BTC on the weekly has continued is sideways consolidation pattern. Really nothing to say here. We’ve been here before. A weekly close above 0.077 would be promising for a breakout and ETH to run away from BTC but the daily chart may have something else to say about that potential strength. It’s likely this consolidation continues until we end up on the next major bullish rally (or bearish decline).

On the daily chart we see a building bearish divergence over the past week with new highs in price not matched by new highs on the RSI. It’s entirely possible that this could be invalidated with the price scale breaking above 0.078 but that will have to be monitored. There’s still support on the 50-Day EMA and the ascending trendline has technically held up. It’s possible we are going to get back up to the top of the range and then sell off again. I’m expecting price action to continue to get pinched between the top zone and the 50-Day EMA. There will be some volatility once we get to a point where that wedge converges. It’s really hard at the moment to make a call which way that will go with the RSI sitting near the midline. The bias at the moment is bullish, but only just barely.
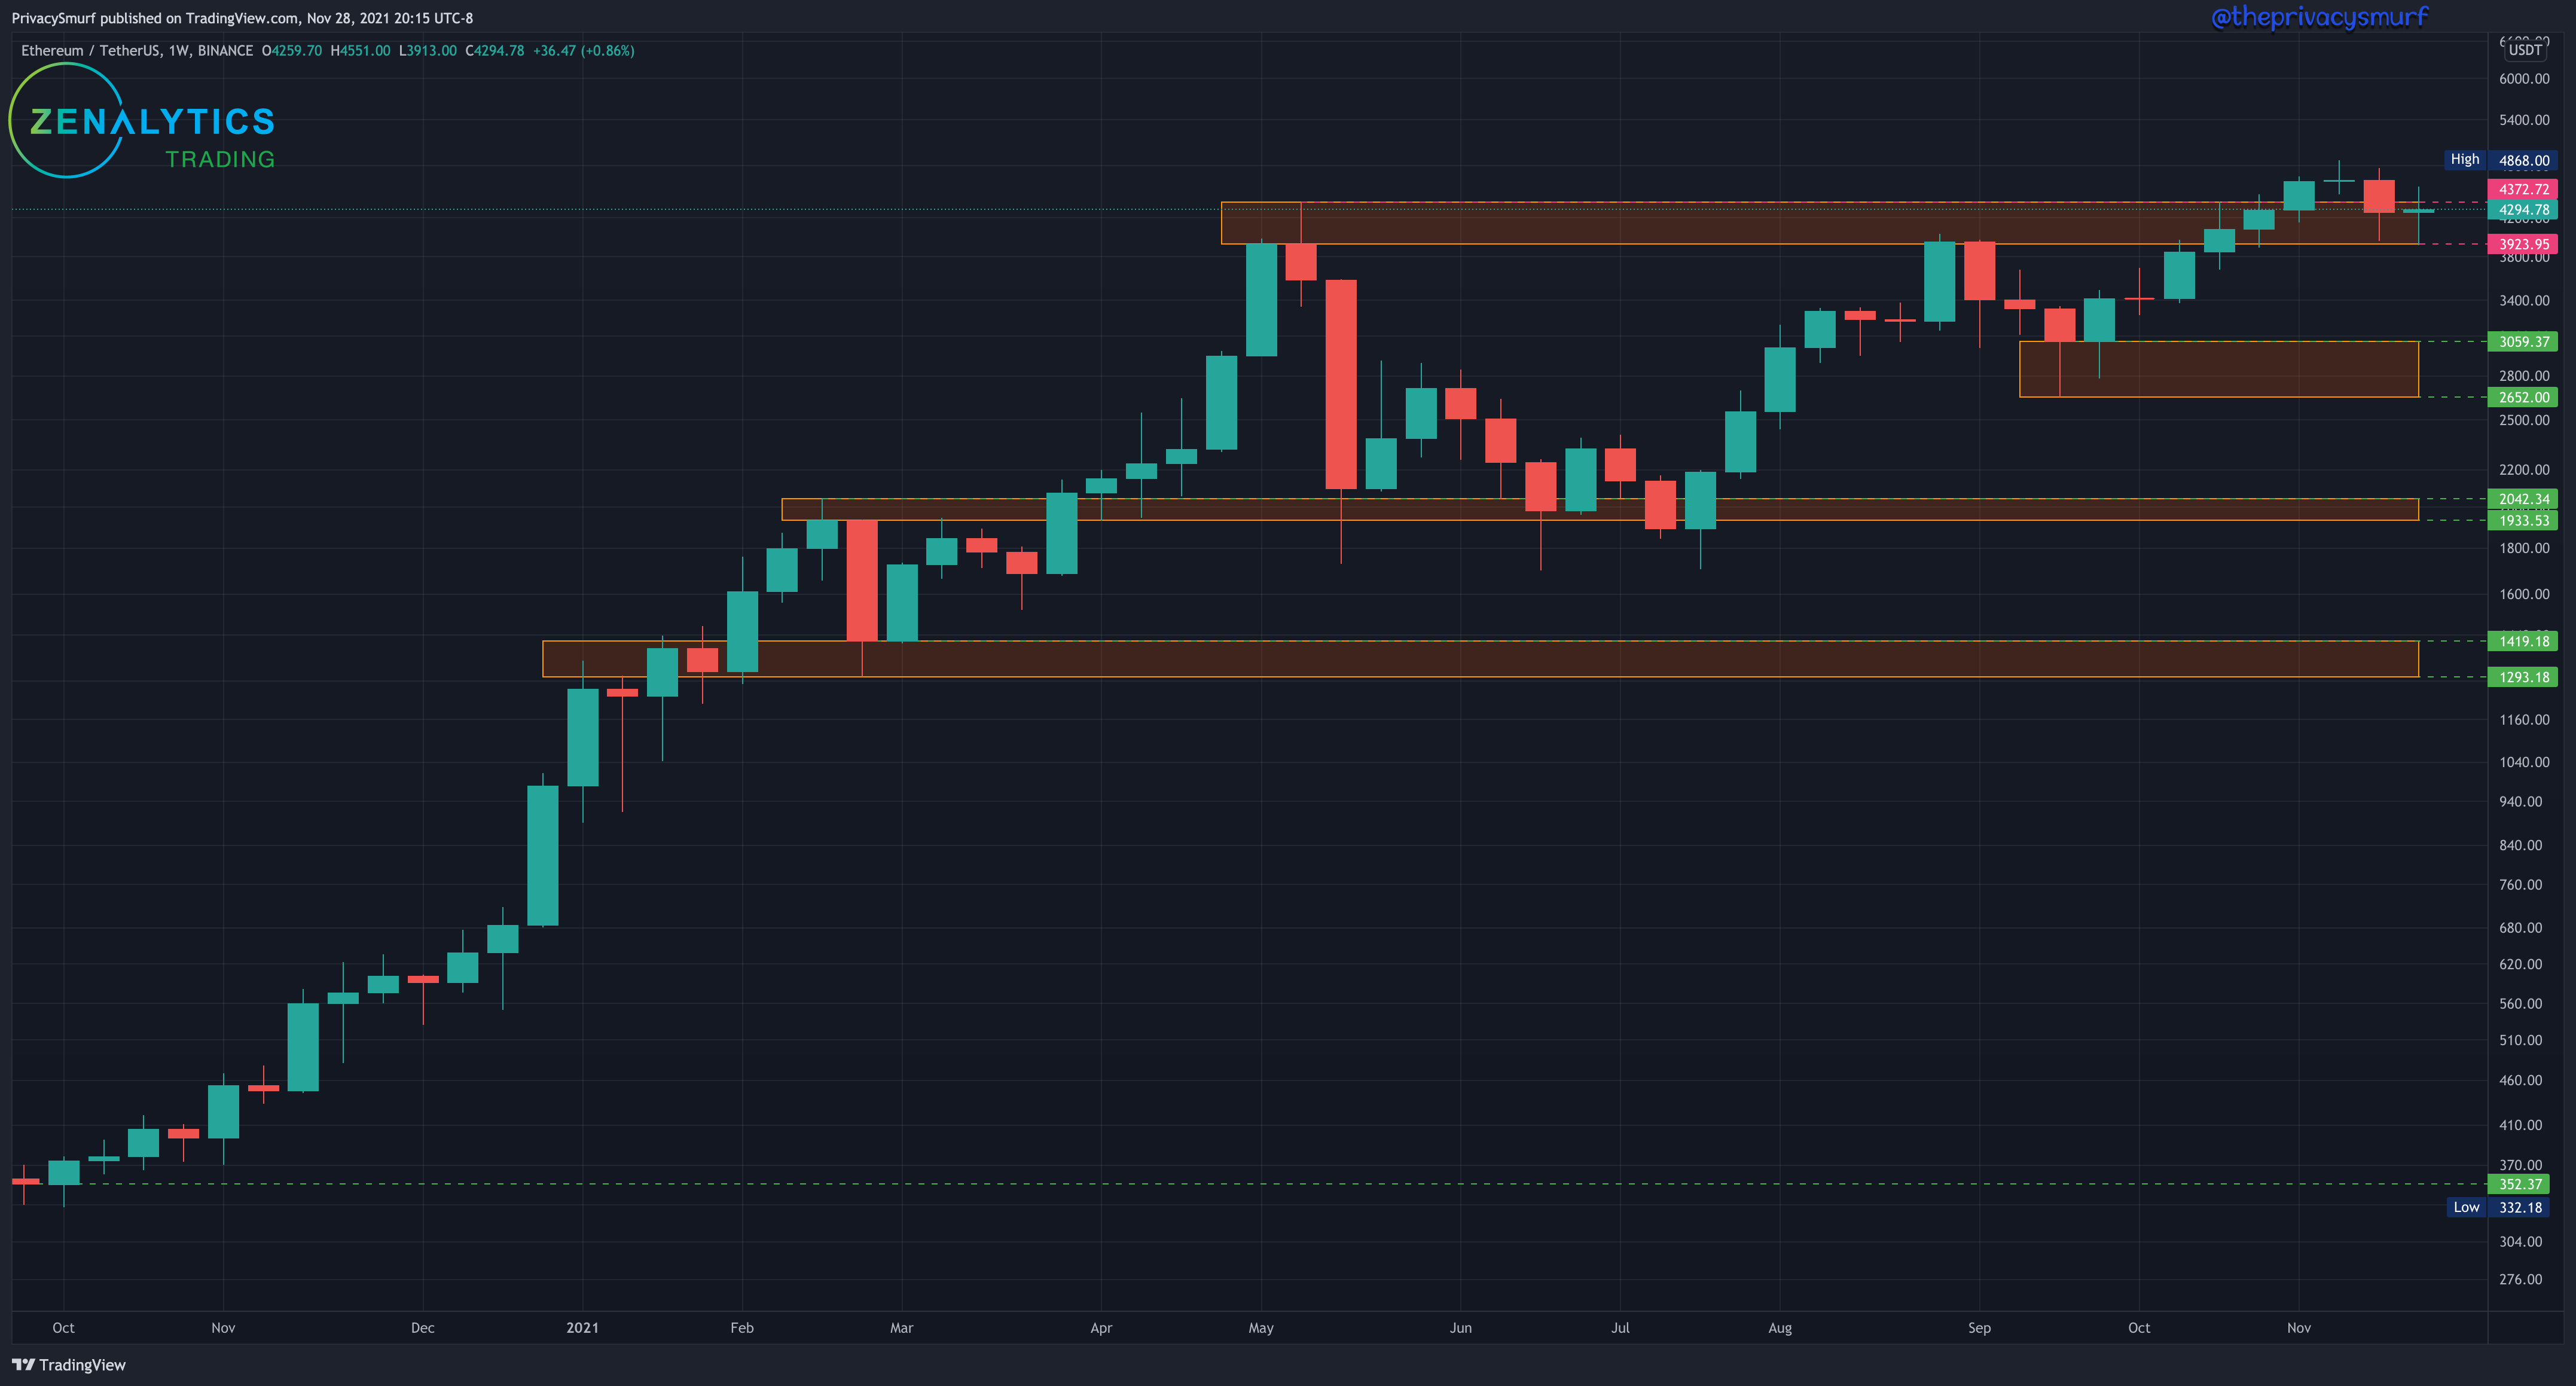
ETH/USDT ← chart link
ETH on the weekly chart is showing indecision with this Doji candle, which is when the open and close take place near the center of the candlestick. The market structure is still bullish. If we want some more insight than that we’ll have to look closer into the daily chart to get an idea of what to expect for the next week.
The 50-Day EMA is holding up to prices plunging below it. That’s a promising sign. We also have a similar picture to BTC on the left side of the chart. The accumulation under the 50-Day EMA in late September holds a slight resemblance to what we are in over the last two weeks. The RSI is increasing but the adaptive bottom band is just below the RSI and breaking below may pair with a decline in prices. I wouldn’t expect prices lower than $3700-$3900. My bias is still slightly bullish with this consolidation but I’m not anticipating prices over the all-time high yet.
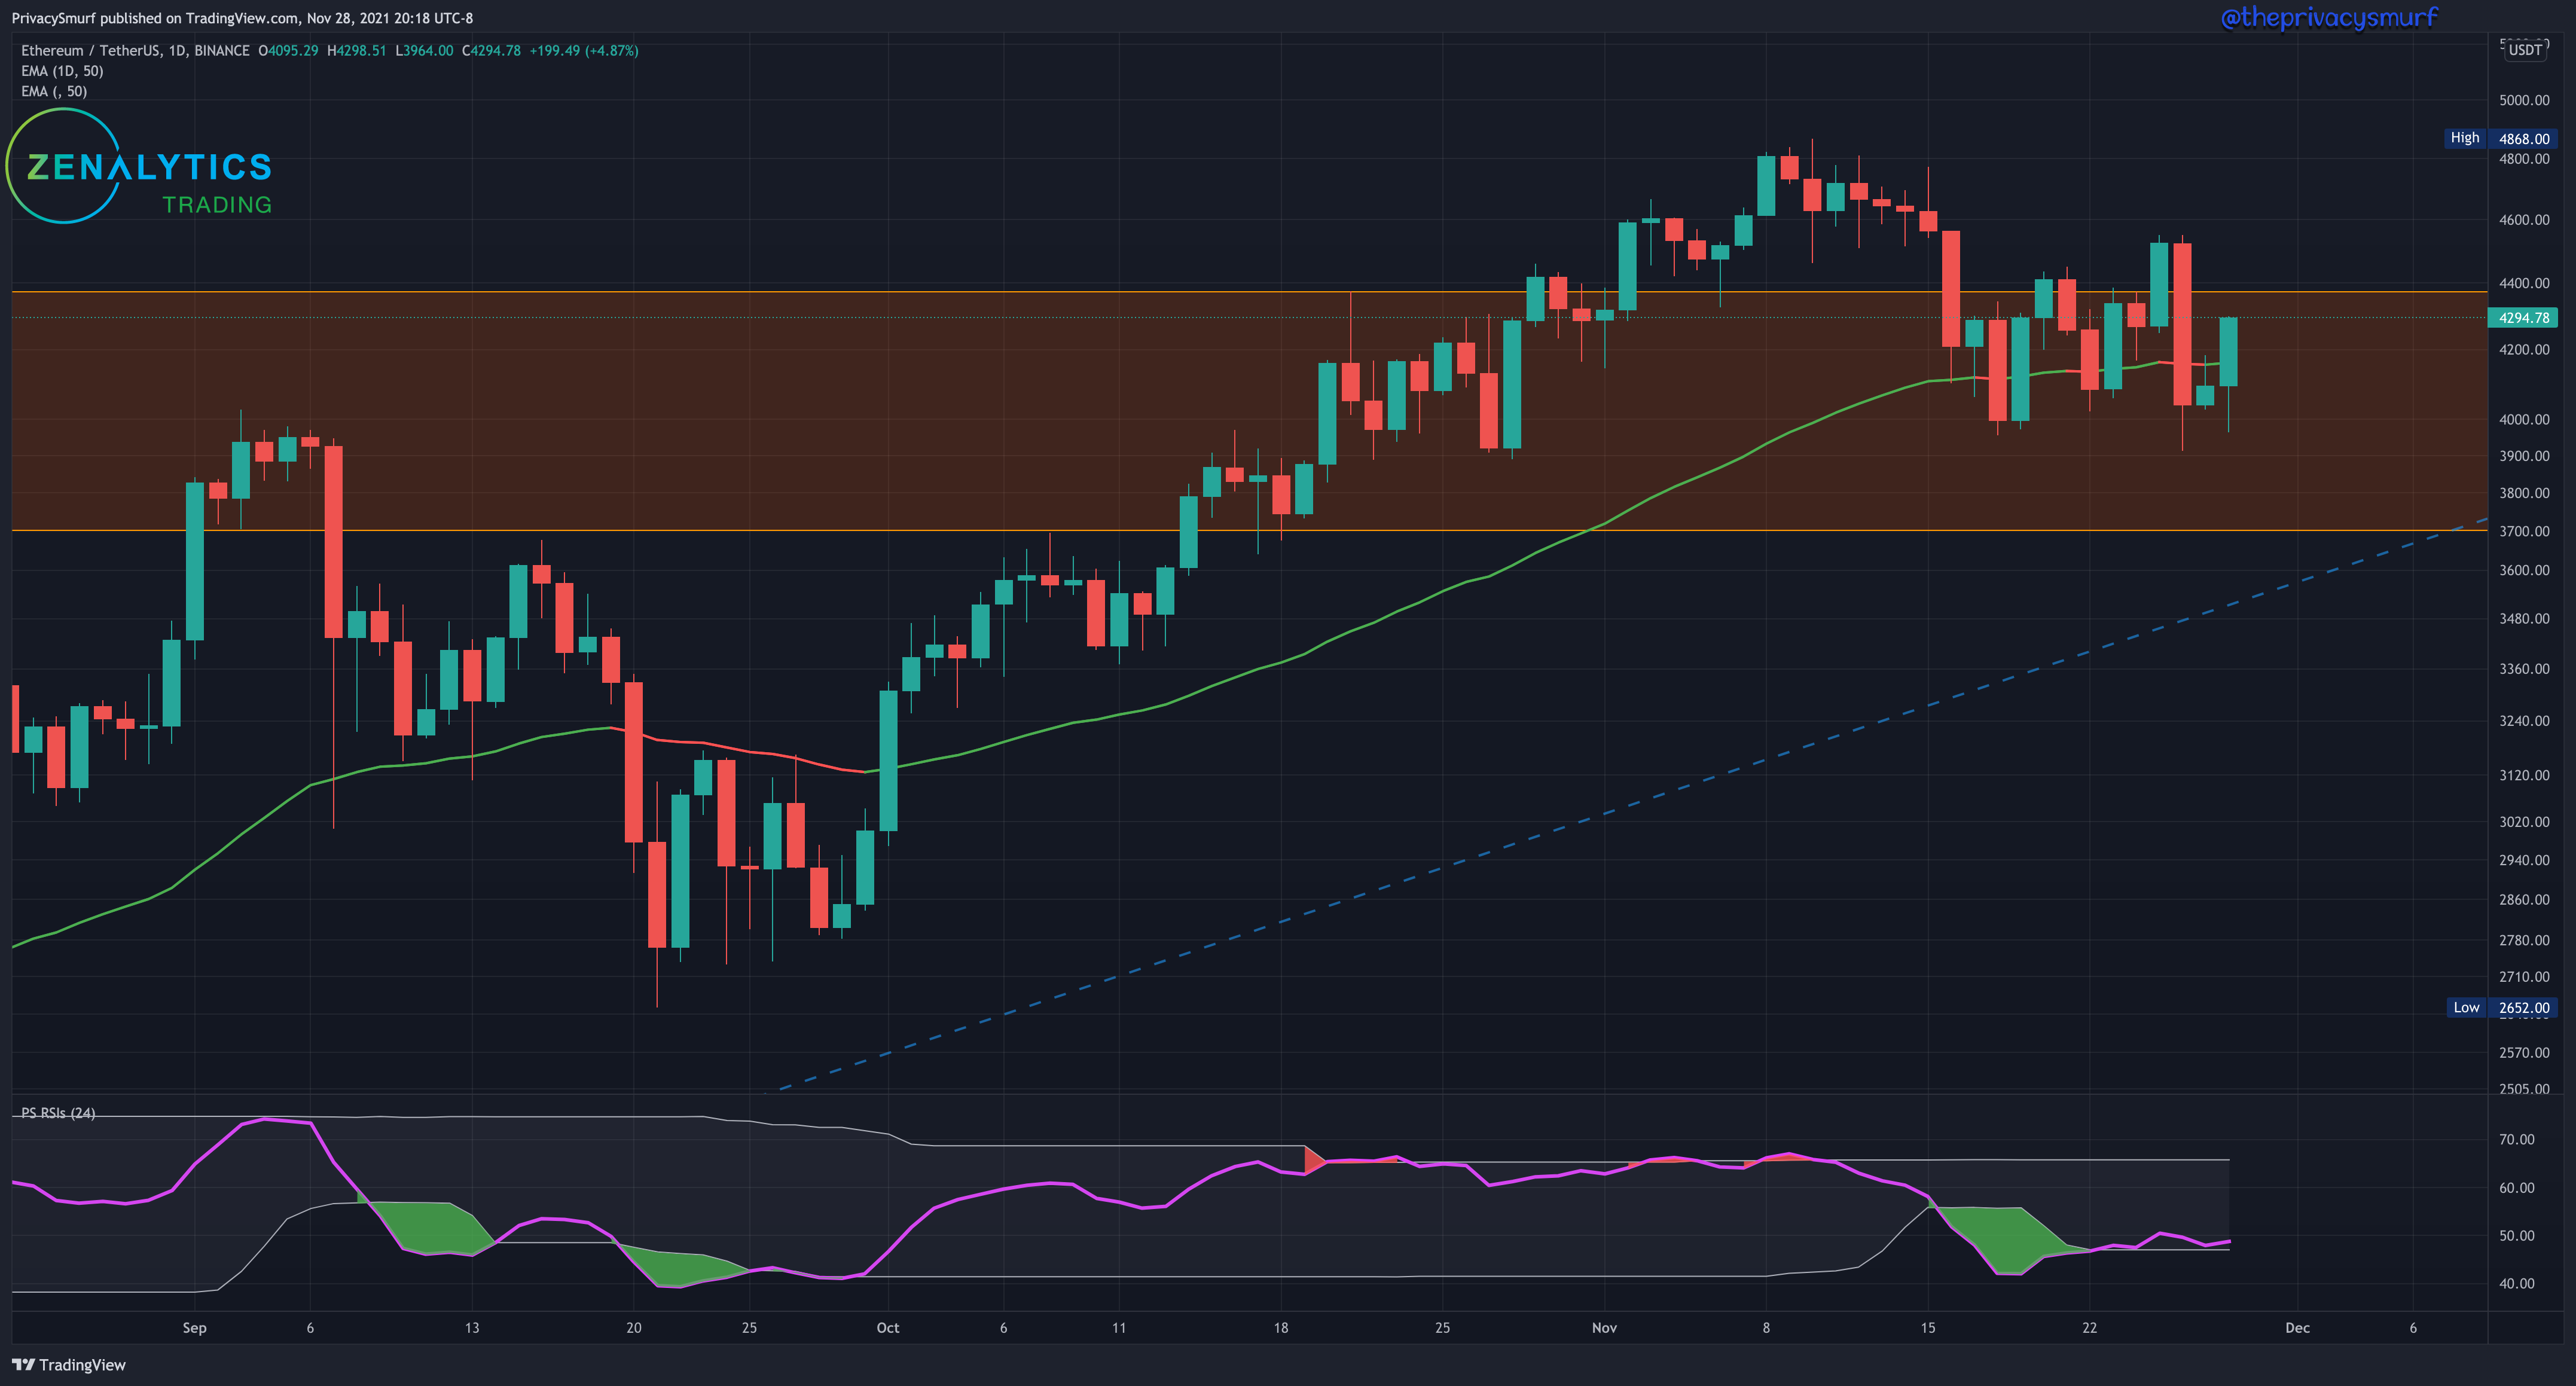
Something to keep in mind when looking at this chart is also the ETH/BTC relationship. If BTCUSD goes down and ETH/BTC stays stable, ETHUSD is likely gonna go down as well. If ETH/BTC breaks its ceiling ETHUSD is gonna run ahead of BTC and likely will be getting into price discovery, BTCUSD at this point may also be going up, but it could also be stable. Keep an eye on all these charts throughout this week.
Over the holidays and the past week, I’ve sorta let the Crypto Money Fountain chart get a bit outdated. I’ll clean it up and post it and some comments along with the Micro Monday paid subscriber post tomorrow.
I originally had the Black Friday annual subscription sale going until midnight tonight but I completely forgot about Cyber Monday so I’ll extend the sale for 24hrs if you haven’t gotten in yet. There will be some changes coming in the next year and the free posts will be quite outnumbered by the paid content so I’d suggest you upgrade to the paid side now while it’s still cheap. You won’t regret it.
See you tomorrow!
@theprivacysmurf