

Sunday Synopsis #22: It's a wrap...
Sunday Synopsis #22: It's a wrap...
I guess I'm not immune from writing clickbait titles either. Oh well.


No, that title doesn’t mean what you think it does. I’m listening to my Spotify Top Songs of 2021, the “2021 Wrapped” playlist. It’s pretty awesome but damn I’m annoyed. My number 5 top song freaking sucks. I have a playlist that I call my “grooves of ‘insert time here’ playlist” which is constructed from random stuff I hear from time to time that just gets my foot tapping and head nodding and have to stick on repeat for a while. So often I pop on this playlist when I’m doing some creative stuff or coding and start somewhere near the end because those are the types of jams that I’m most recently digging. I’ve had Spotify for years and years and this particular process is just part of my day-to-day. I put the playlist on “repeat all” so I don’t work away in silence when it ends because I’m weird and I do that sometimes when I’m in the zone. It’s like I don’t even notice the music stopped. Anyways, turns out I must have used this playlist a lot this year because my number 5 top song is the first song on this time-sensitive groove playlist and gets cued up when the “repeat all” kicks in. Honestly, the song kinda sucks to me at this point in time and I always just skip it, but I can’t bring myself to remove it from the time-sensitive groove playlist because, ya know, as I said above, I’m weird and it’s got history, it speaks to who I was at one point in time, someone who obviously was having a mental break to think the song was a good jam. Typically my wrap-up playlists are awesome and I’m bummed this one is ruined but what can ya do? It’s on my playlist “blockchain” now and can’t be removed (to keep things topical).
(ノಠ益ಠ)ノ彡┻━┻
Sorry for that huge aside. It’s not that big a deal though because honestly, we all know the market died this week and there’s not a lot of great analysis to be had, but still, let’s get to it.
BTC/USDT Weekly Structure
https://www.tradingview.com/chart/4v8qizyI/
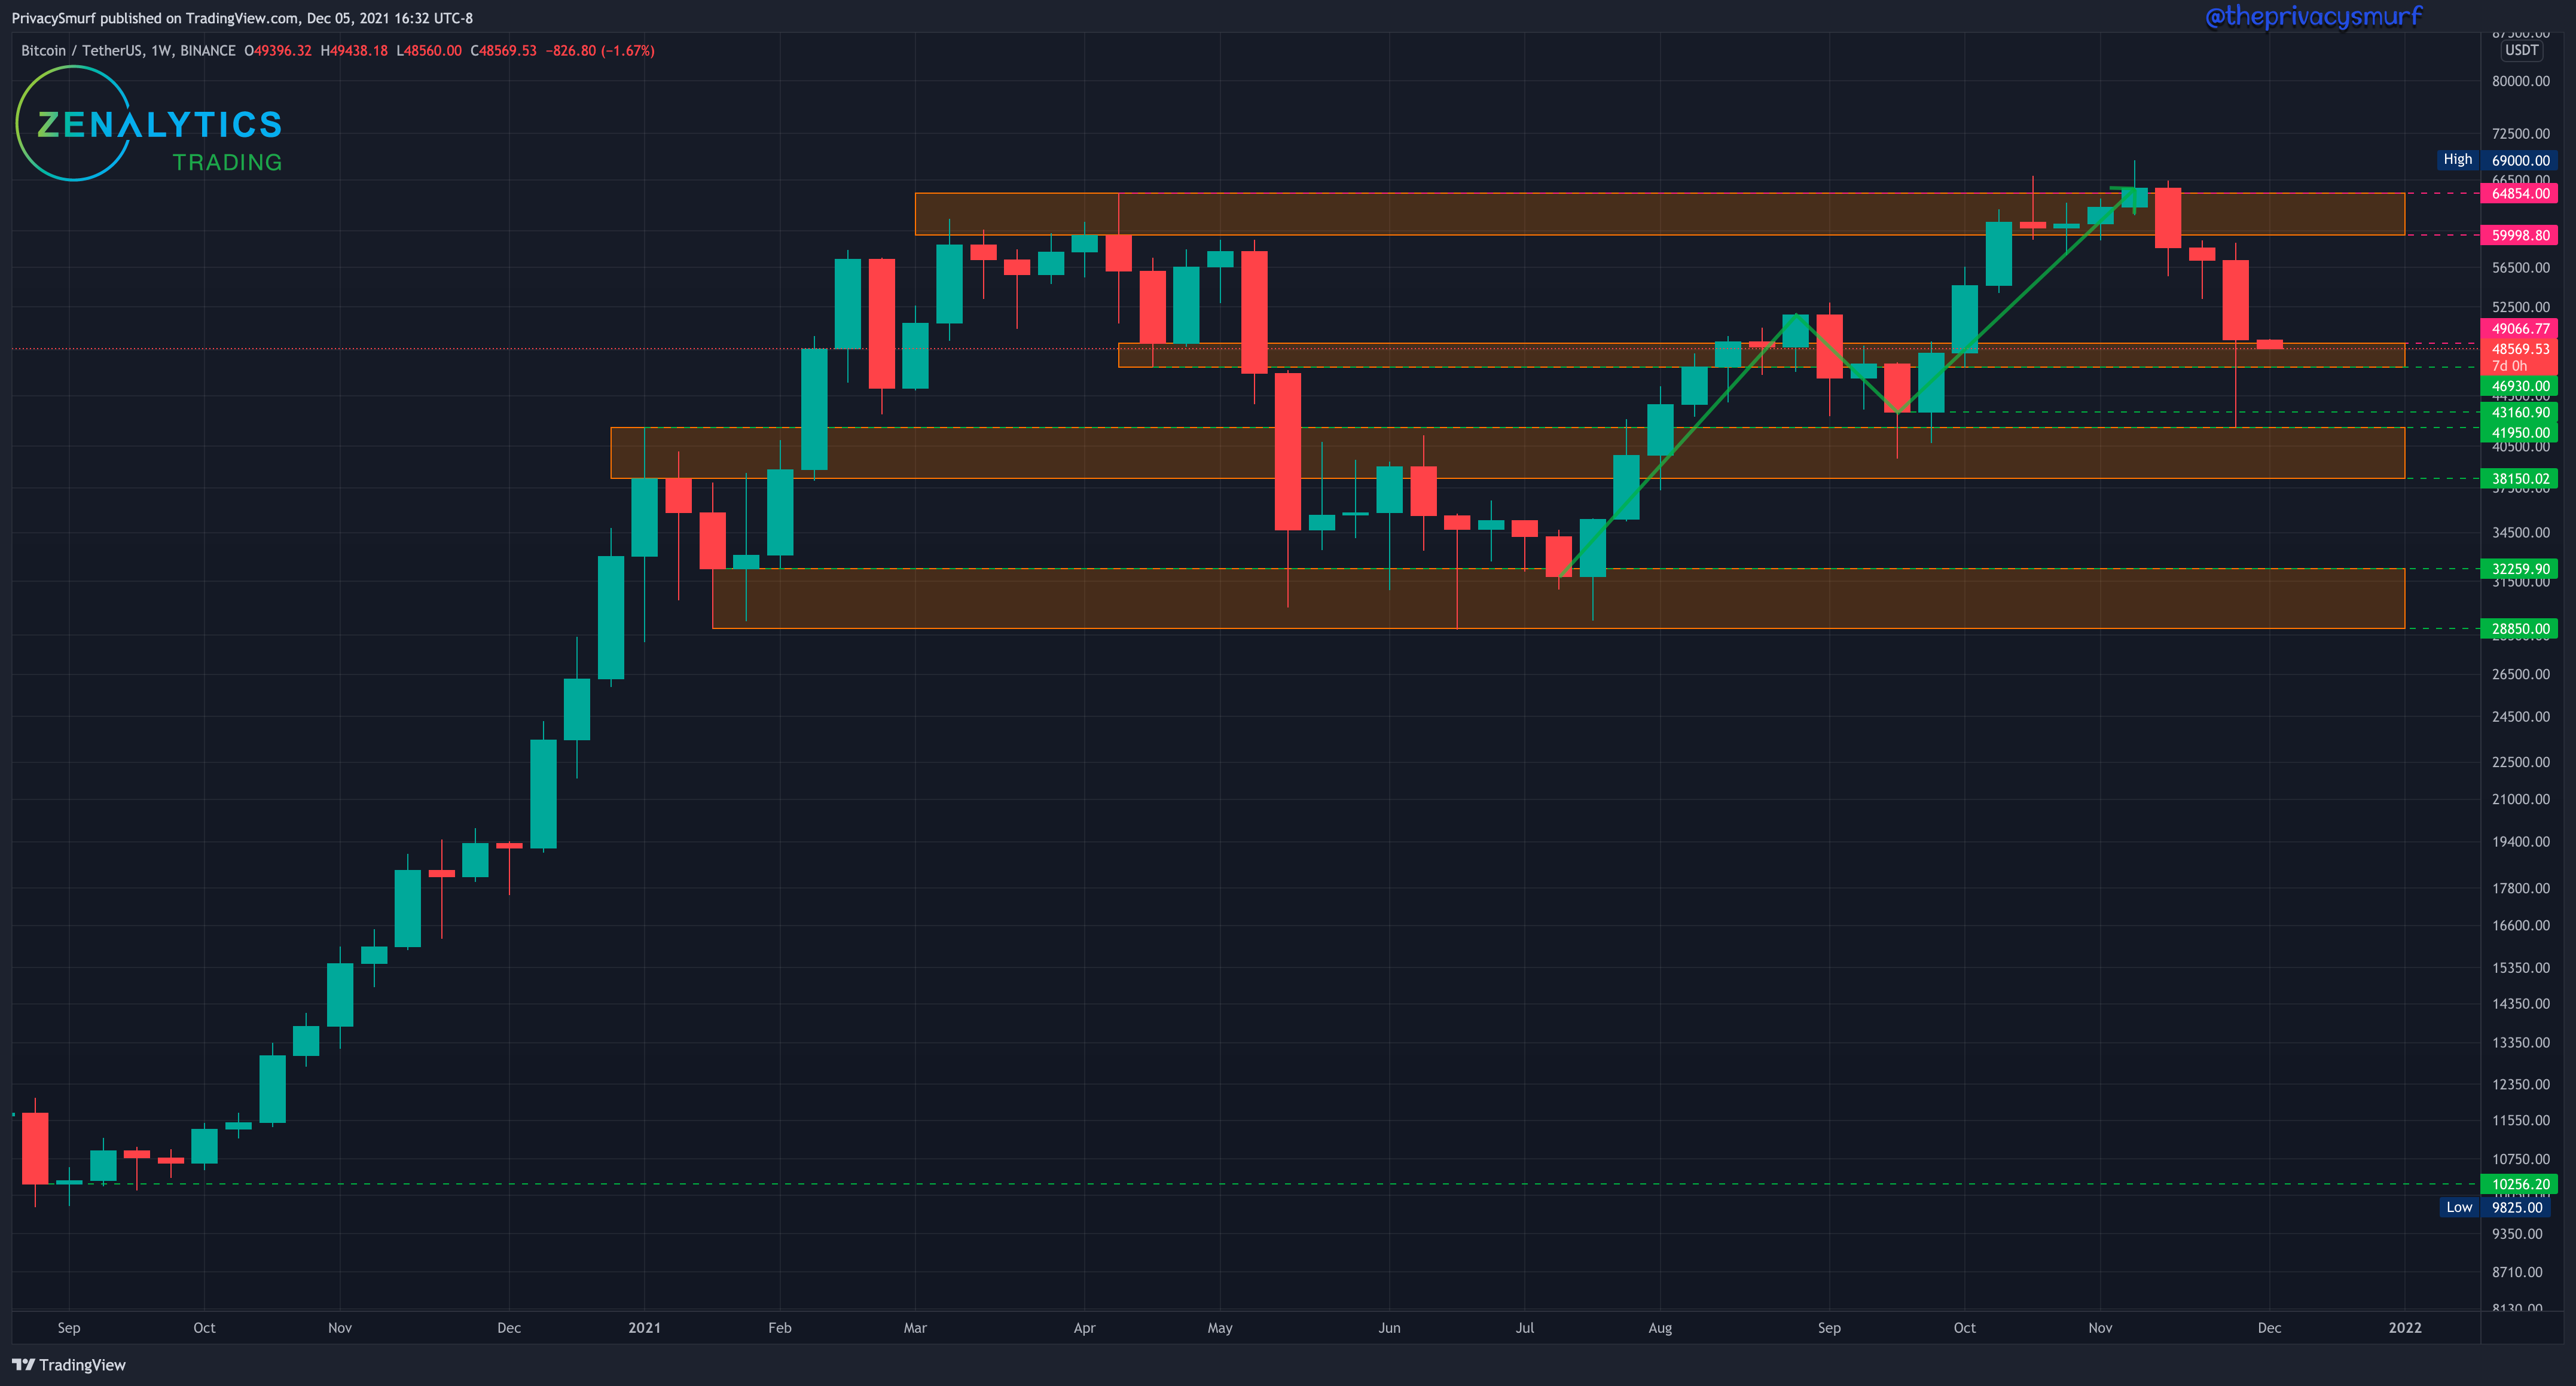
We had a rough week but prior market structure support was held as price closed above it and the bullish trend on this timeframe is still intact. If this new weekly bar closes below $43160 the bullish trend shown by the lightning-shaped arrow will change from a bullish trend to bullish consolidation. The long wick is worrisome because often those prices are revised but we’ll need to look at the daily chart to get a better idea of what’s in store.
BTC/USDT Daily Chart
https://www.tradingview.com/chart/jjSdFW4b/
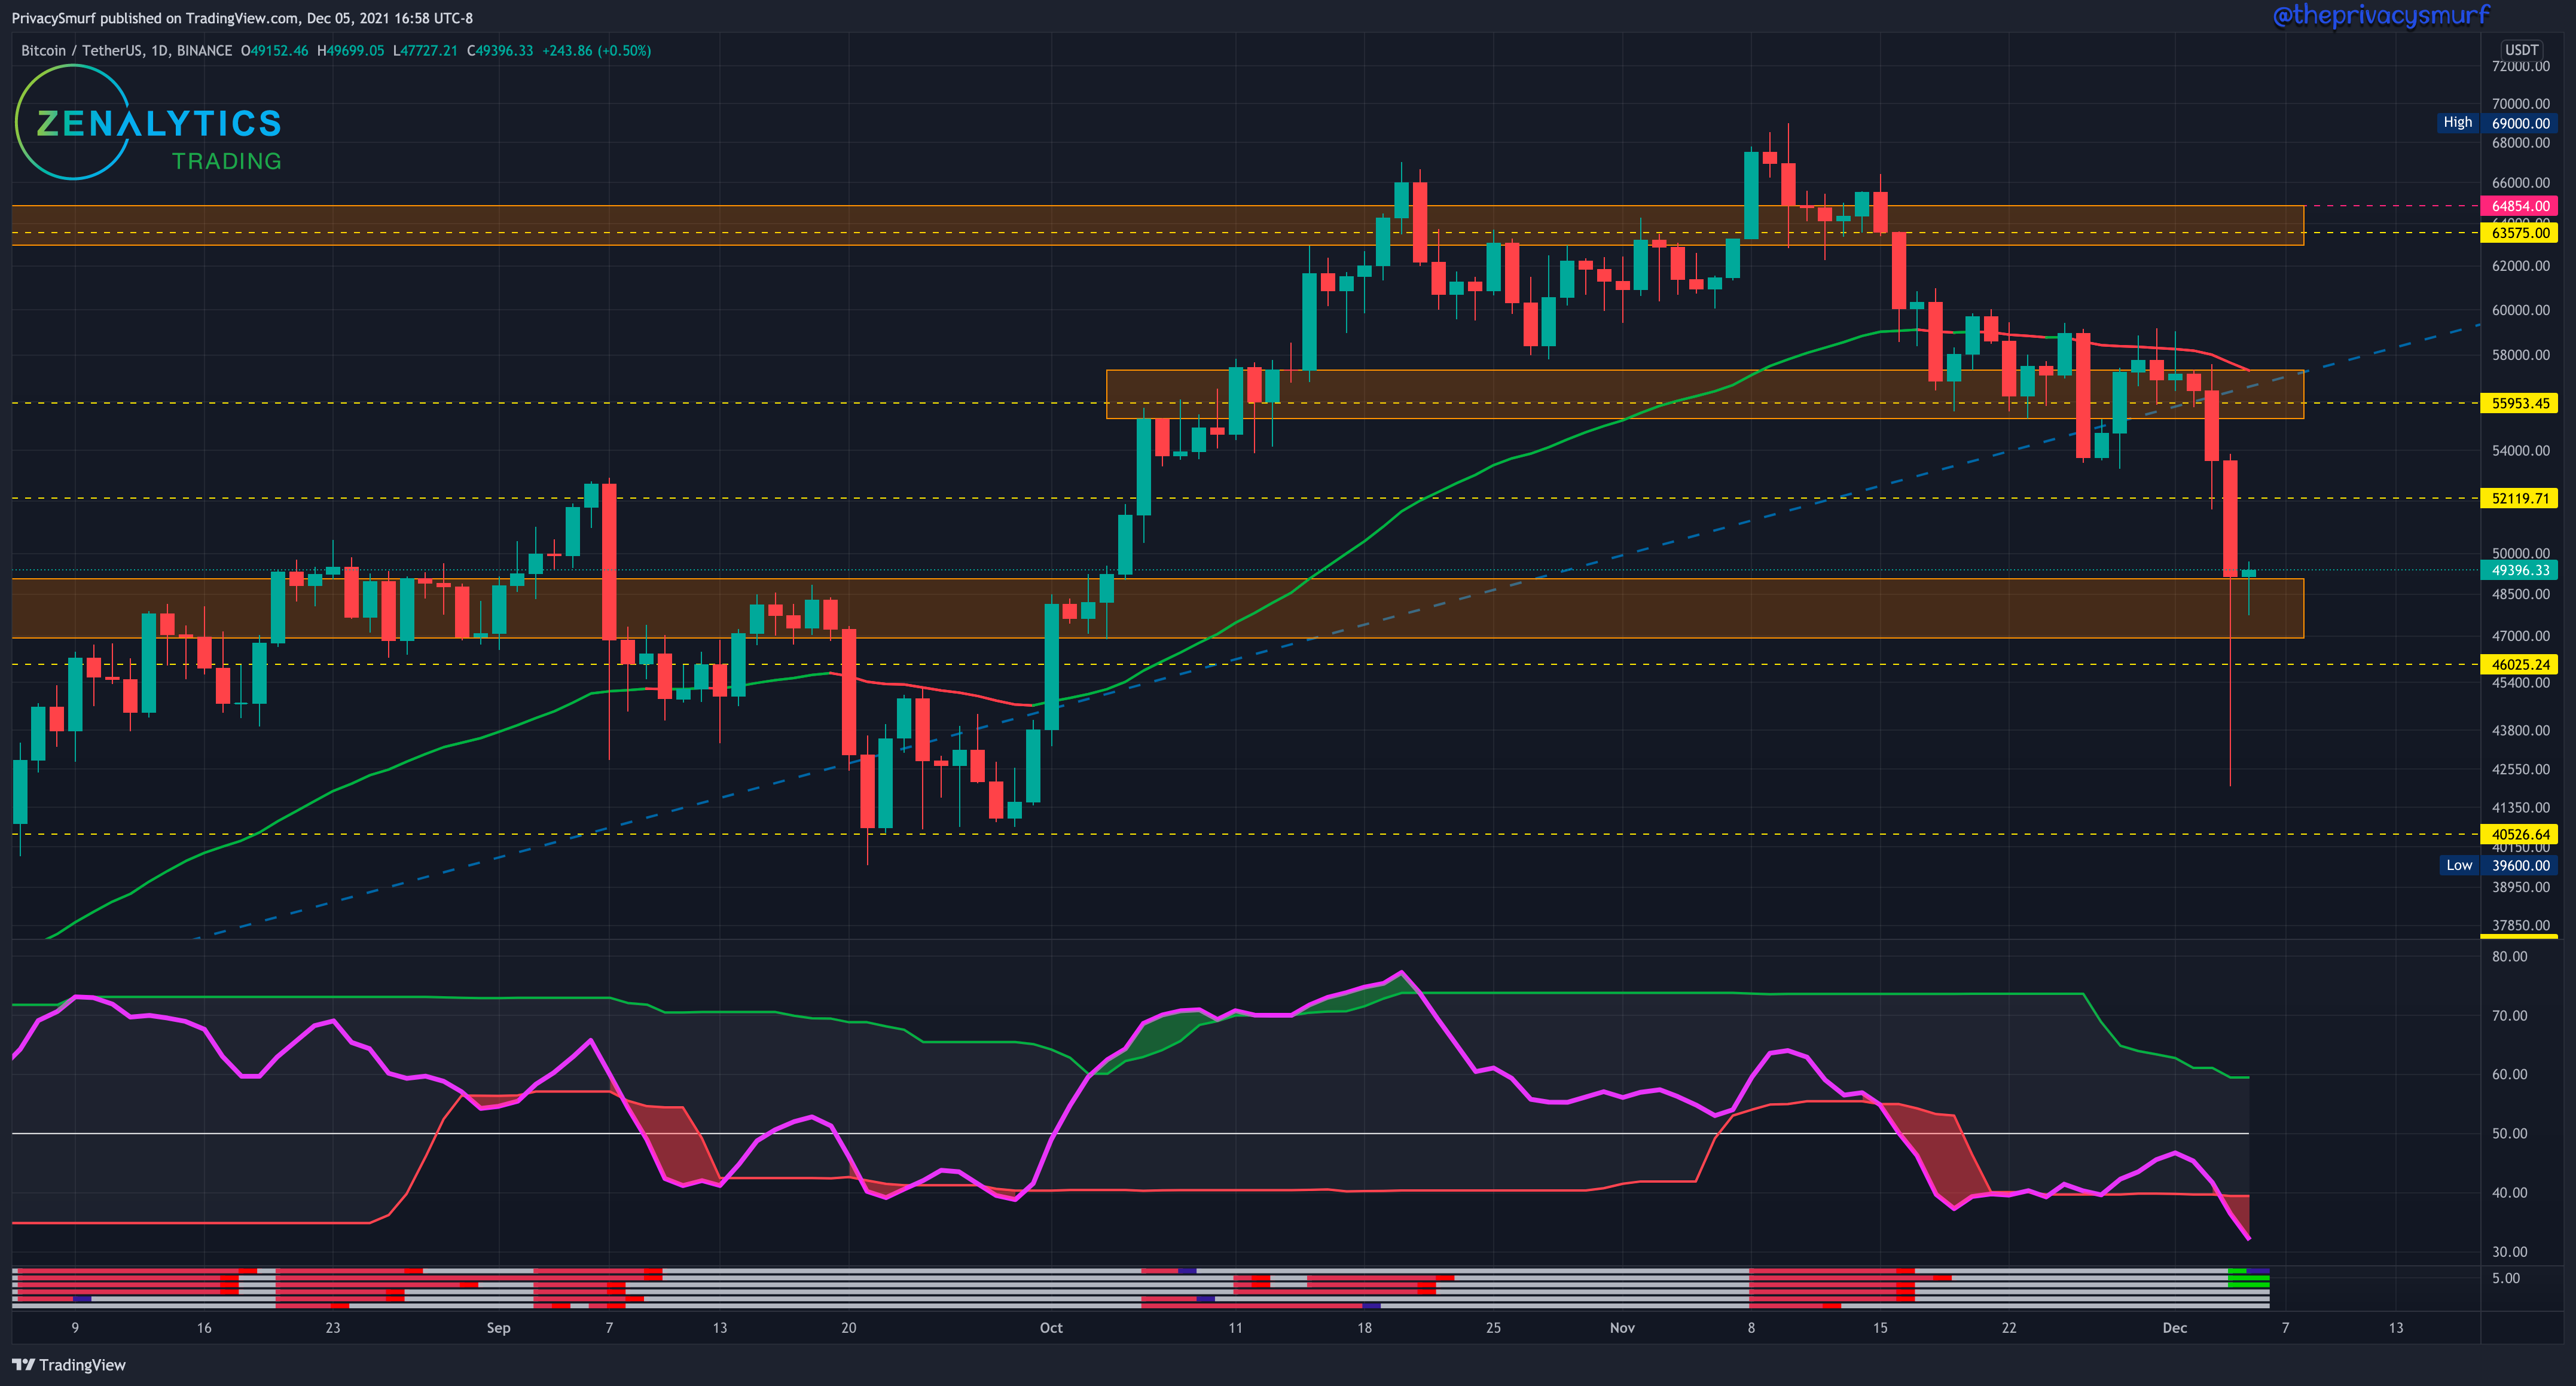
Here we see the ascending trend line that has held up for BTC for months has failed. The post I made last week warning of the failure from the ascending wedge played out. The correction went deeper than I expressed in last week’s posts. The support I was watching at $52k was held for a day but the ranging price action I expected to follow didn’t come to pass as the next day the selling pressure blew out the support and the liquidation floodgates opened. At the moment there is bullish divergence on at least one oscillator, indicated by my indicator at the bottom of the chart (PS Correction Strength Meter) There was divergence on 2 of the oscillators but the first was invalidated. Looking at the RSI being below the bottom band (oversold) and support zones and lines labeled on the chart it’s likely prices remain low this week, the failed support at $52k being the ceiling and $46k being the floor for the time being. There are possibilities of lower prices but I’ll address that in a post later this week as I’m monitoring the charts.
ETH/BTC Weekly Structure
https://www.tradingview.com/chart/sacHlXOv/
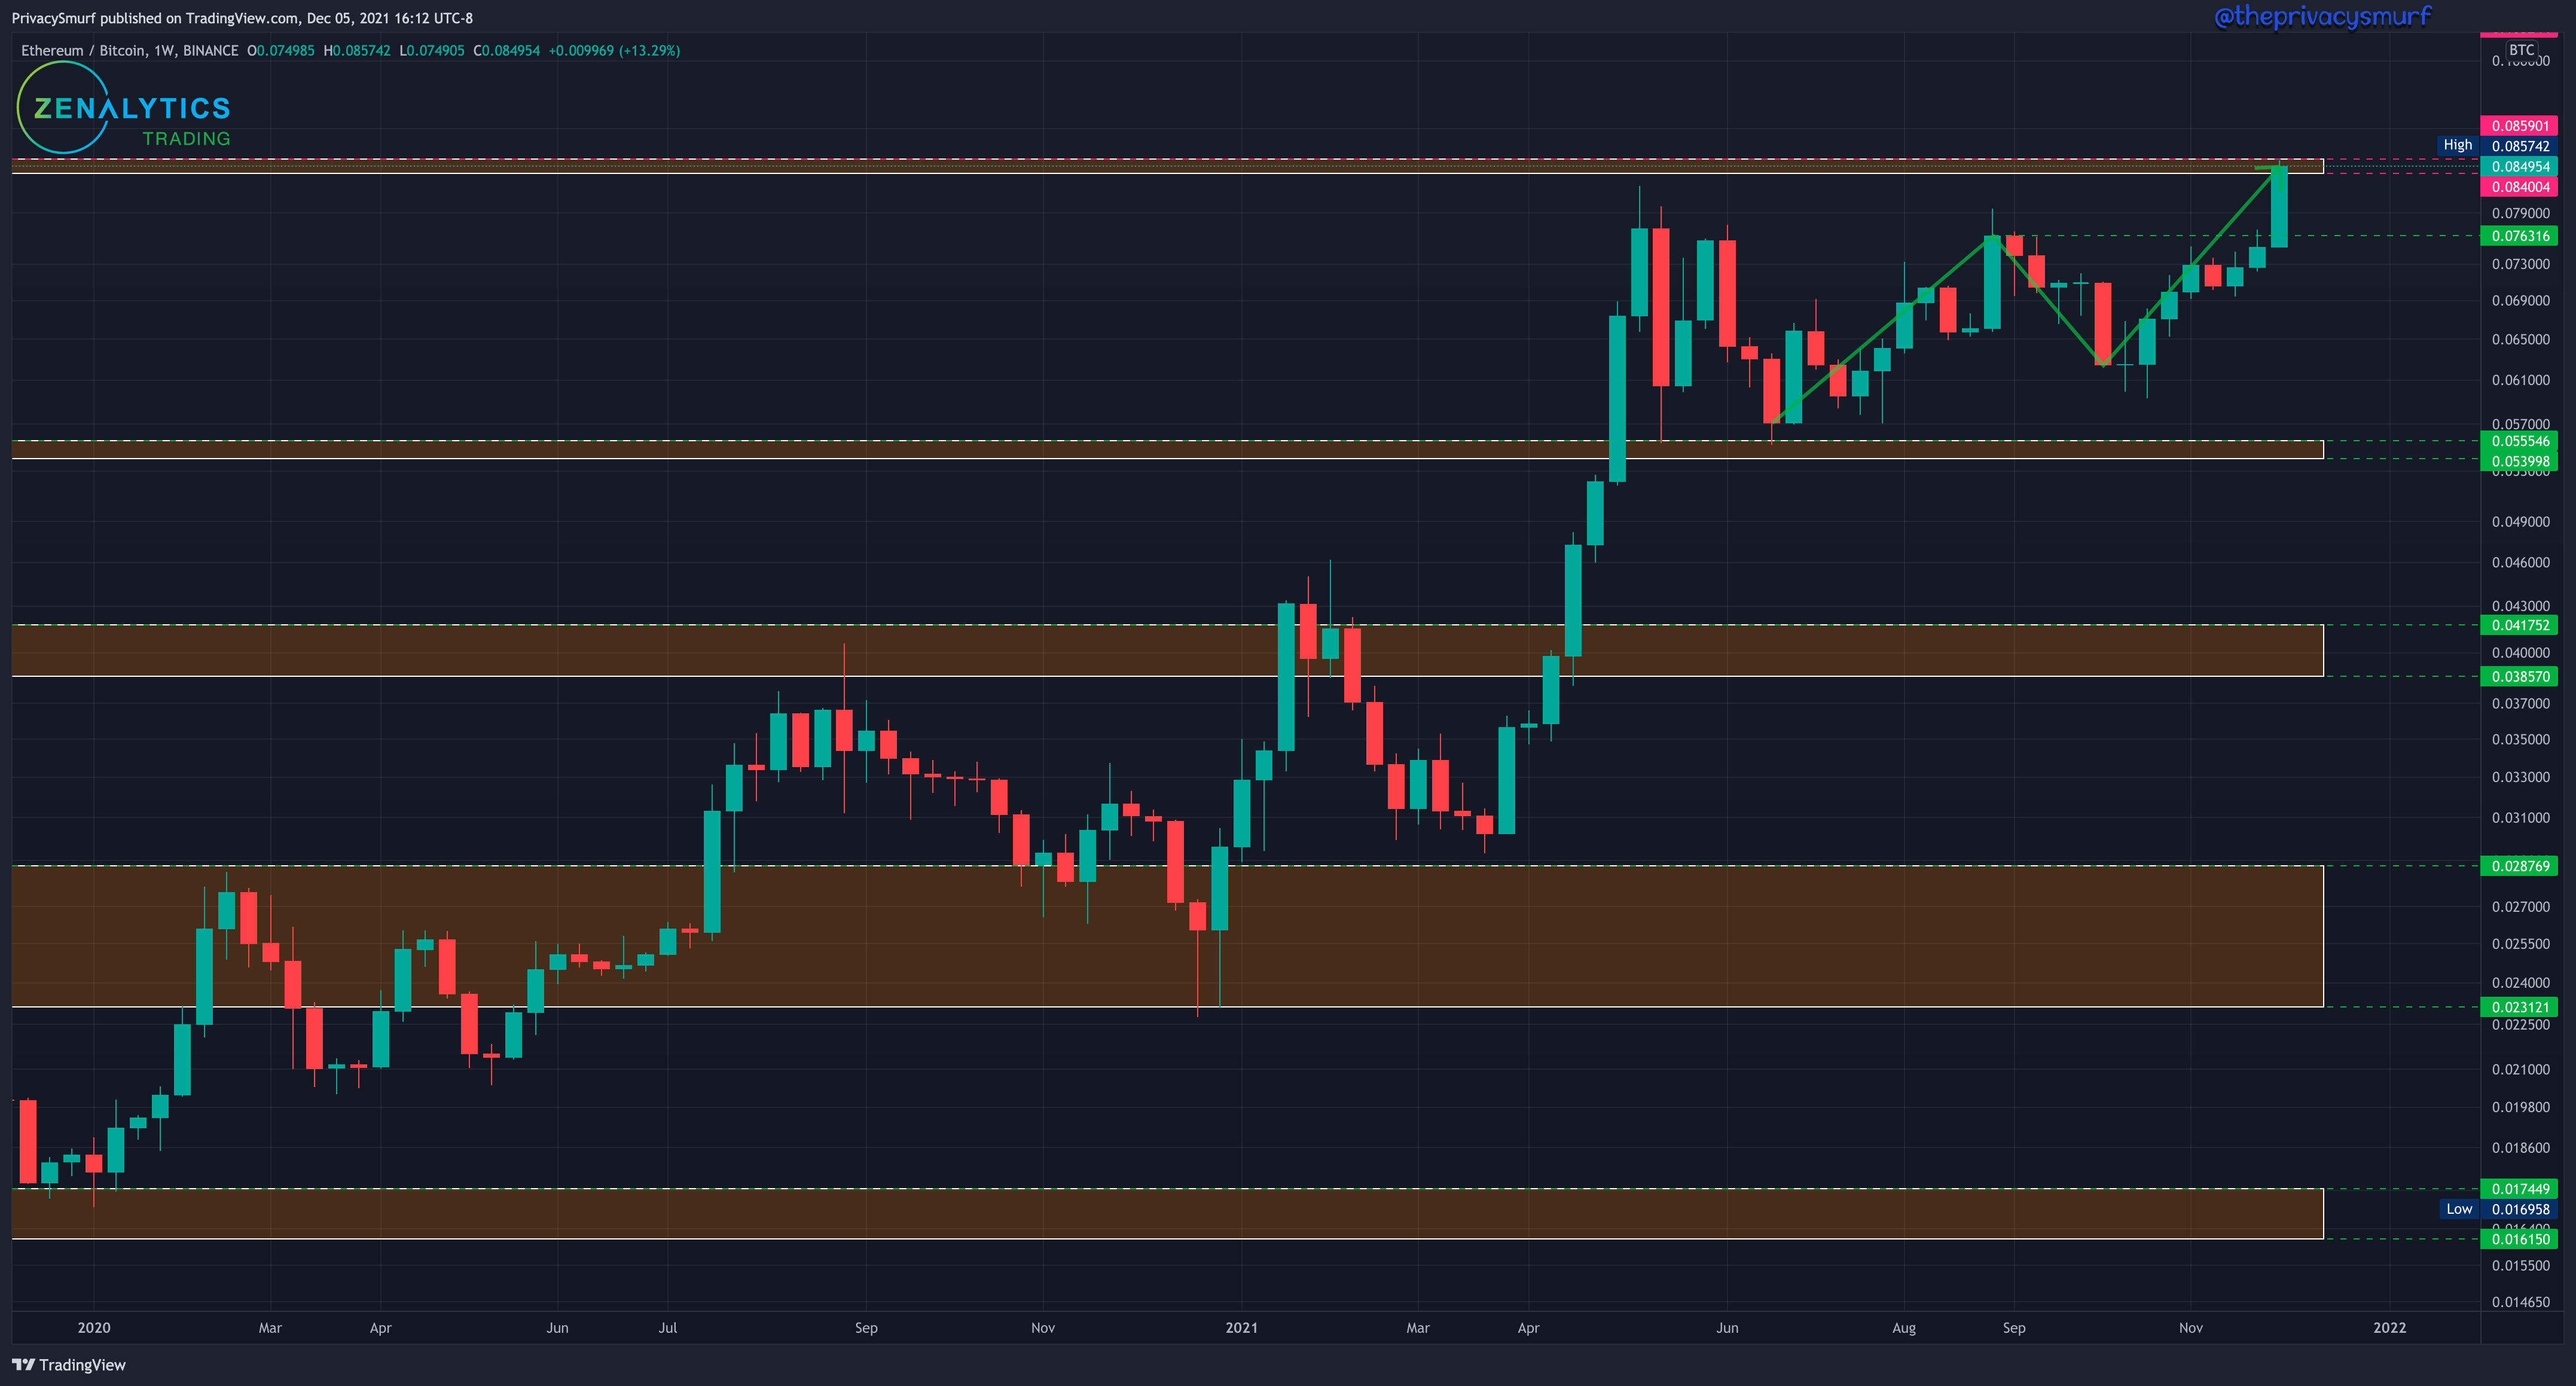
It’s been very interesting to see ETH relative to BTC performing so well. Closing the week above the .076 mark established a bullish trend annotated by the lightning-shaped arrow. It is still at a high resistance so it wouldn’t be uncommon to see a retracement to support at the prior resistance it just broke. It’s also unfortunate to see this value relationship because if BTC was not losing its shit and falling all over the place (See video of BTC here) ETH and subsequently altcoins would probably be having an awesome time. Regardless this strength will probably stick around when things settle down.
ETH/BTC Daily Chart
https://www.tradingview.com/chart/gTkSjkj6/
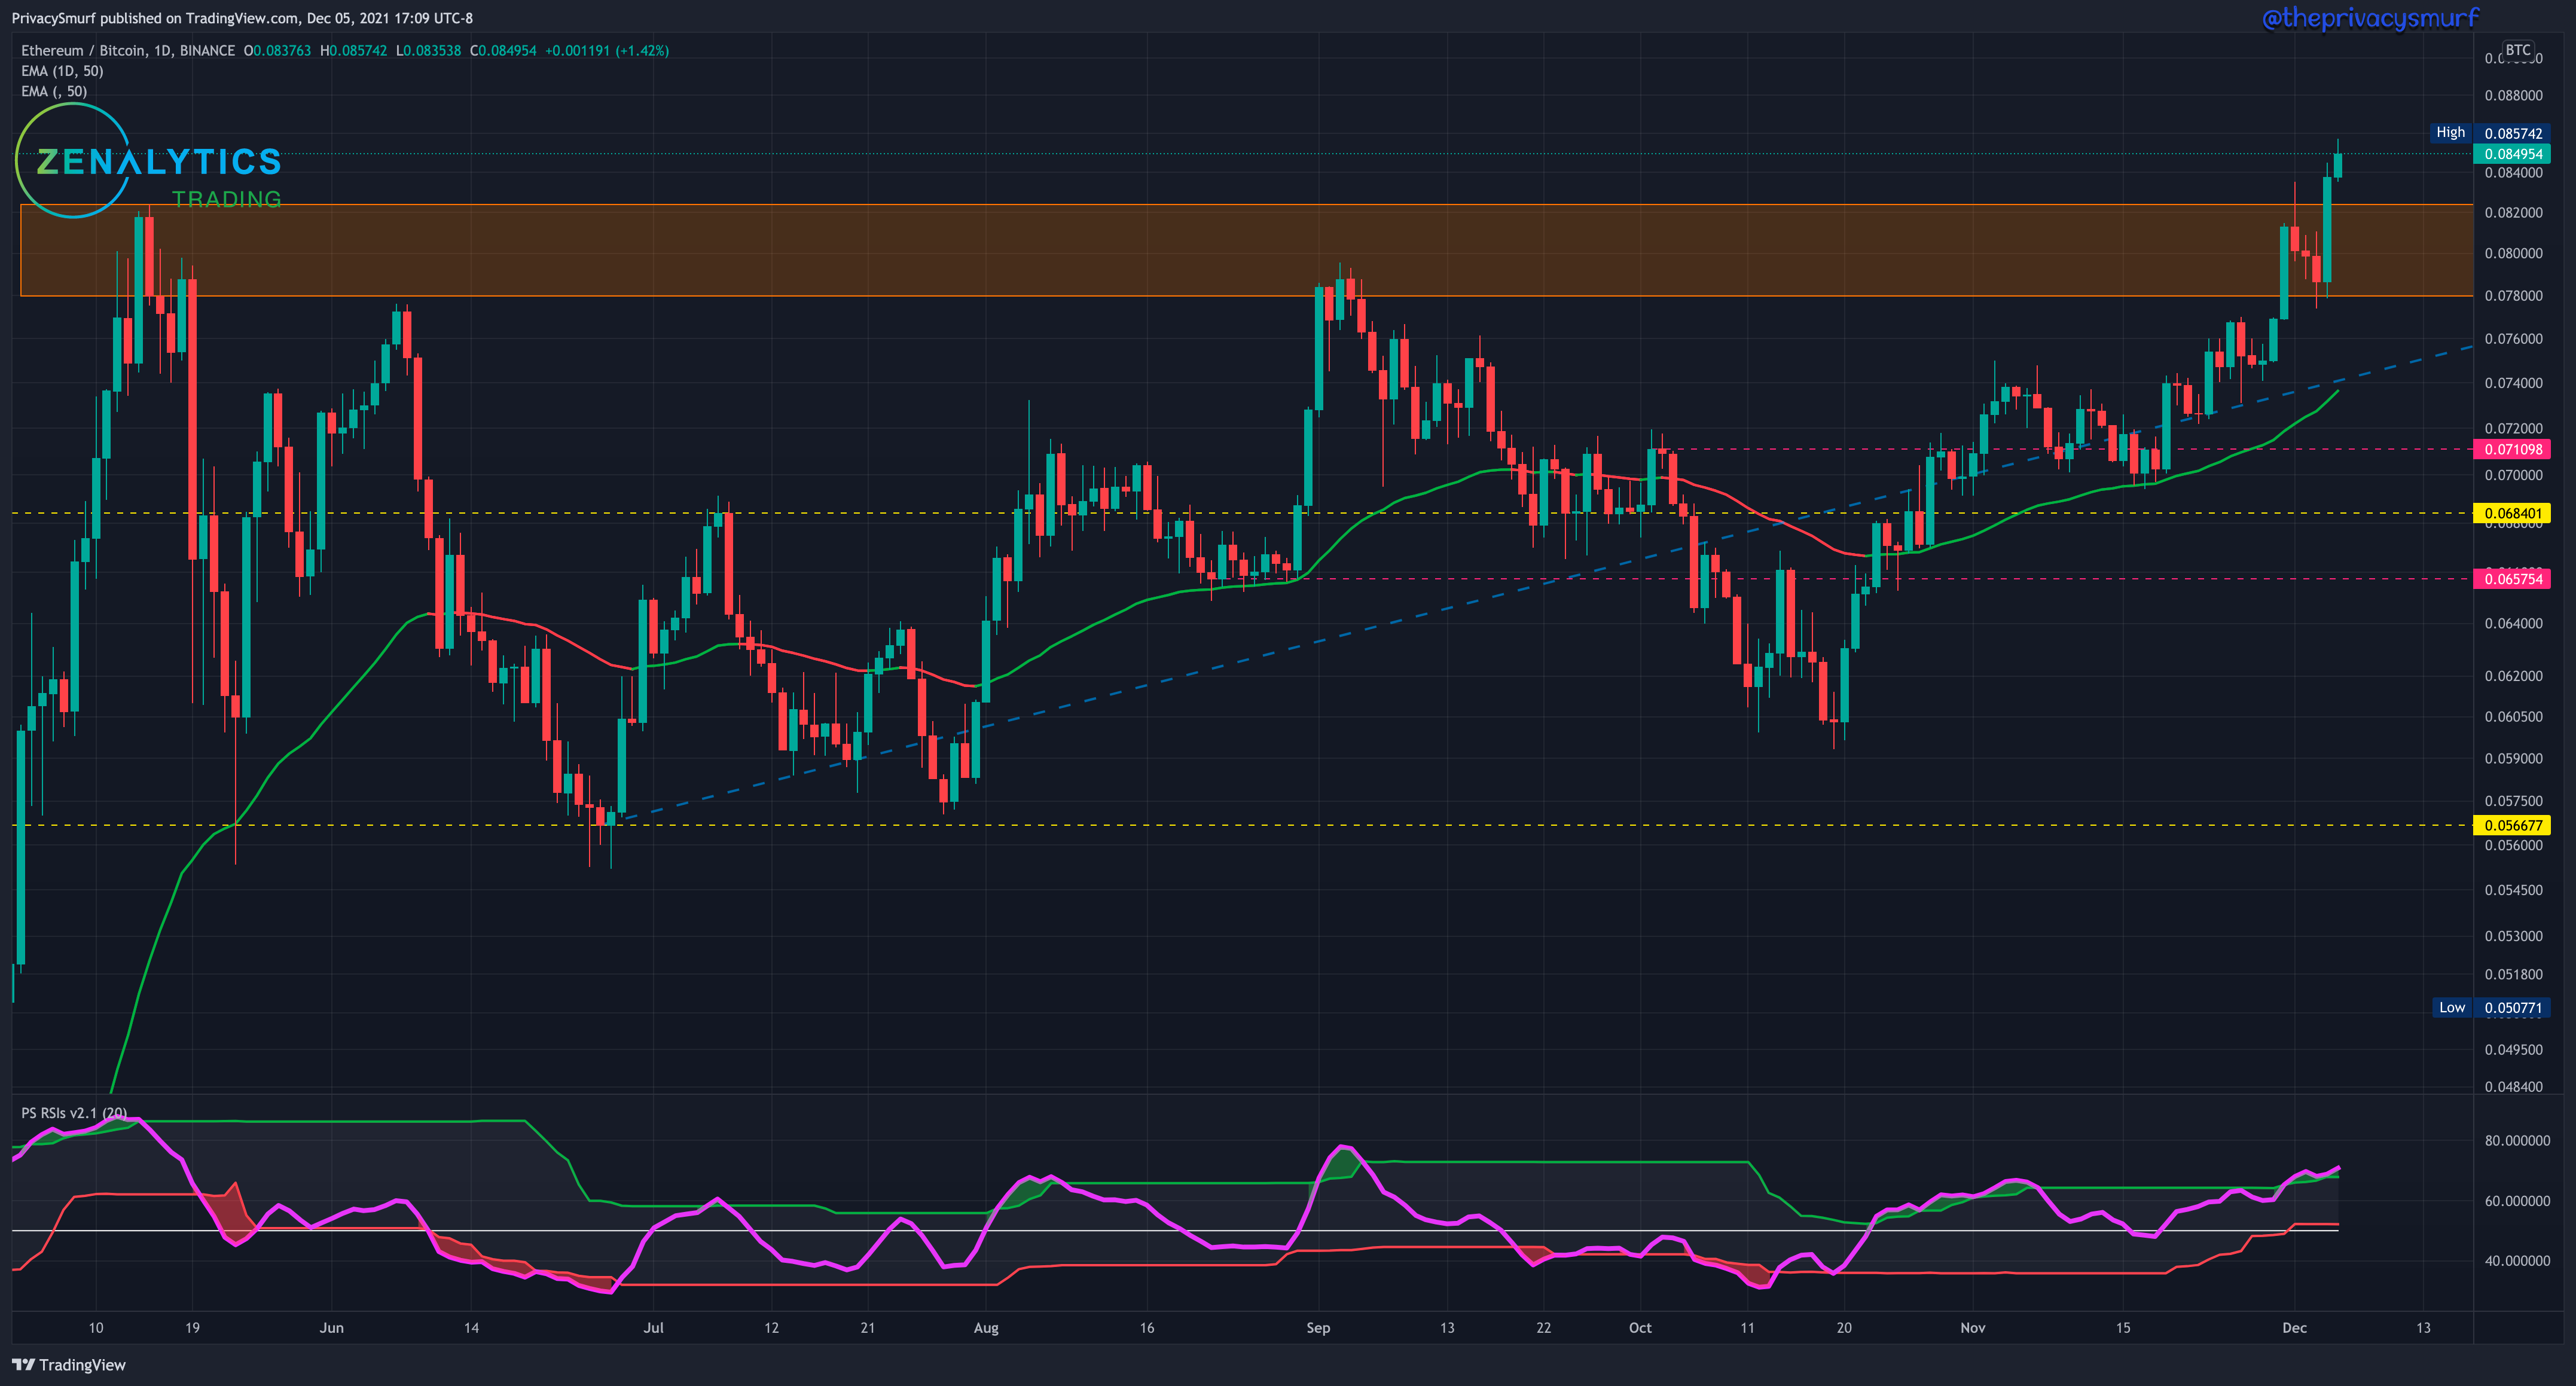
Here we can see the break of the high resistance pretty clearly. The failure at the resistance high leads to the test of the resistance low and a follow on big break of the high. With the RSI breaking above the top band there is likely some gas left in the tank for a few days but a retest of support will eventually come. The range high support is where I’d be watching but wicks may punch back into the zone. Worst case scenario the 50-Day EMA and the ascending trendline I expect to be a stable floor. ETH is presenting strong relative to BTC. A short-term rotation of BTC for ETH wouldn’t be the worst choice to make but doing so on a support test would be better as it’s looking like ETH will outpace BTC in the near future.
ETH/USDT Weekly Structure
https://www.tradingview.com/chart/JPTp0aXw/

ETH experienced the same retracement as BTC but not nearly to the same extreme. That’s a great thing for ETH. The weekly bullish structure is still intact annotated by the green lightning-shaped arrow. It would take a weekly close below $3059 to shift away from the bullish trend. I suspect there will be another ranging week here in this top resistance zone. The daily picture may help determine if that’s likely.
ETH/USDT Daily Chart
https://www.tradingview.com/chart/xbB6lkZu/
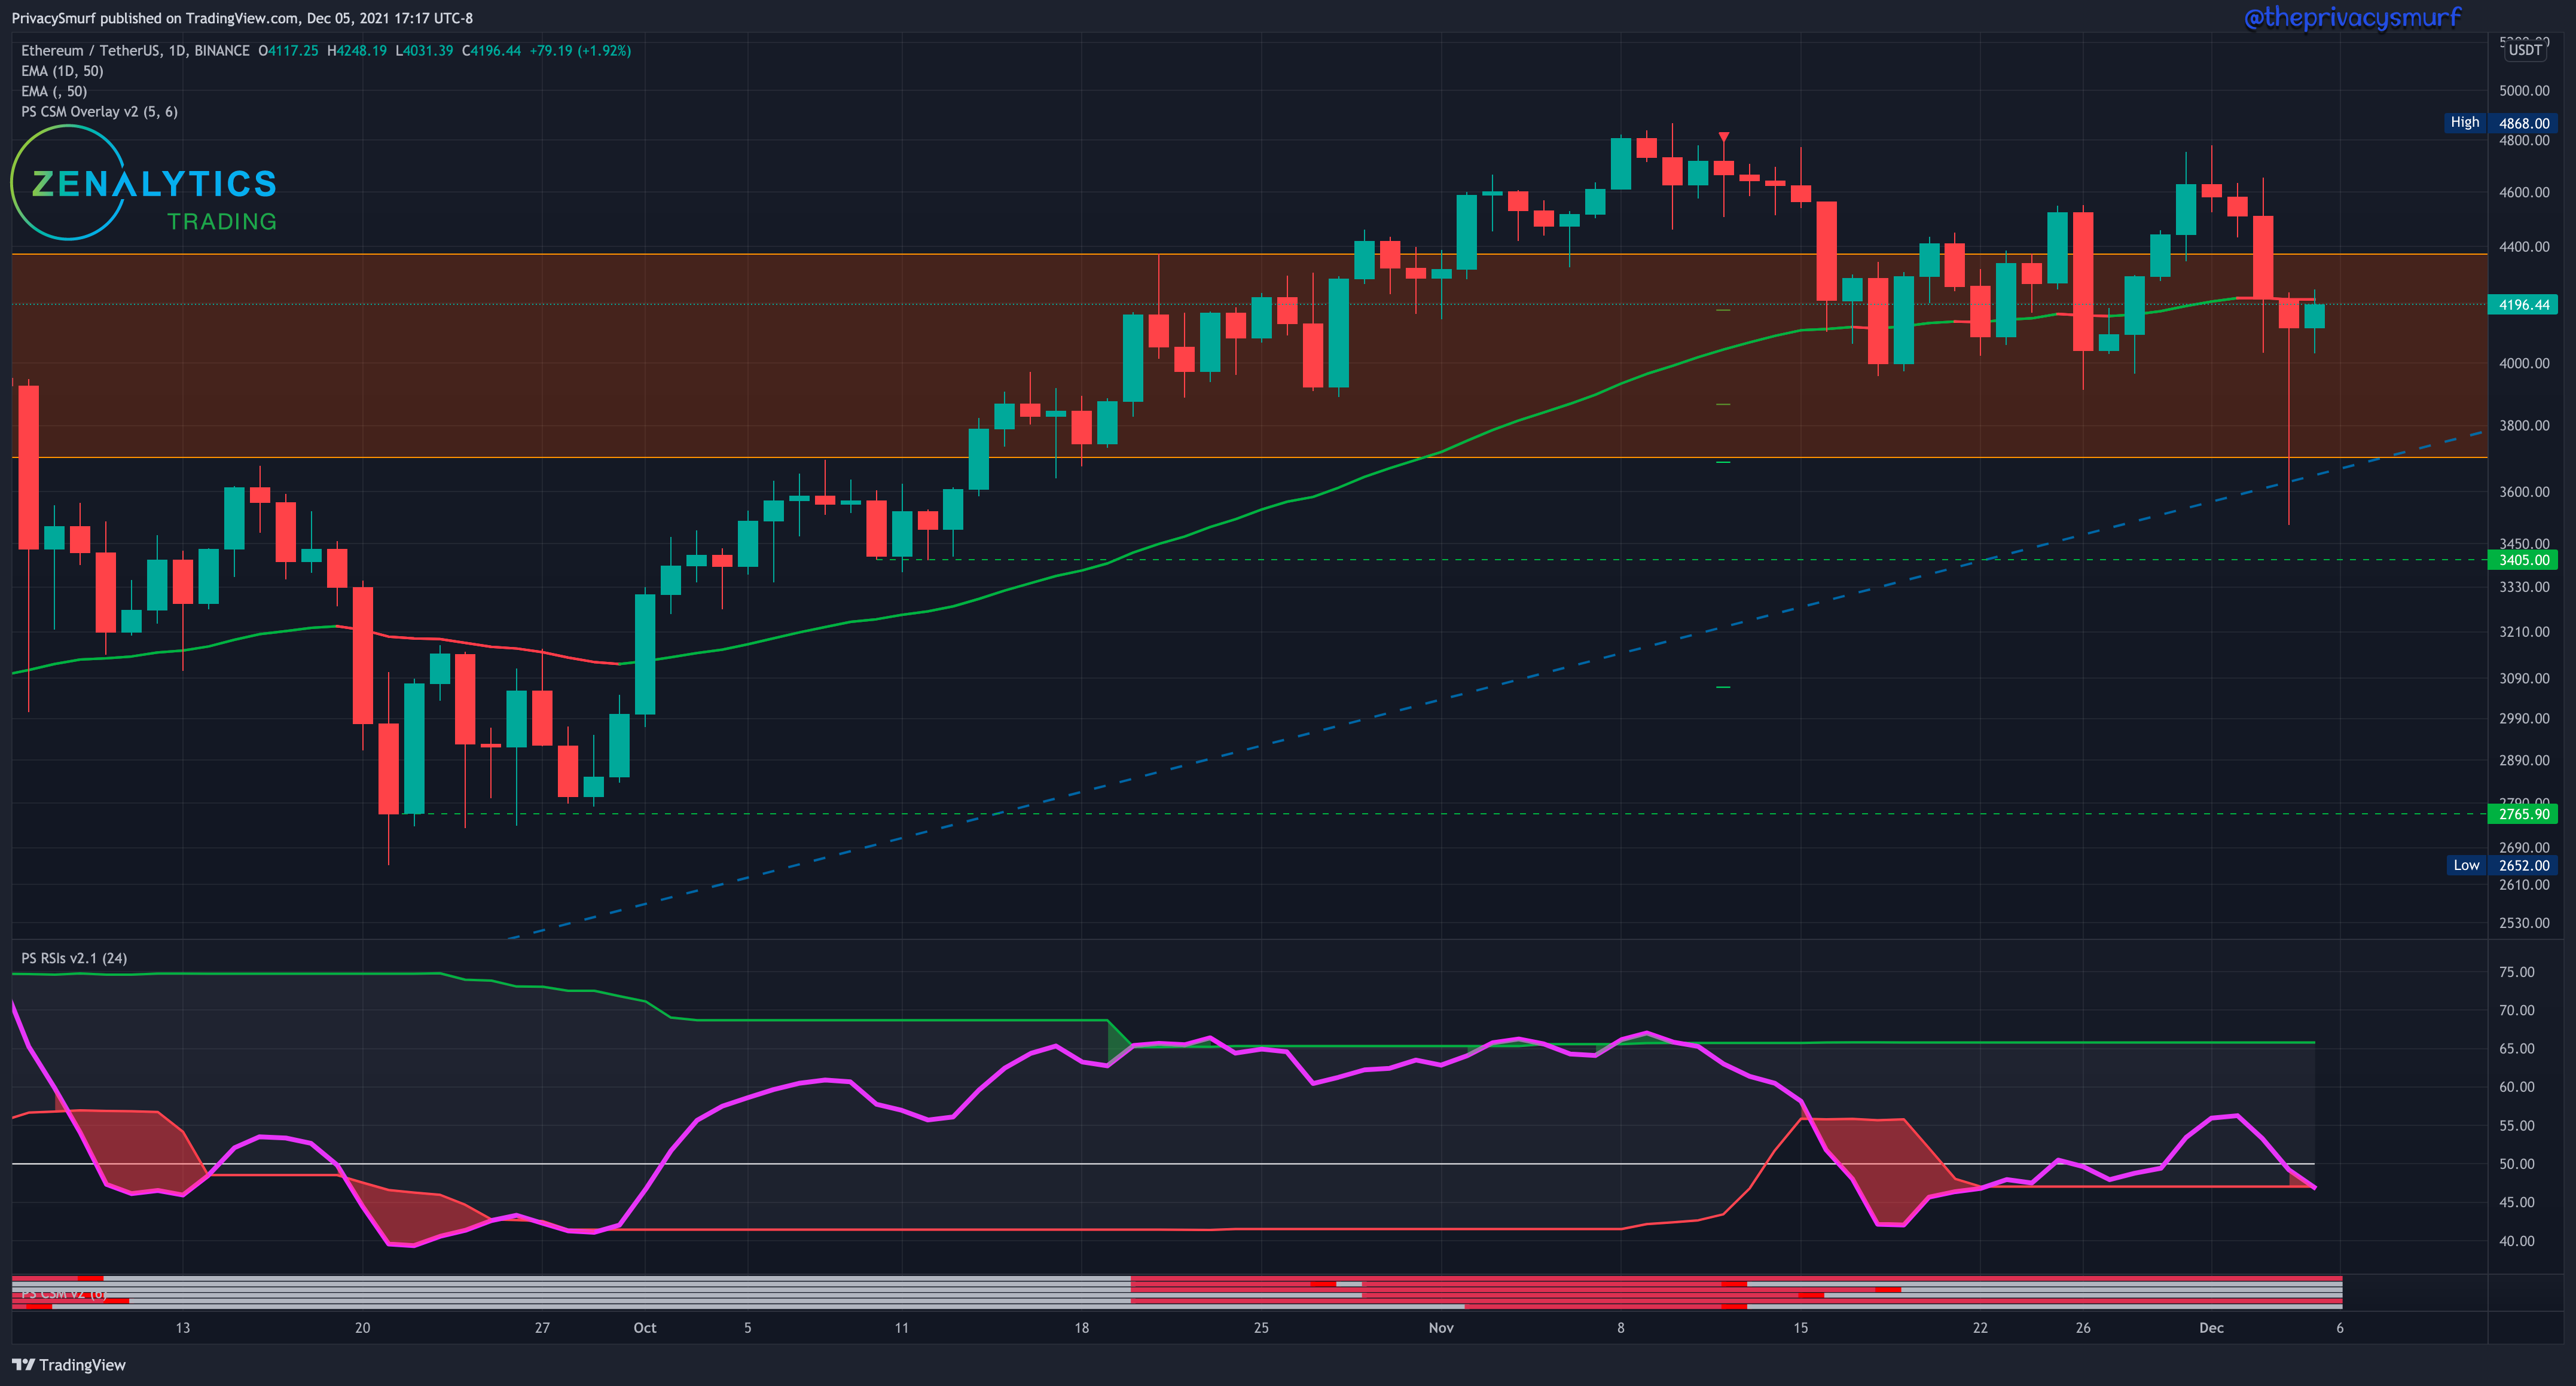
Looking at the daily chart we can see the ascending line backed up by the horizontal low close support at $3405 held up to stop the bleeding on the failure of the 50-Day EMA. The 50-Day EMA is now resistance and without some buying pressure, it’s likely to hold. The RSI is trailing down and breaching the lower band. A bearish price continuation is likely to follow this action. My indicator at the bottom of the chart (PS Correction Strength Meter) showed the potential for the bearish correction on Oct 12 with the potential targets below. All but one were met in the following days. At the moment I don’t really suspect that will happen, technicals will need to measure worse than they are now to have confidence in a projection of lower prices than that $3400 support.
I have quite a few things to write about this week. They will be slightly educational but mostly things that I’ve had to repeat a bunch lately in the spaces I frequent online. I want to put it all in one place so I can simply refer to that link. I still also have my speculative narrative to post this week. I still also have the mega altcoin post to share. So many things.
Have a good week and see you soon.
@theprivacysmurf
And, I had no idea what (ノಠ益ಠ)ノ彡┻━┻ meant - but I going to tweet it at the first chance I get.
dying to know, what was the annoying song?