

Sunday Synopsis #23: Tainted Love
Sunday Synopsis #23: Tainted Love
Sometimes I feel I've got to run away. I've got to get away from the pain you drive into the heart of me.


I keep thinking of the ECG-sounding beat of this song when I look at the charts. On the technical charts BTC bullishness is struggling to Stay Alive (dang, I could have used that song too). Hopefully, we can make it through another week. I’ll keep my finger on the pulse and post updates as needed this week.

BTC/USDT Weekly Structure
https://www.tradingview.com/chart/4v8qizyI/

The weekly structure is largely unchanged at the close today. The market structure support continues to hold. With no closes so far under $43160, the market structure-based trend is still bullish. The indecision showed by open and closing prices being near the middle of the candle gives little insight into the coming week.
BTC/USDT Daily Chart
https://www.tradingview.com/chart/jjSdFW4b/

Last week’s analysis couldn’t have been much better.
Looking at the RSI being below the bottom band (oversold) and support zones and lines labeled on the chart it’s likely prices remain low this week, the failed support at $52k being the ceiling and $46k being the floor for the time being.
Prices consolidated in that range all week. New things to note is the potential for a bullish correction indicated by my new indicator (Privacy Smurf Correction Strength Meter). The green bars at the bottom of the chart show that two oscillators are indicating a potential bullish reversal. Since only 2 oscillators are showing this potential reversal the reliability isn’t as high. The RSI has crossed above the bottom band which shows the cyclic action in price is on the uptrend but it is still below the midline which is associated with bearish price action. I’ve added in a rough descending trendline. There is a compression of the price between the low support at $46k and the descending trendline. The trending up of the RSI may lead to a bullish break of this descend trendline but I don’t expect any break of our ranging market structure at the moment. The prevailing trend on the daily trend is still down so caution in long positions would be wise until BTC can close on the day above $52k. I’ll make a short post if things look like they’ll be changing during the week.
ETH/BTC Weekly Structure
https://www.tradingview.com/chart/sacHlXOv/
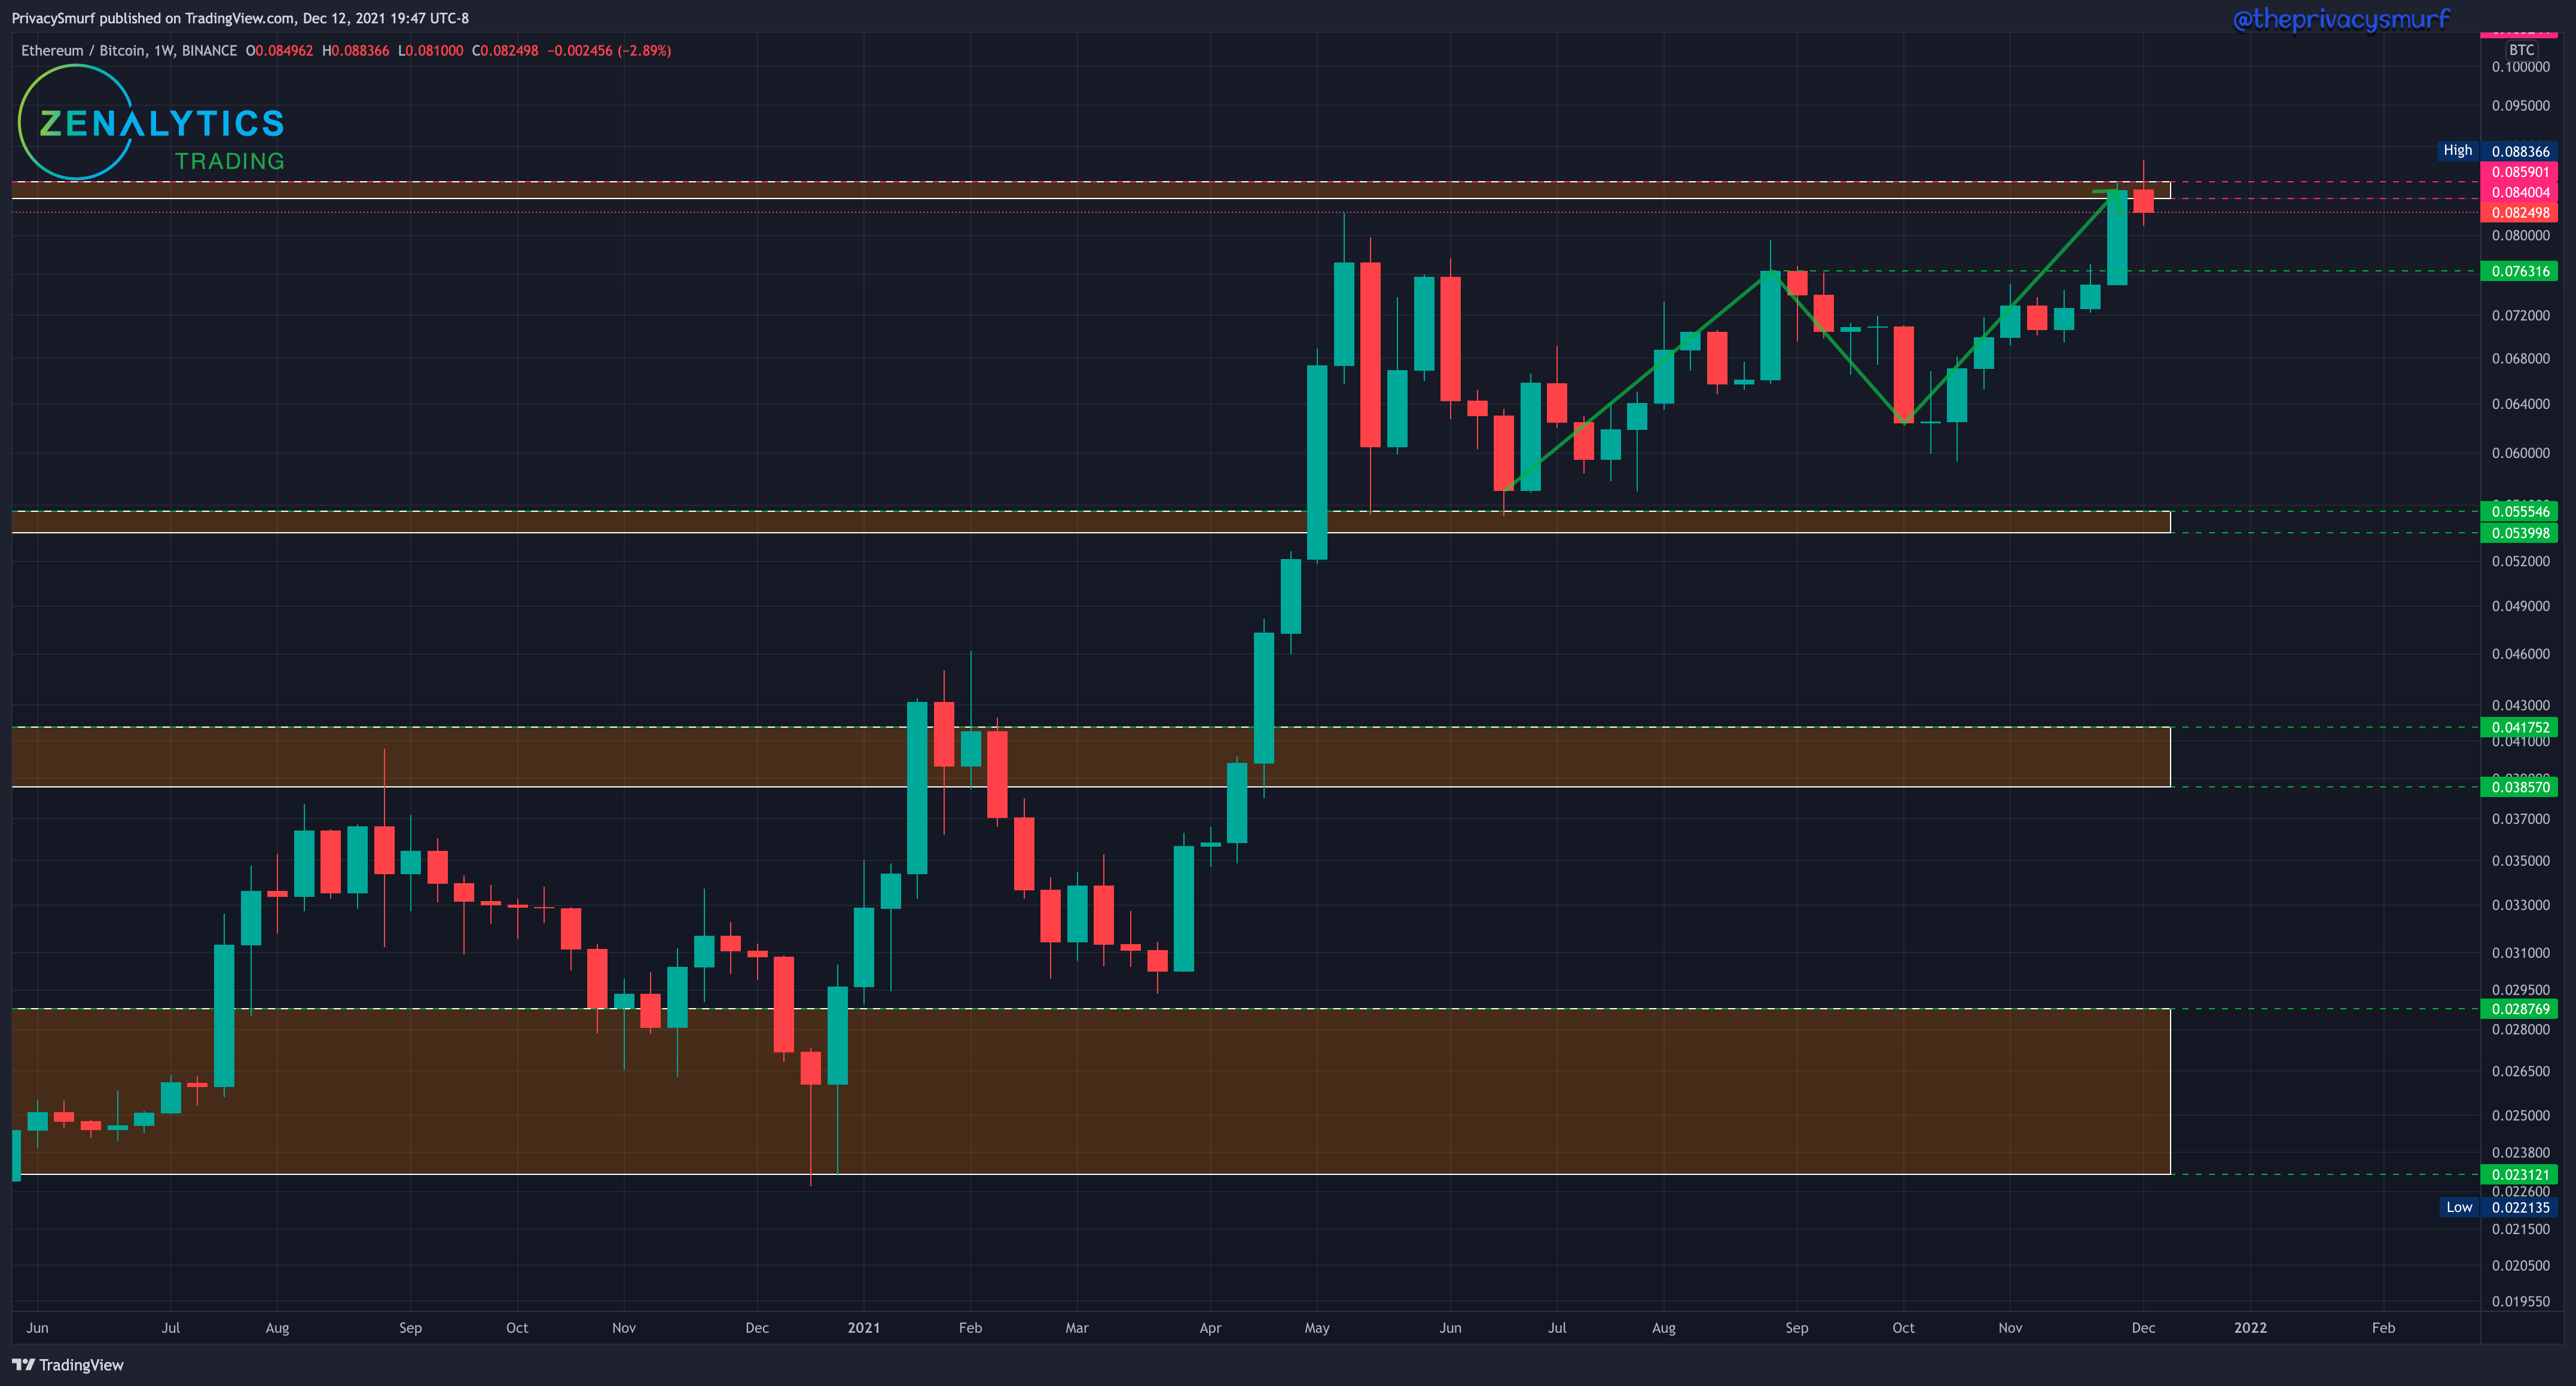
The retracement possibility expressed last week came to pass. The retracement was a relatively small one. A retracement back to the 0.076 support is still a likely event and we’ll talk about why looking at the daily chart.
ETH/BTC Daily Chart
https://www.tradingview.com/chart/gTkSjkj6/
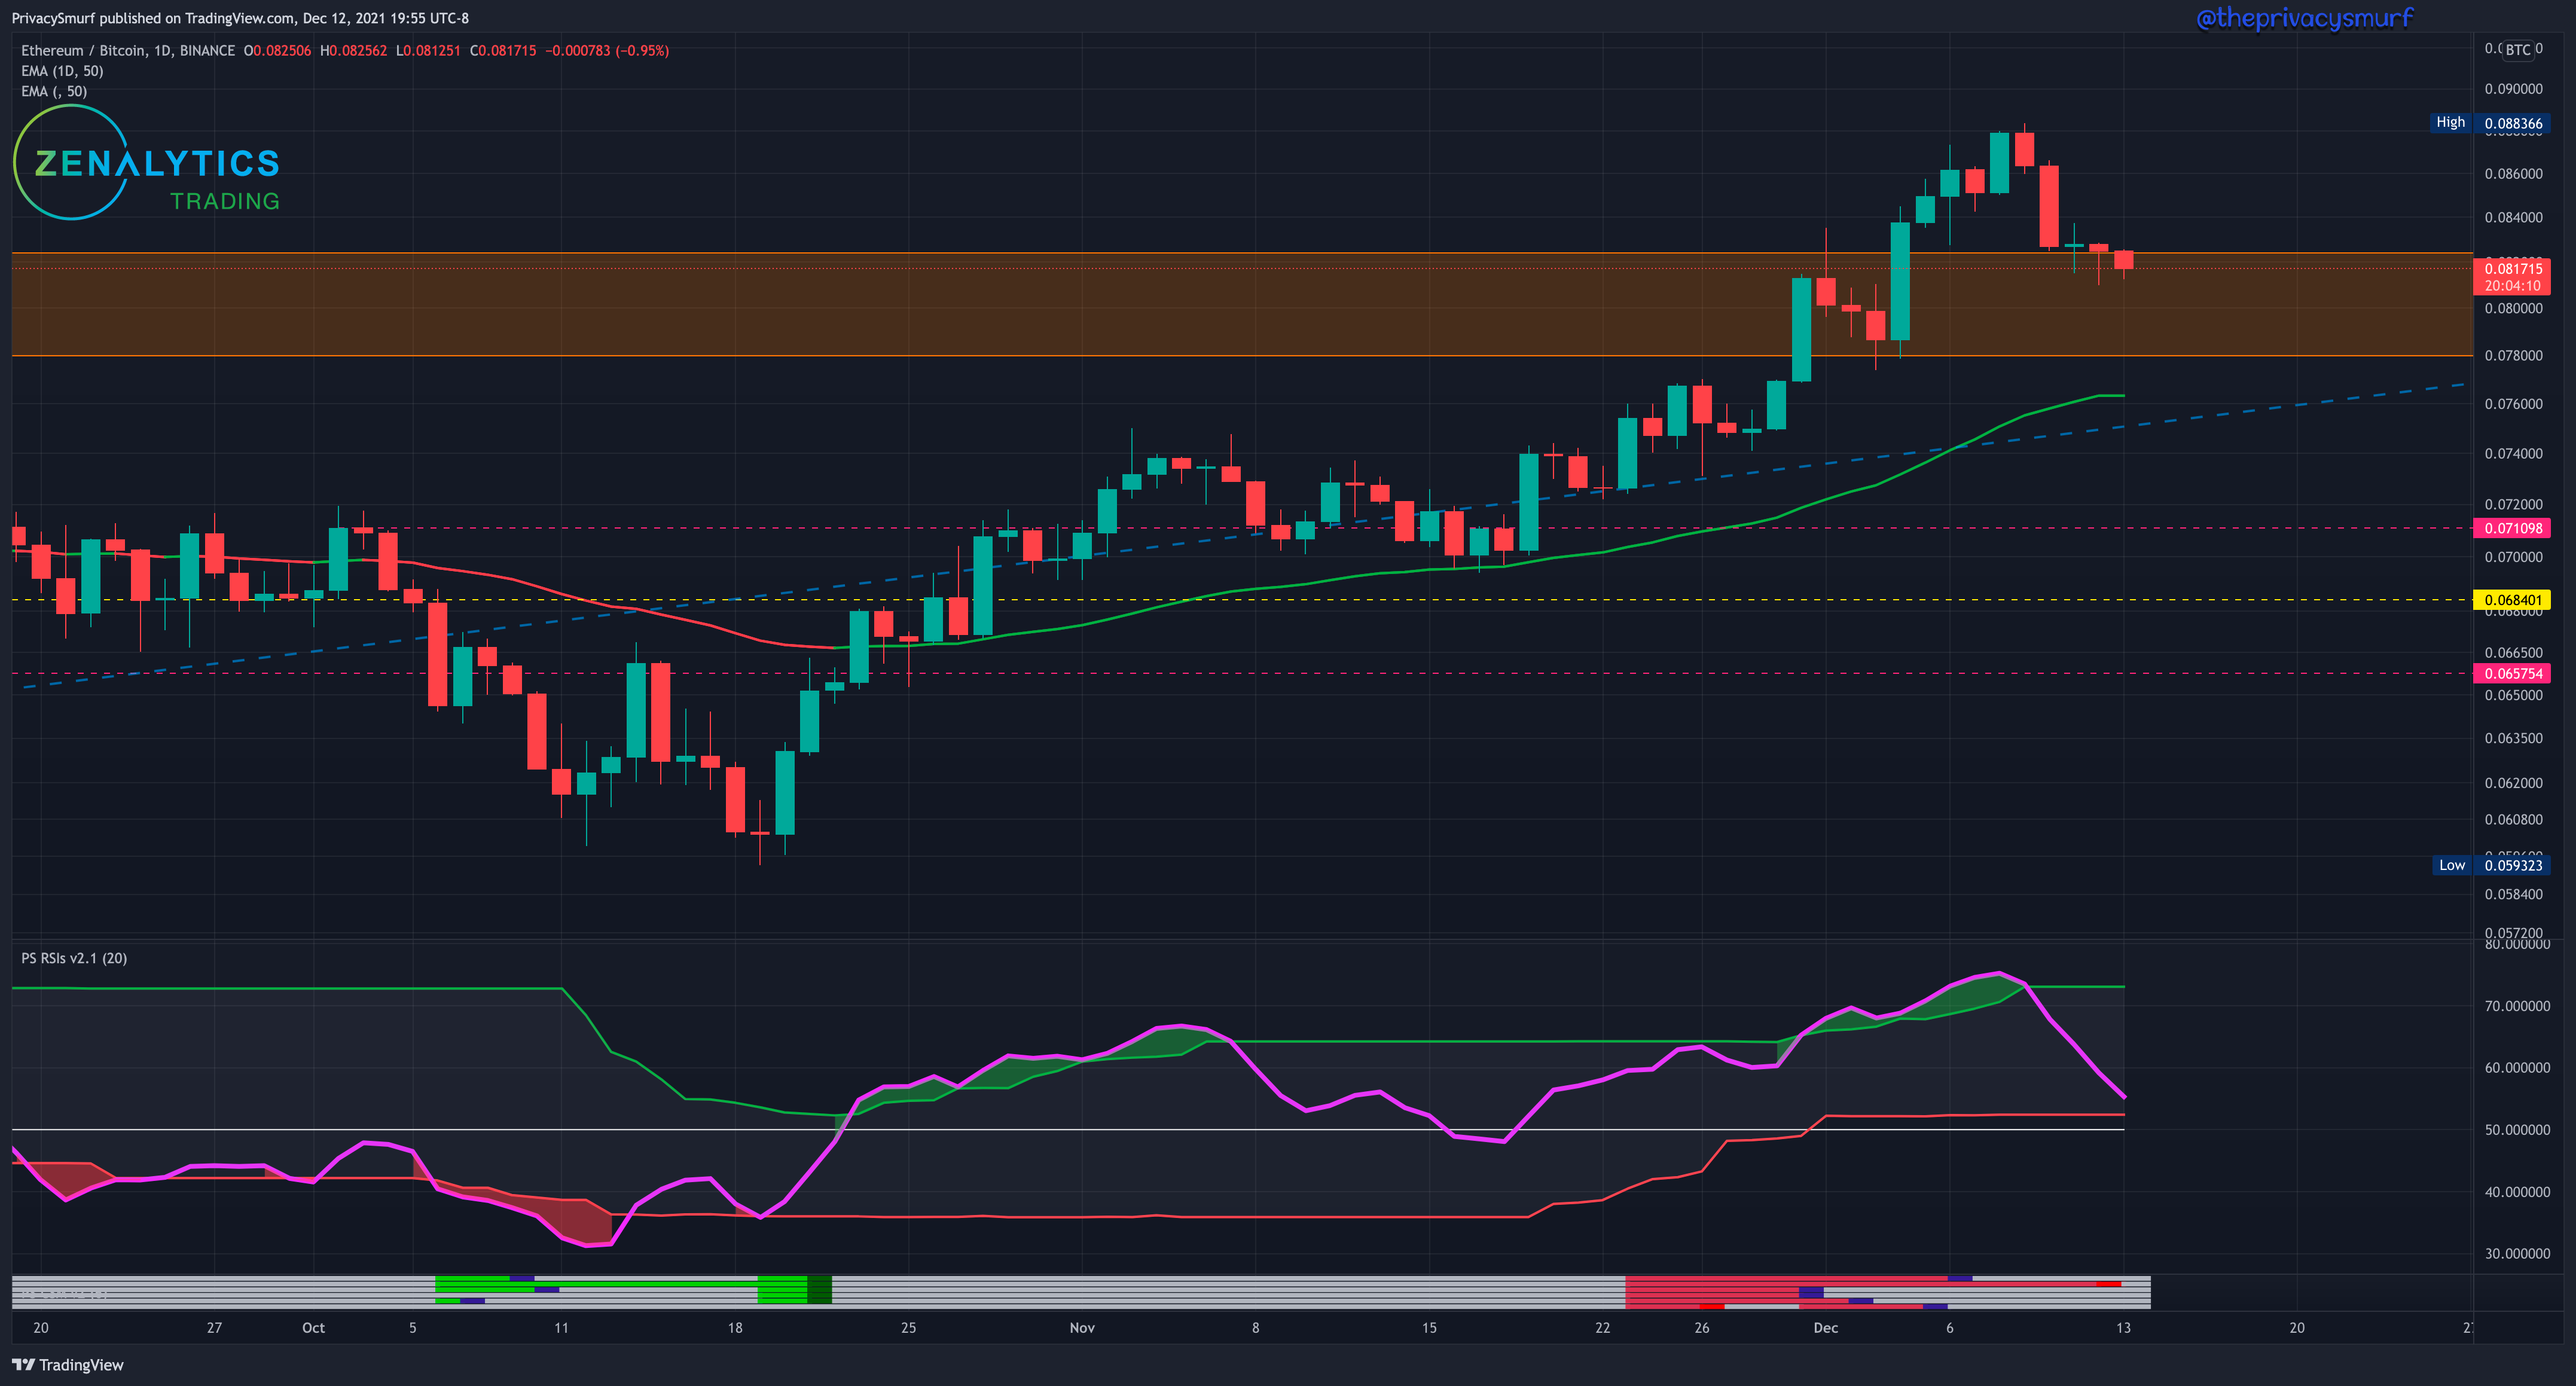
Here things played out like clockwork.
With the RSI breaking above the top band there is likely some gas left in the tank for a few days but a retest of support will eventually come.
The week opened with some rising prices and eventually fell off despite most indications of correction being invalidated on the Correction Strength Meter located at the bottom of the chart. Where we are at now the RSI is making a beeline to the midline and the bottom adaptive band. A great bearish trade setup using the adaptive bands is when the bottom band is ABOVE the midline (50) of the vertical RSI price scale and the RSI breaks below both the bottom band and the midline. That can often be found with significant decreasing price action. That here in this instance may lead to a test of the 50-Day EMA which is backed up by the long-term ascending trendline just around the weekly support level at 0.076. That being said the decline of this pairing is evidence that BTC and ETH are both going to be trending down or BTC is going to be trending up and ETH will be ranging or going down. Perhaps the ETH/USDT chart can help with figuring which one is more likely.
ETH/USDT Weekly Structure
https://www.tradingview.com/chart/JPTp0aXw/
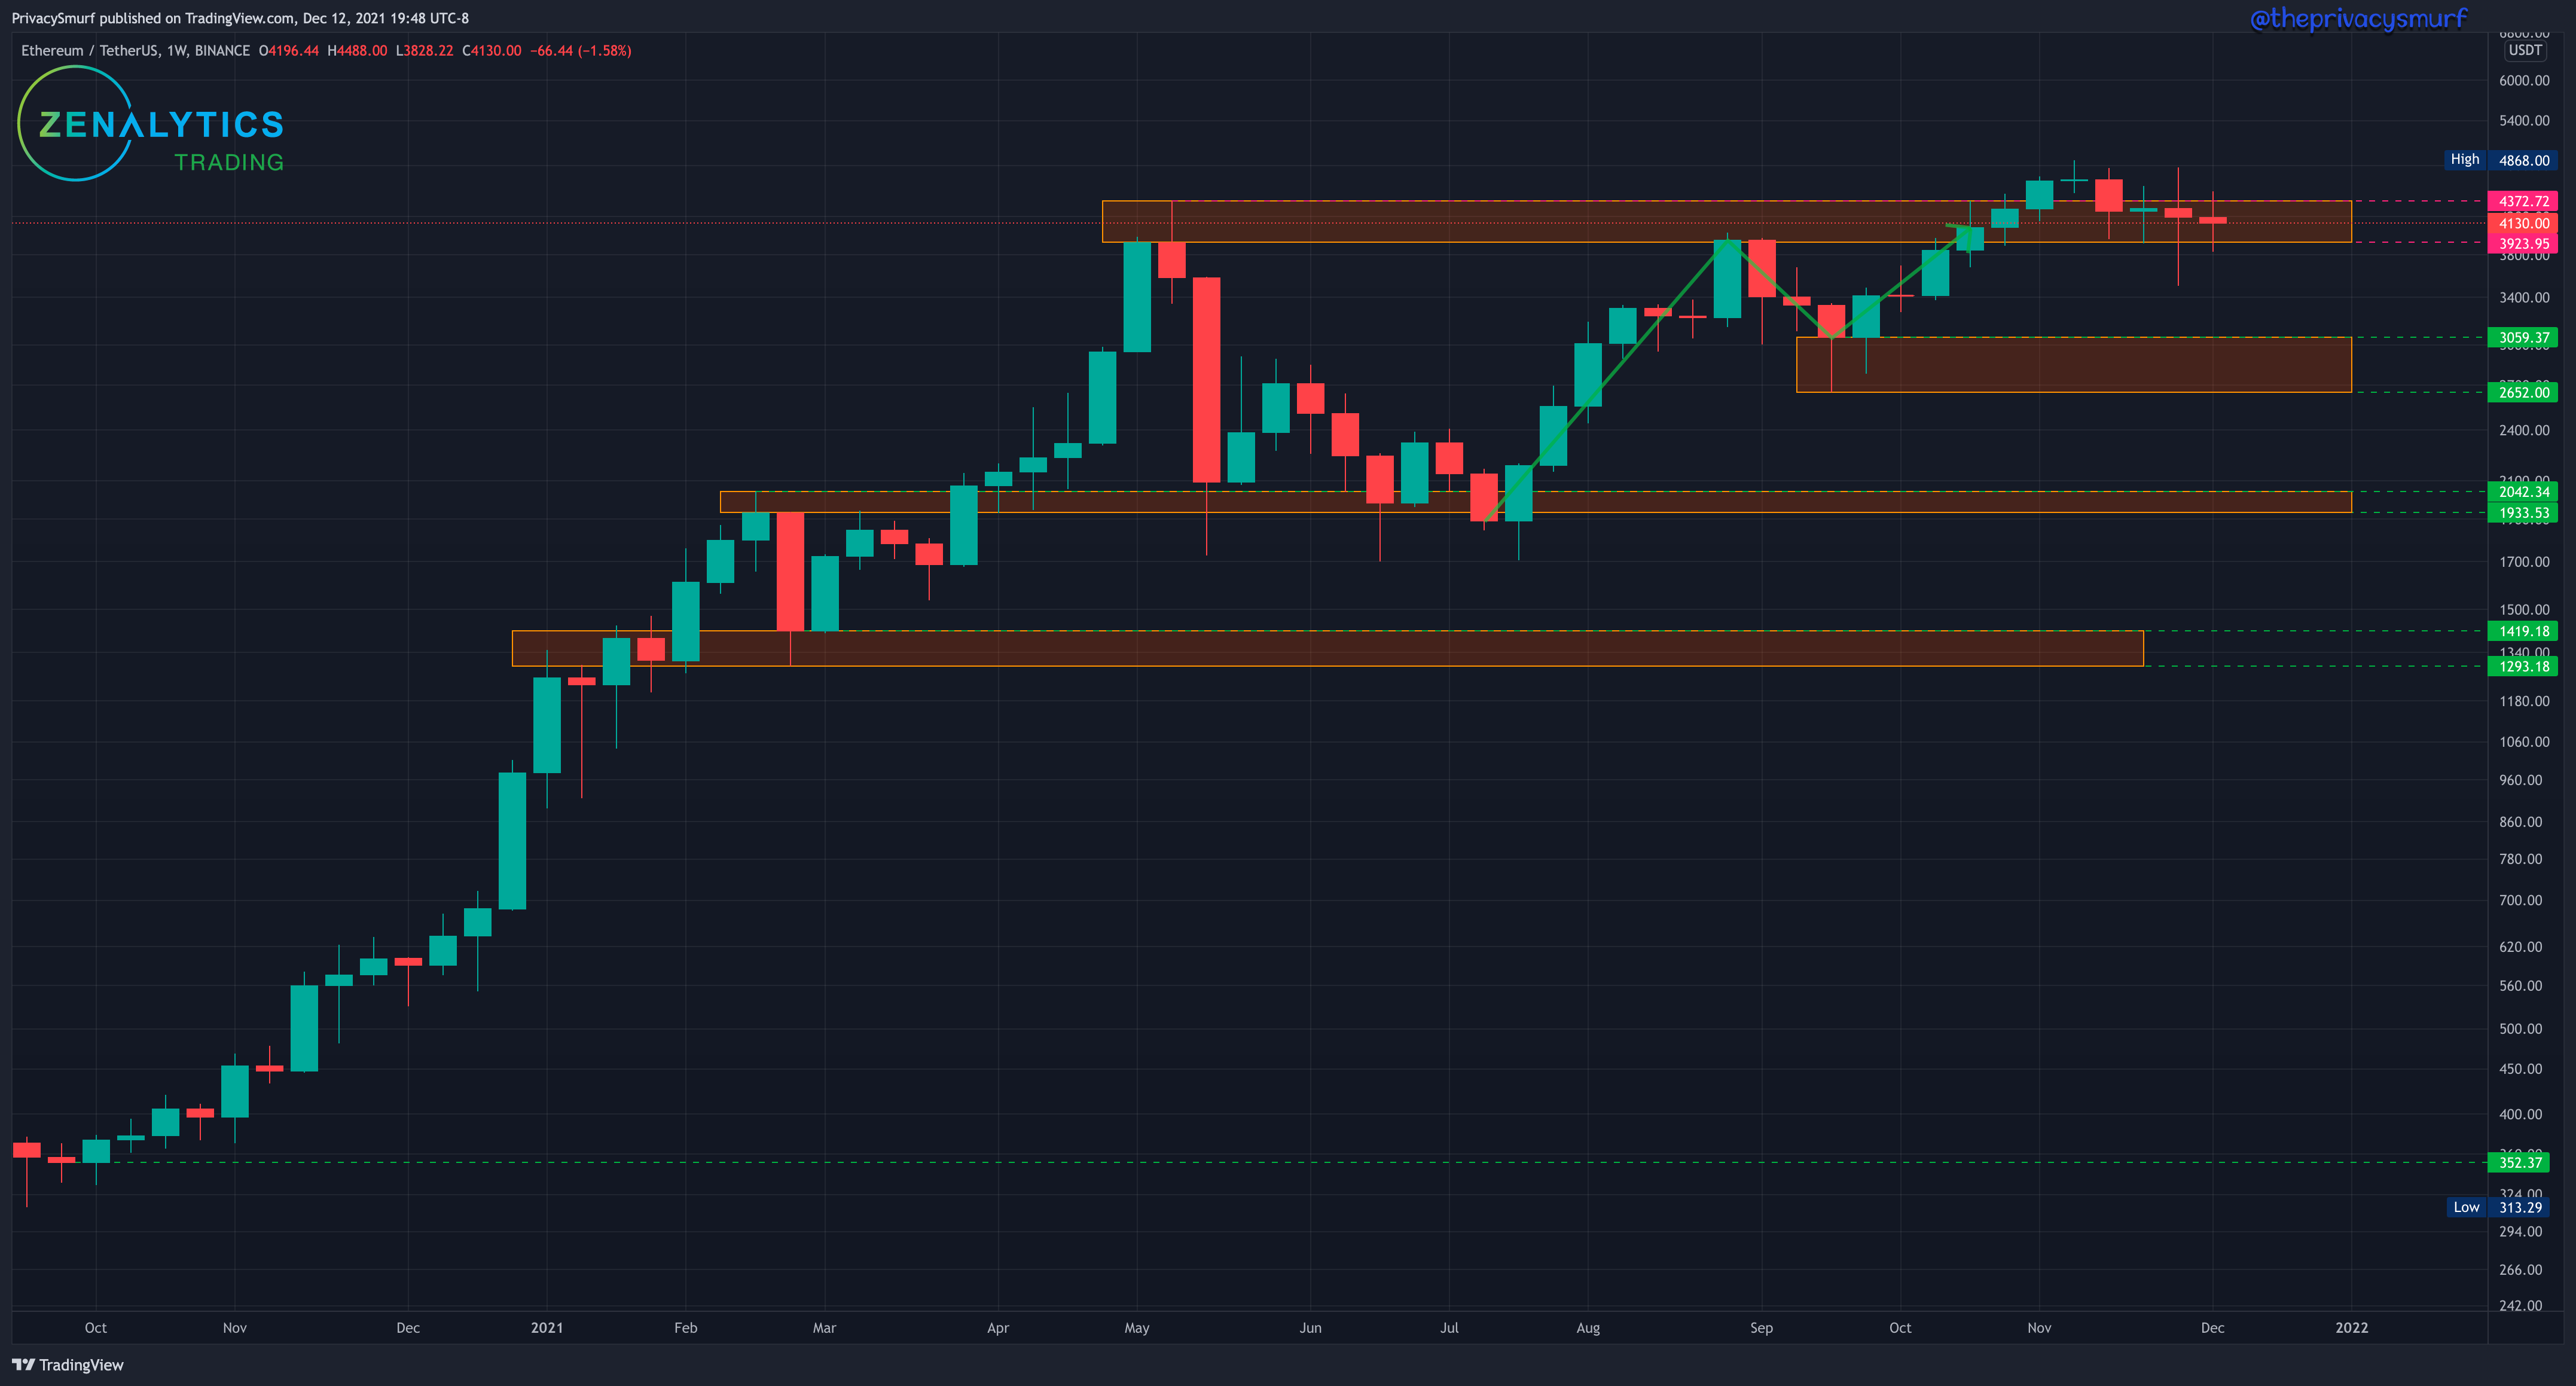
Sometimes it gets repetitive to say that things played out as expected but hopefully in doing so you recognize that these methods and ways of evaluating the market work and you try extra hard to absorb the processes I go through to make these assessments so you can do them with your own charts to make your own profitable trades and investments week after week.
I suspect there will be another ranging week here in this top resistance zone.
ETH stayed in the top resistance zone this week. This chart alone I don’t have any reason to suspect otherwise but adding in the ETH/BTC chart and the potential price action on BTC there may be some different outcome. The market structure trend is still bullish and a close under $3059 would be needed to change that. The daily picture may point to a more clear outlook for the week.
ETH/USDT Daily Chart
https://www.tradingview.com/chart/xbB6lkZu/
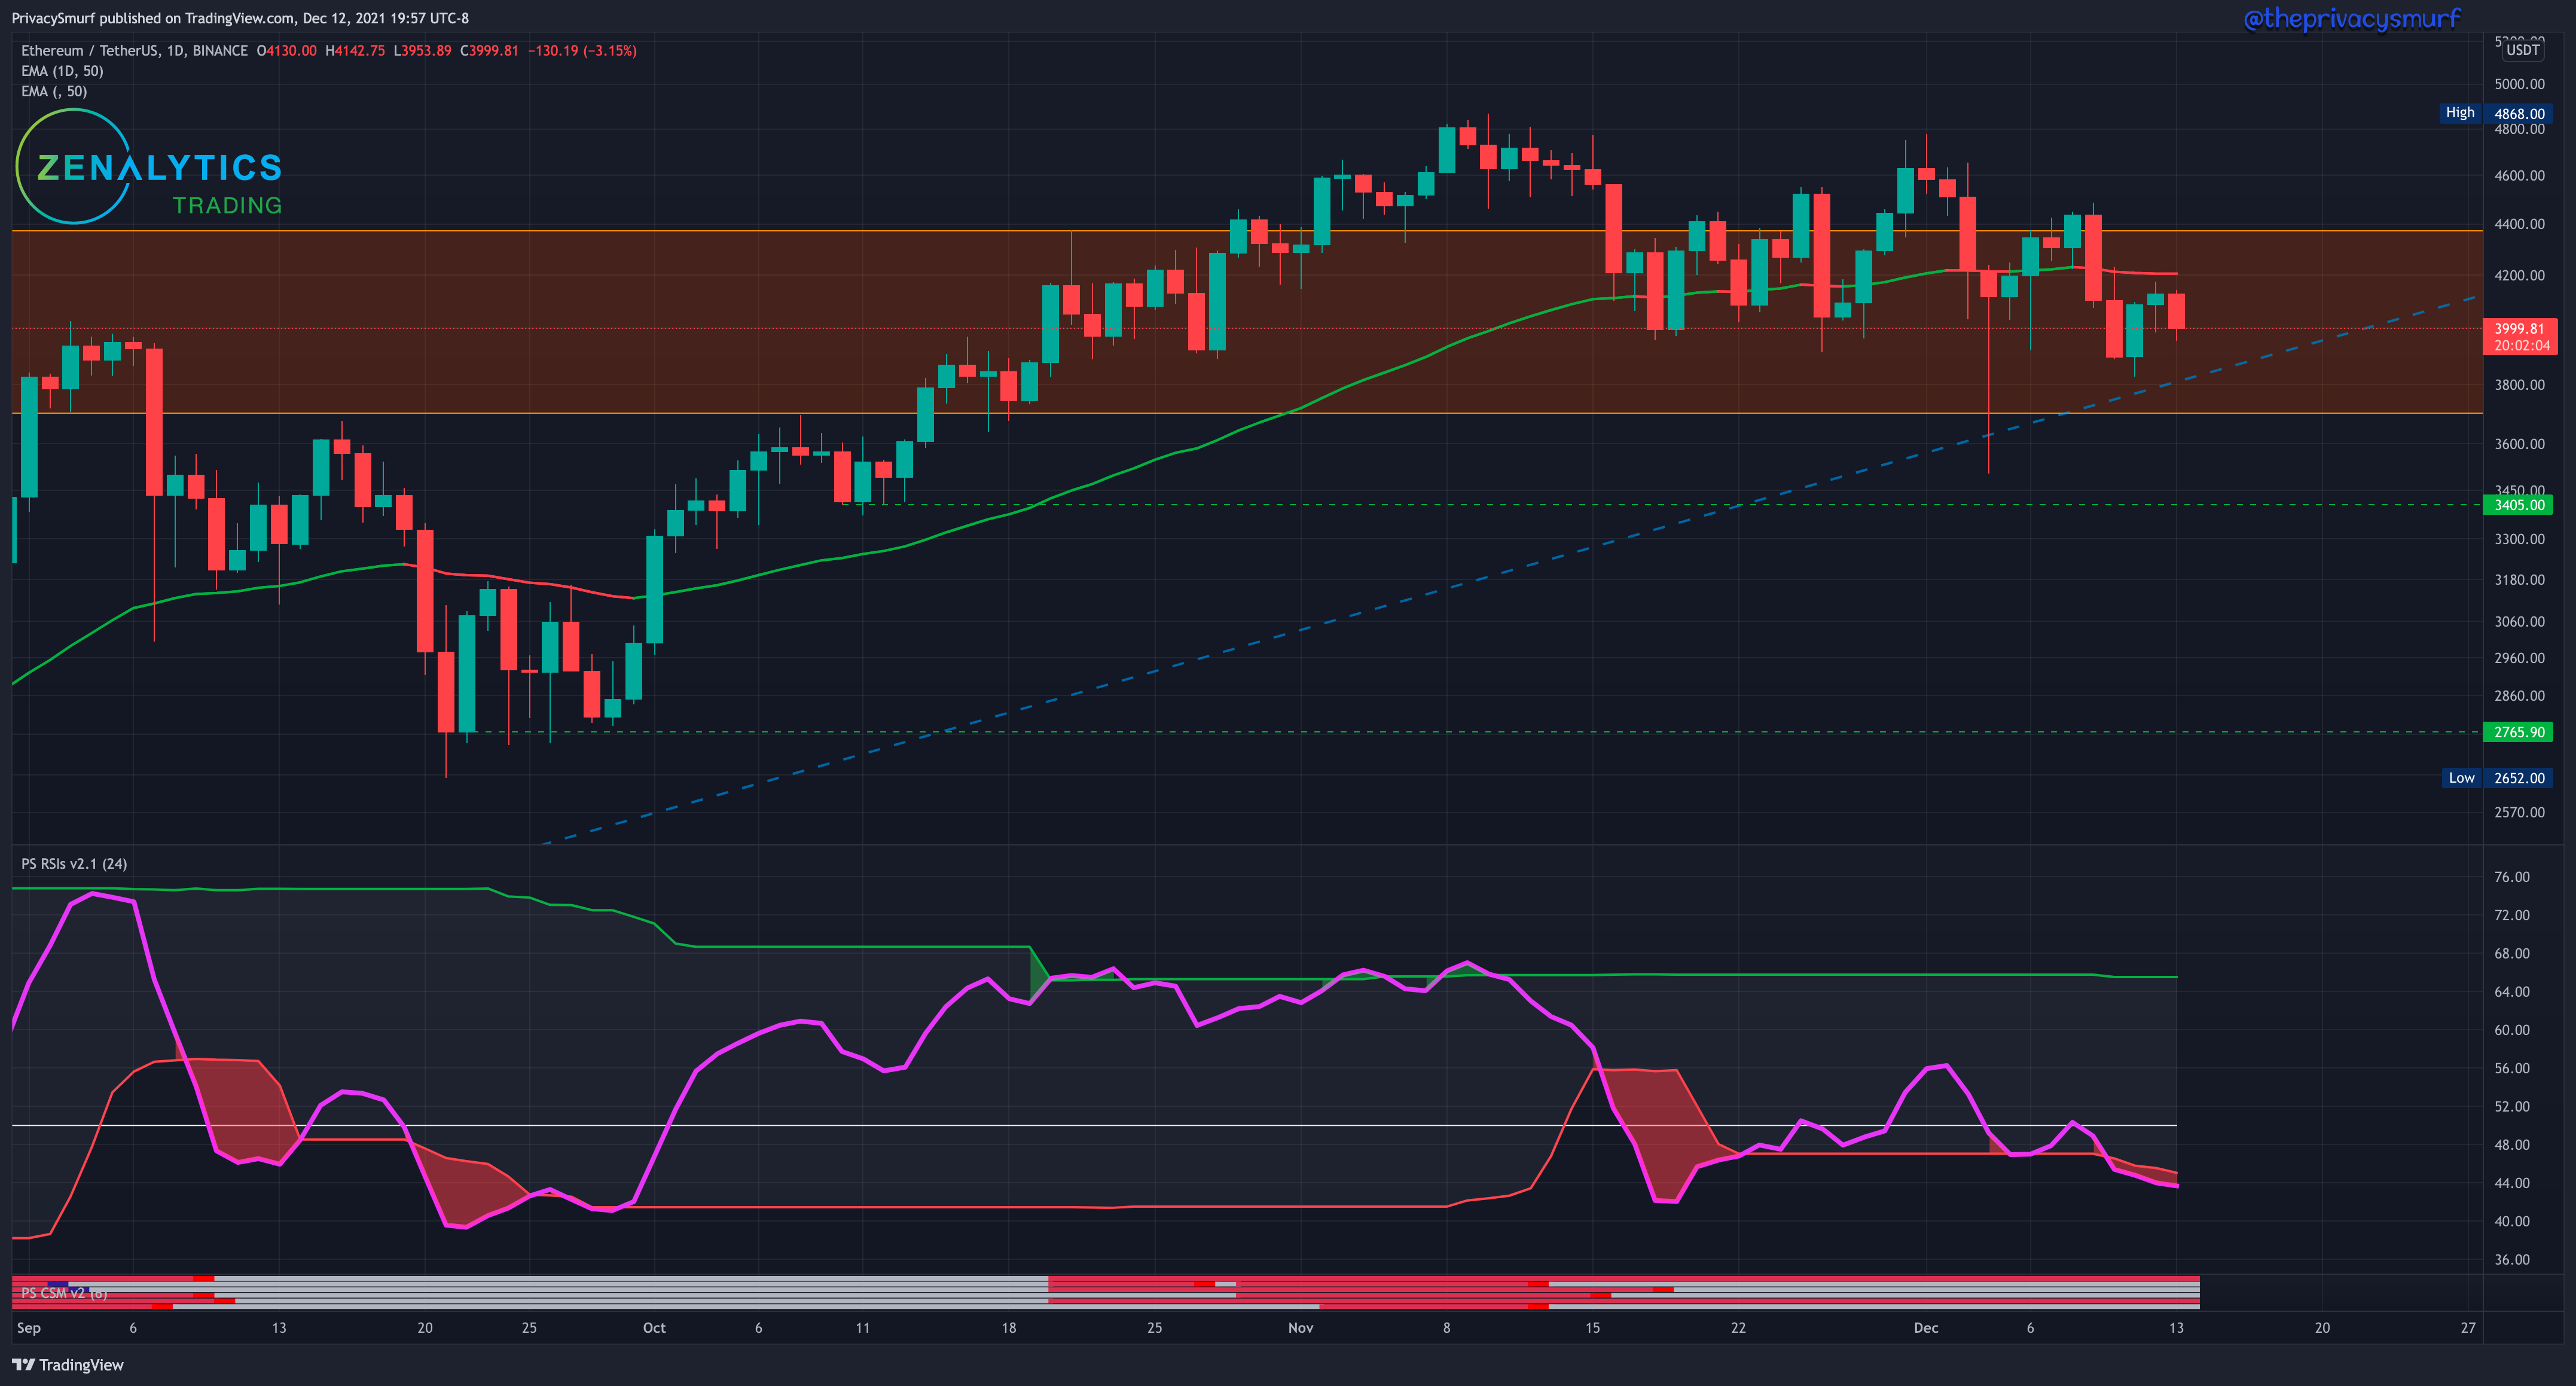
The daily chart now shows a bearish trend of new lower low closes. The long-term ascending trendline is acting as support for the time being but weakness is building. The RSI is still trending down and below the bottom band indication the potential for further declining prices. There will likely be volatility as the price becomes compressed between the 50-Day EMA and the trendline. I expect volatility early with a slightly bearish bias this week. There’s always the potential of the money machines getting cranked on at market open tonight or tomorrow. There’s no way to really predict that sort of thing, but barring that random volume things are looking a bit worse for ETH this week. Wicks may get down low enough to test the recent low and support at $3045. Again, here caution is something that wouldn’t be a bad choice with the current picture and technical indications.
I’ll update as necessary unless I’m asleep. Feel free to pass this along to anyone else trying to keep up with the markets as well. I appreciate it and I imagine they would too. It is my constant effort to provide sound market analysis to help inform your decisions. There’s not a lot of that out there. Don’t forget we have a new year coming up with a new quarter forecast. The previous one, to beat a dead horse, played out pretty well. I’ve unlocked Q3 and Q4 forecasts so you can see what is provided.
Pay close attention to the portion of the Q3 forecast that talks about combined price cycle forecasts and the volatility cycle forecast

The original model forecast from July 4 post put a peak for BTC in mid-Octover and the Q4 update placed it around OCT 16th and BTC hit its top on OCT 20th 4 days later.
I’ve hinted at it before in different forums but I think now is a unique time for this type of analysis with BTC because many people are completely wrong in their understanding of what a cycle is and how they work and that is becoming more and more clear as people are miscalculating the major market turns or wrong in predictions of movement and stunned by the lack of movement.
All the Quarterly Forecasts are released only on the paid side of the newsletter so you have to upgrade your subscription if you want to read them. They are relatively time-sensitive posts if you want to position yourself before things start to happen.
Have a great week. See you in your inbox! Leave a comment and let me know if you have any suggestions or things you’d like to see. I know I haven’t dropped the massive altcoin post that was promised but I can’t in good conscience push folks out into the deep end while the market is not looking like it’s going to cooperate. It will come soon for all you paid subscribers. Thanks for your patience.
@theprivacysmurf
It is uncanny how precise your predictions are! Learn so much every time I read these and go back to read other ones that have relevant topics that tie in to the current one. Thank you as always...