

Sunday Synopsis #25


Being in a new year and thinking about some changes I’ll take a moment to let everyone know what to expect with the free Sunday posts. The Sunday Synopsis is a look at the market where the market was over the last week. The market in my opinion is mostly at the whims of BTC, ETH, and the way the two relate to each other. Most assets will move similarly to these two. Also monitoring how they relate in value to each other will tell you where it’s best to be exposed at any point in time. If you can read the market as a whole, you can read the market constituents individually.
The Sunday Synopsis is great for both long-term holders and short-term traders. The long-term holders in my opinion should not be hands-off on their investments as a whole because there are simple enough ways to identify relatively low-risk opportunities to take some profits along the way. If you currently can’t identify these opportunities, that’s why this post is great for you. I’ll talk about them incessantly. The methods I talk about (aside from the cycle analysis) are all replicable on your own and you can apply them to your own assets. (I’m considering making that cycle analysis on individual assets available for subscribers on request). I also highlight macro support/resistance levels that would be great for long-term Dollar Cost Averaging.
I didn’t forget about you short-term folks. This is great for you because I highlight what I’m expecting over the next week. Even though it’s not on the precious alts that you are probably trading it’s likely they will respond in a similar way to BTC or ETH. In reviewing many of the past Sunday posts I have to admit that the forecast staying valid past Thursday or so is largely an amount of luck. Many aspects of the daily charts can change to create a different outcome in that time. That’s why I’m integrating a new paid subscriber post on Wednesday. The Mid-Week Wednesday Update. This will be taking the place of the Micro Monday (which I didn’t really like the format after a few weeks of writing it). This new post will focus on the daily chart and a lower intraday chart to dial in where the week will potentially be finishing off. If you are a long-term person, you don’t necessarily need to follow that one completely unless you want to. Although if the market does something crazy after the Sunday post goes out it may be worth checking out the midweek post.
Side note, if you haven’t read my 2022 Q1 forecast it’s awesome and you should read it. The last few quarterly projections were on point and caught the major market shifts where tons of folks were calling for $100k BTC. I think there’s a lot that many folks in the crypto space are missing and I talk about that in the forecast. Check it out…

Also a heads up, I know this goes to everyone’s email but you can log on to the substack website and read all the older posts. I encourage everyone to do so. At the least check out the Topical Thursdays and old quarterly forecasts.
On to the other good stuff..
BTC/USDT Weekly Structure
https://www.tradingview.com/chart/4v8qizyI/

The weekly chart of BTC still has maintained the bullish market structure, despite dragging along the support zone established from the initial fallout back in April. A weekly close below $43160 would shift the market structure from bullish to bullish consolidation. A new lower high pivot and new lower low formed would confirm a weekly bearish trend, otherwise, the weekly trend and expectations are still up. On a weekly close below the $43k level, risky alt positions that are already in a loss should be critically examined to make sure you are positioned in a place to withstand further downside. The break of that structure has the potential to send the market much lower down to support around $38k-$42k at a minimum. That type of downside in BTC will be greatly multiplied in alts.
BTC/USDT Daily Chart
https://www.tradingview.com/chart/jjSdFW4b/
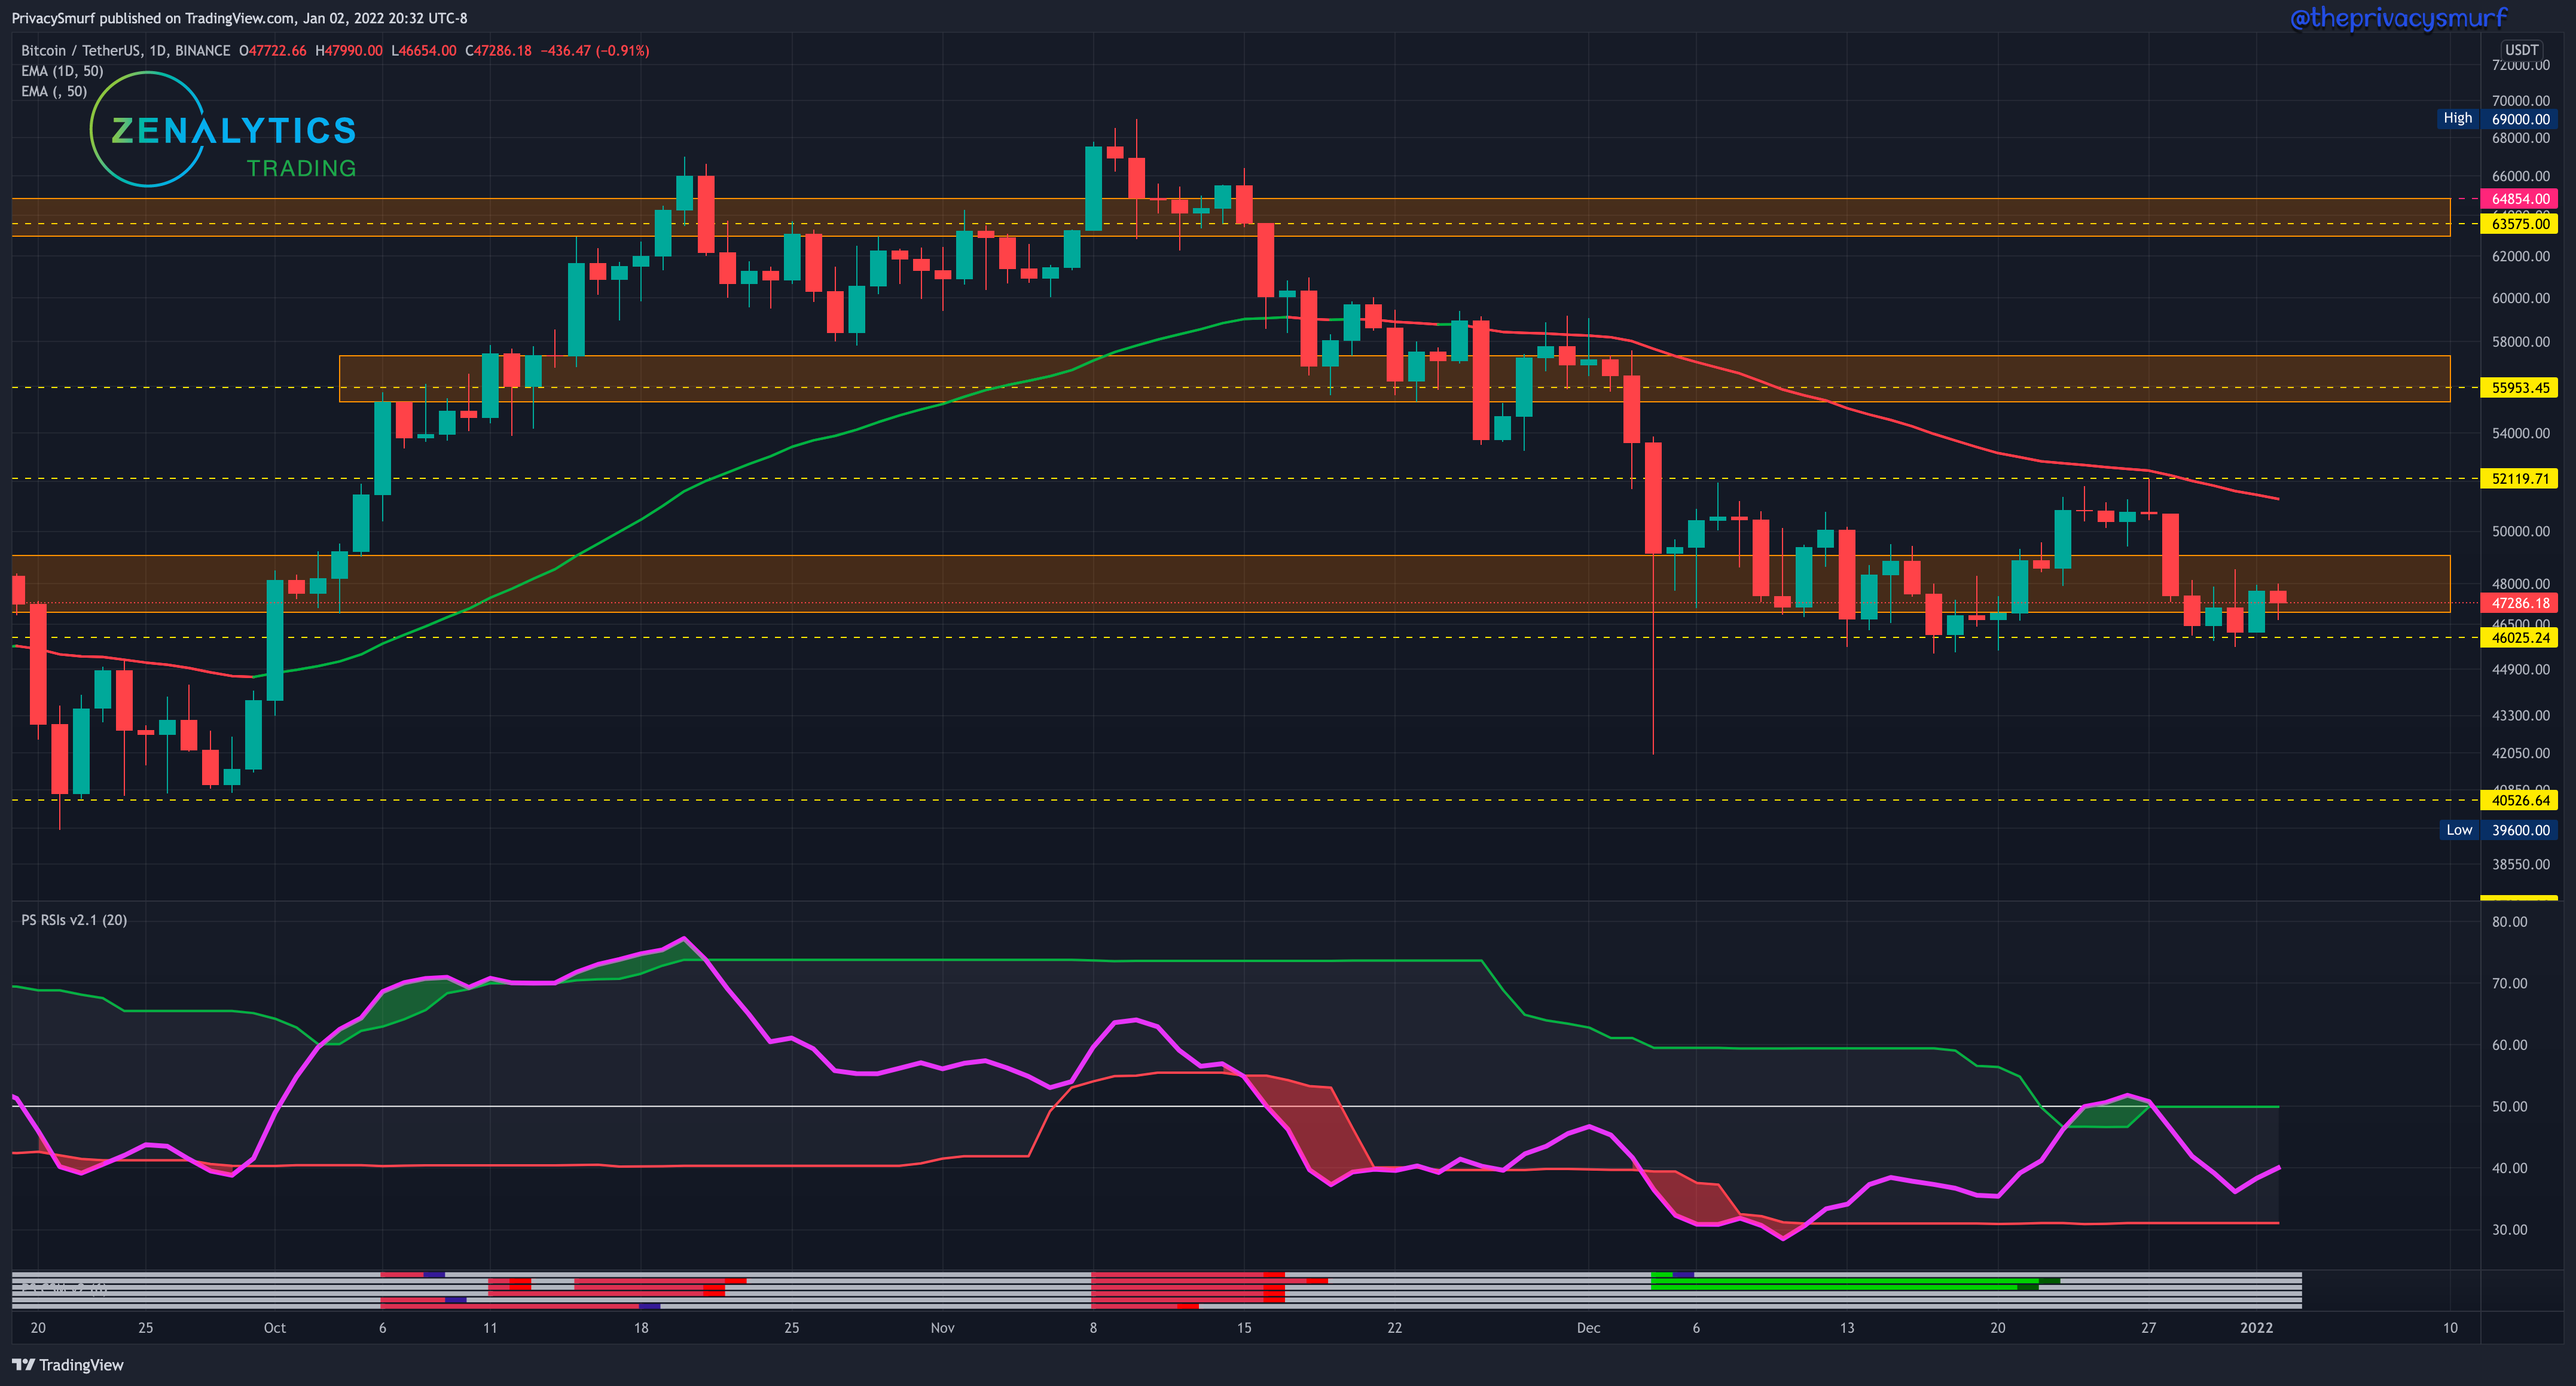
Same shit. Different day. The range is still the range. $46k up to $52. The price compression I posted in the last Sunday update I was planning for a downside break. That never came and the price moved up out of the wedge but hit the top of the range and the 50-Day Exponential Moving Average (EMA) and was rejected. There is a concerted effort by bulls to maintain the floor. There’s no telling how long that will.
As I’ve talked about in the post above there are very bearish implications on higher timeframes, but there are short-term bullish technicals to look at that may override all this. Bullish divergences can be seen on the RSI and a few other oscillators on the daily chart and on lower intraday timeframes. The RSI is ascending towards the midline and the top adaptive band is sitting on the midline. Breaking above those two is often associated with further price appreciation. Even though some coins may see some growth during this period of ranging I’m not taking any positions to hold longer than a few days until BTC closes outside the range either to the top or bottom. It’s hard to really make a call of BTC doing anything besides sitting in the current range. The longer it sits here though the more likely I feel like downside is possible though. I’m not expecting daily highs over $50-$51k at the moment, although there is the X factor of it being a new year, and new capital can be deployed by institutions. As I said in the last update. Bullish price action from this support IS NOT a signal of a bullish reversal. The trading range is still $46-$52k.
ETH/BTC Weekly Structure
https://www.tradingview.com/chart/sacHlXOv/
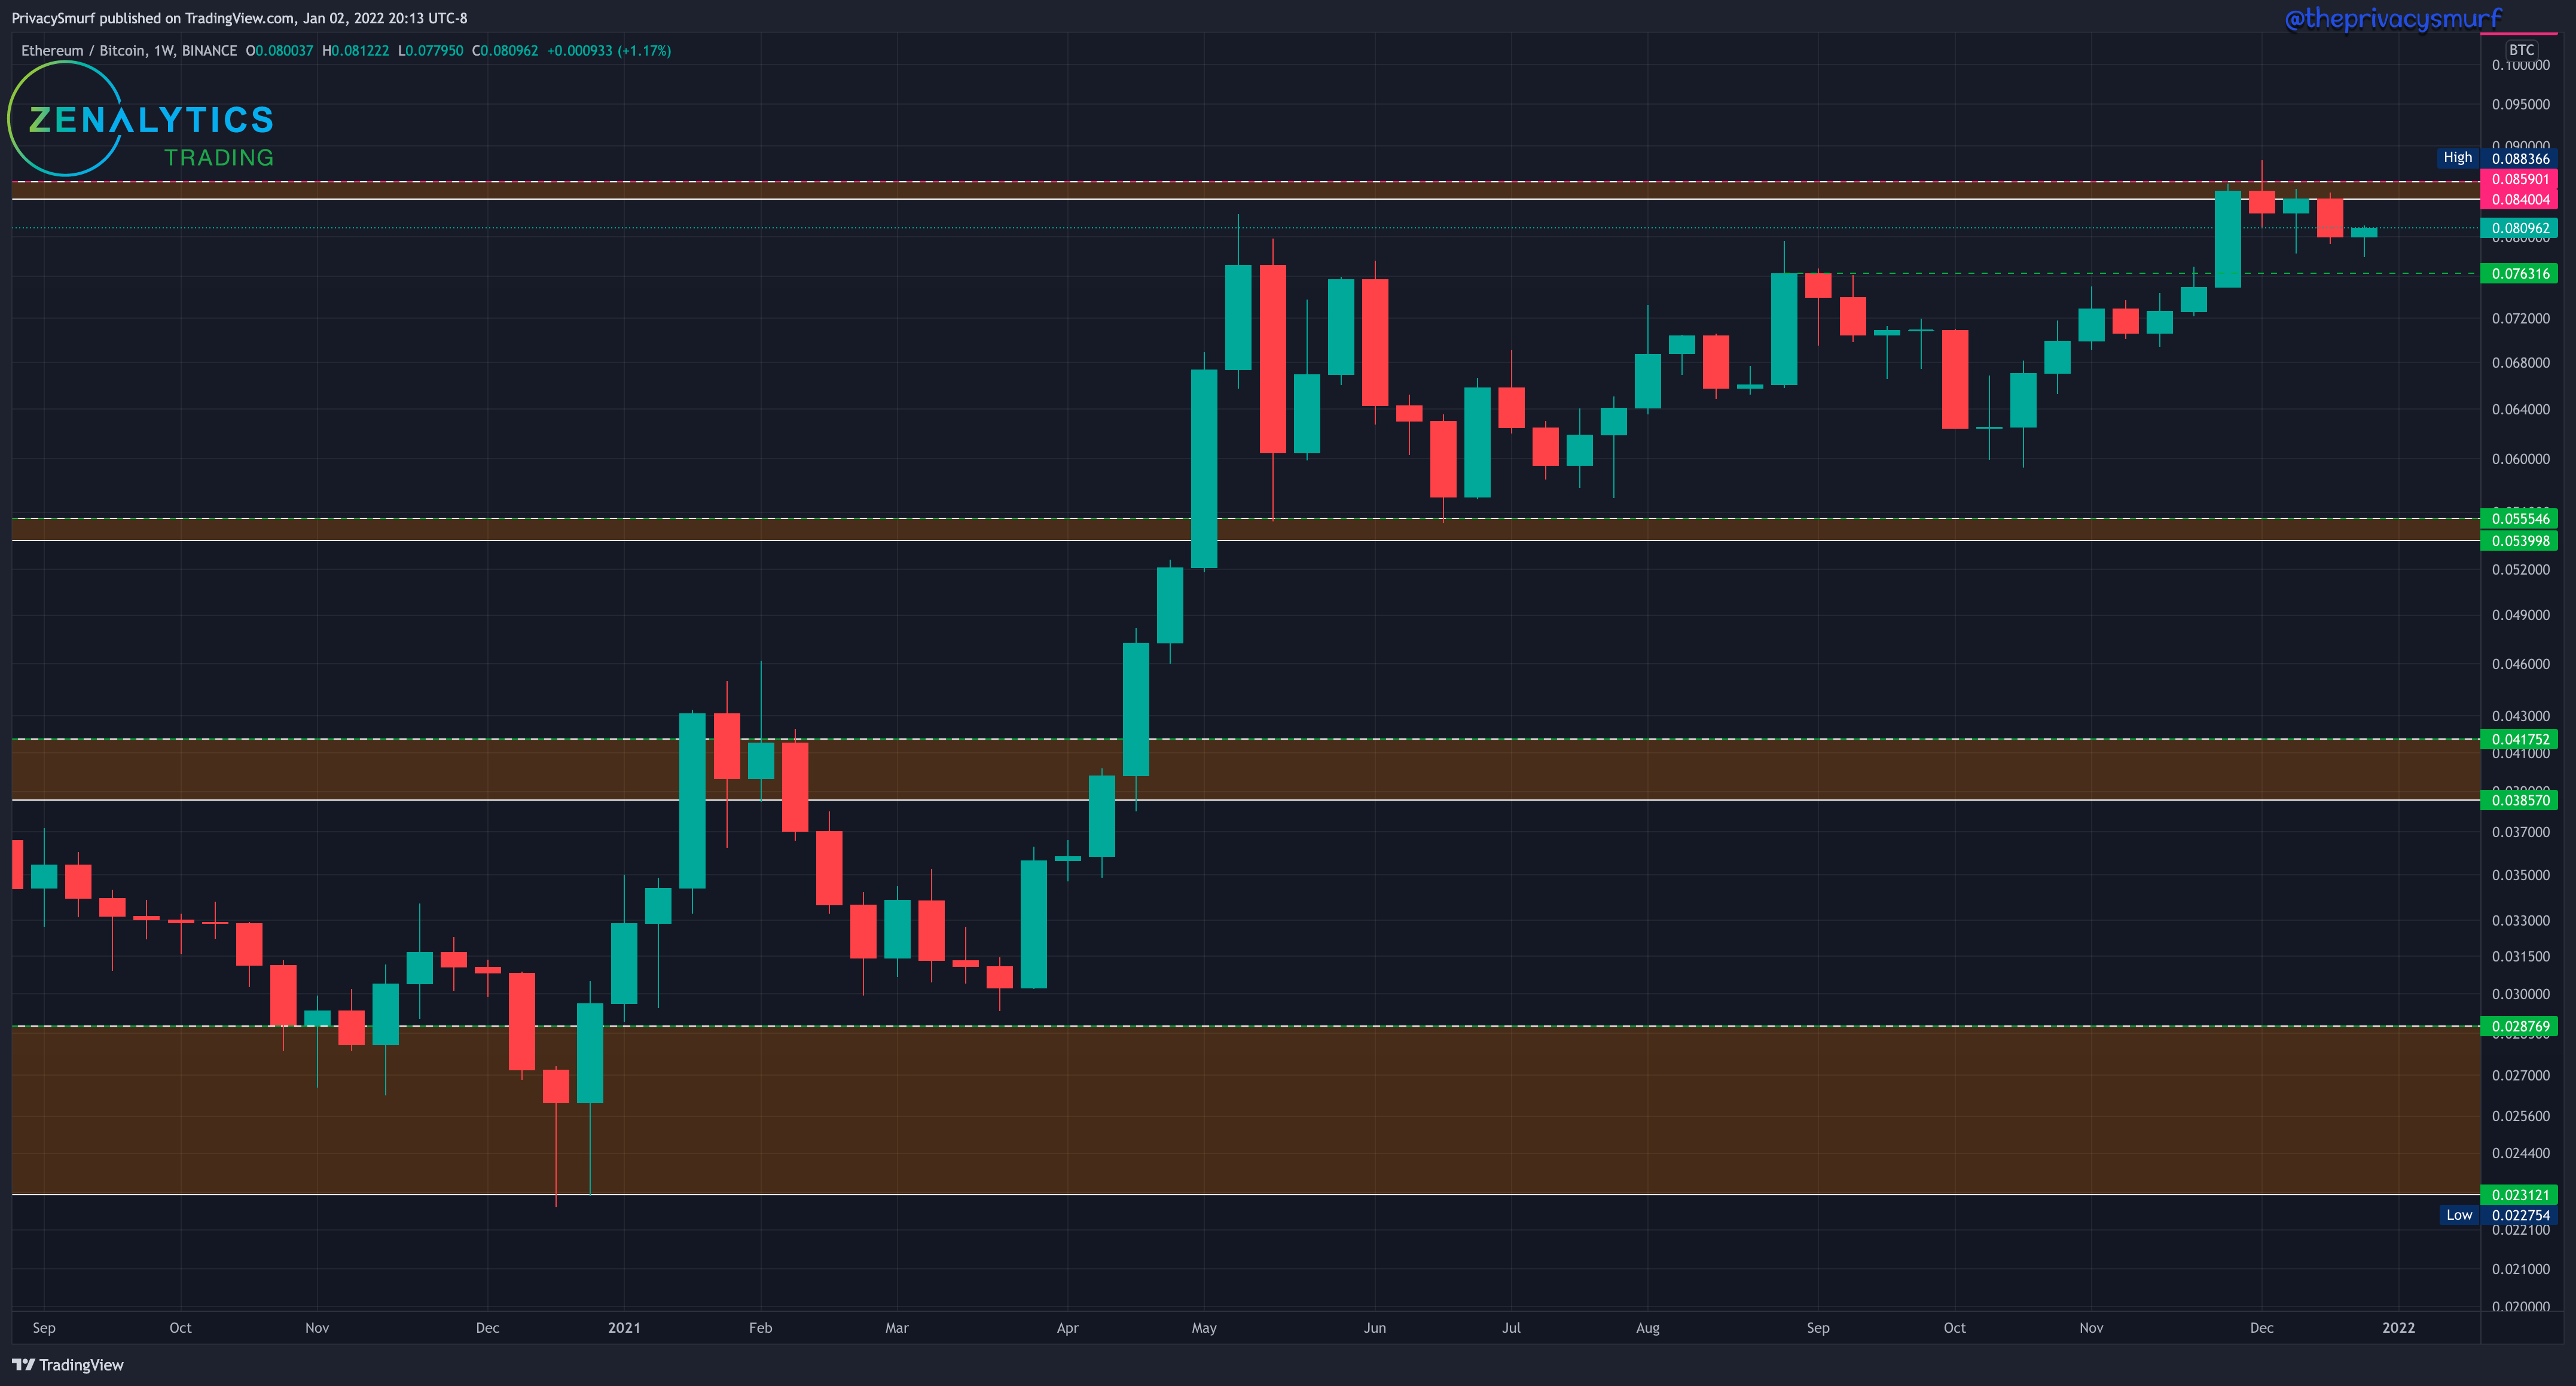
The ETH/BTC weekly chart show the further retracement from the high resistance. The latest week closed as a bullish hammer candle which many view as a sign of a reversal (which i’m not a fan of —> candlestick pattern post) but there’s still room to the downside before that reversal comes. Support is at the 0.0763 mark. With this chart and the BTC chart ranging between supports and resistances, there really isn’t a play to be made rotating long-term positions between the two assets. A close above the resistance at 0.0859 would signal ETH to gain in percent over BTC for the following weeks.
ETH/BTC Daily Chart
https://www.tradingview.com/chart/gTkSjkj6/
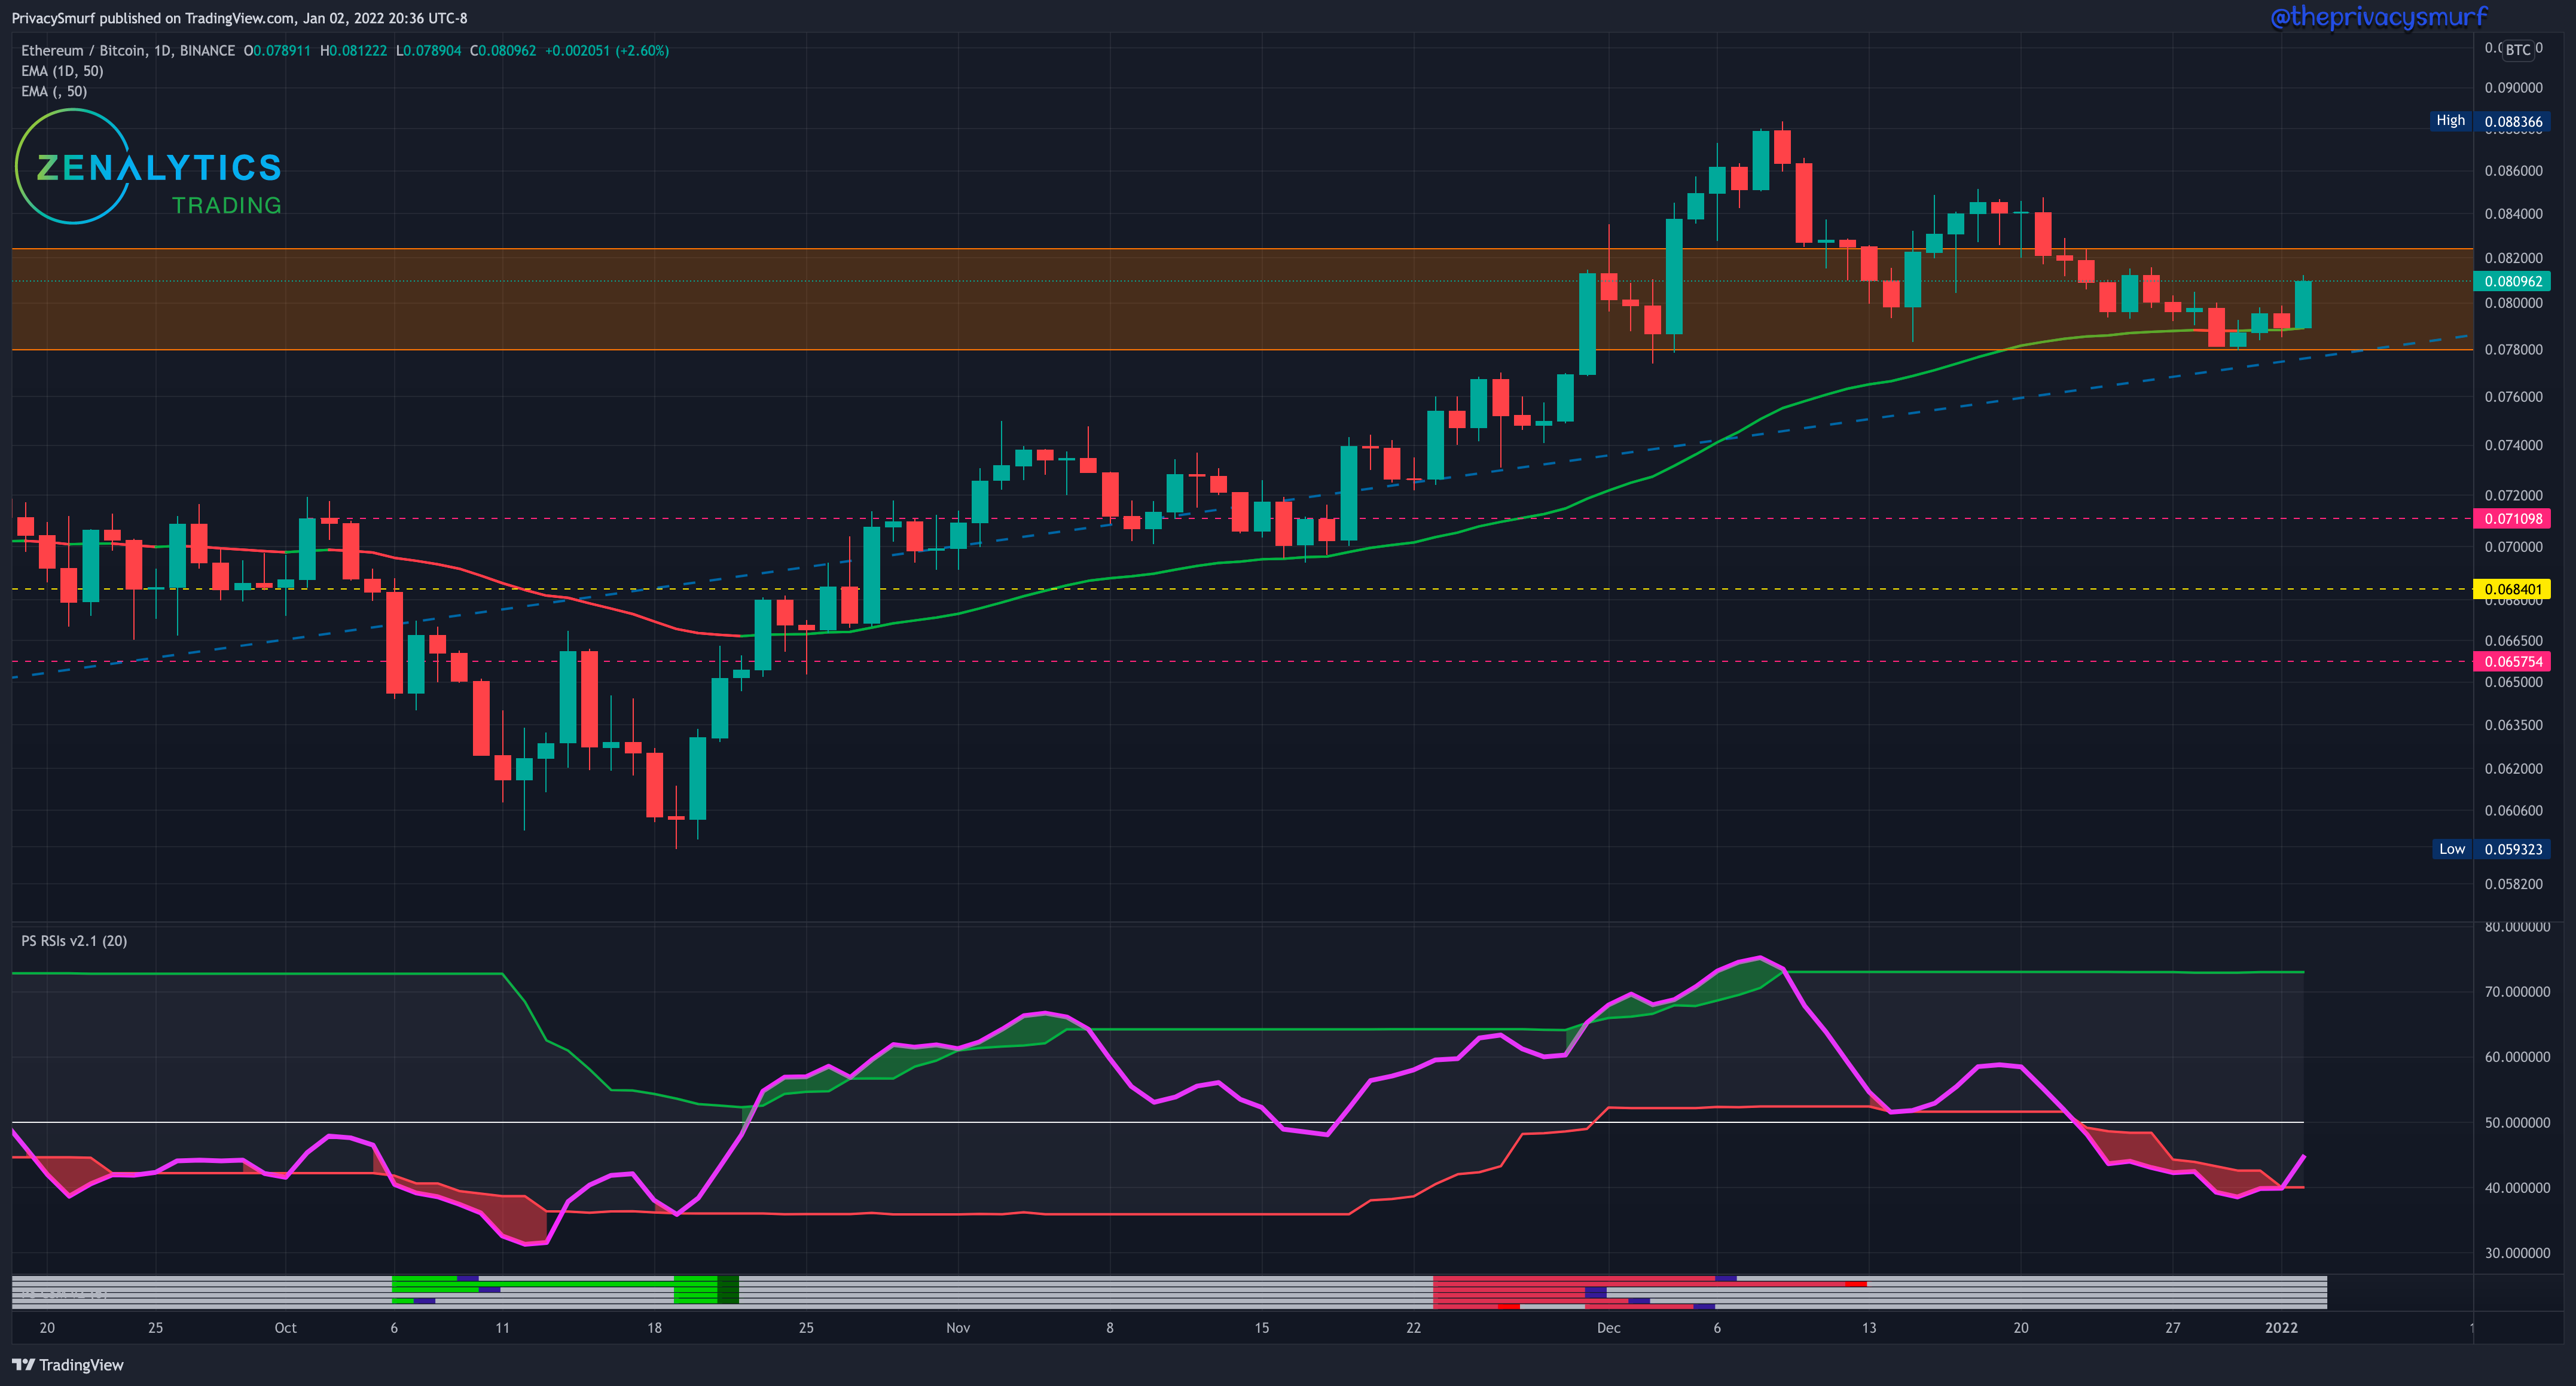
This daily chart shows the long-term ascending trendline and the 50-Day EMA holding as support. With the RSI curling back above the bottom band, I’d expect the chart to continue up to test the resistance high somewhere around 0.083 - 0.085. The RSI is trending in line with the price so there’s no reason to expect out-of-the-ordinary price action at supports and resistance. They will likely hold without an excess of volume when they arrive at them. Watching price action oscillators for bullish or bearish divergence on an intraday timeframe will likely show if the daily chart resistances and supports will hold.
ETH/USDT Weekly Structure
https://www.tradingview.com/chart/JPTp0aXw/
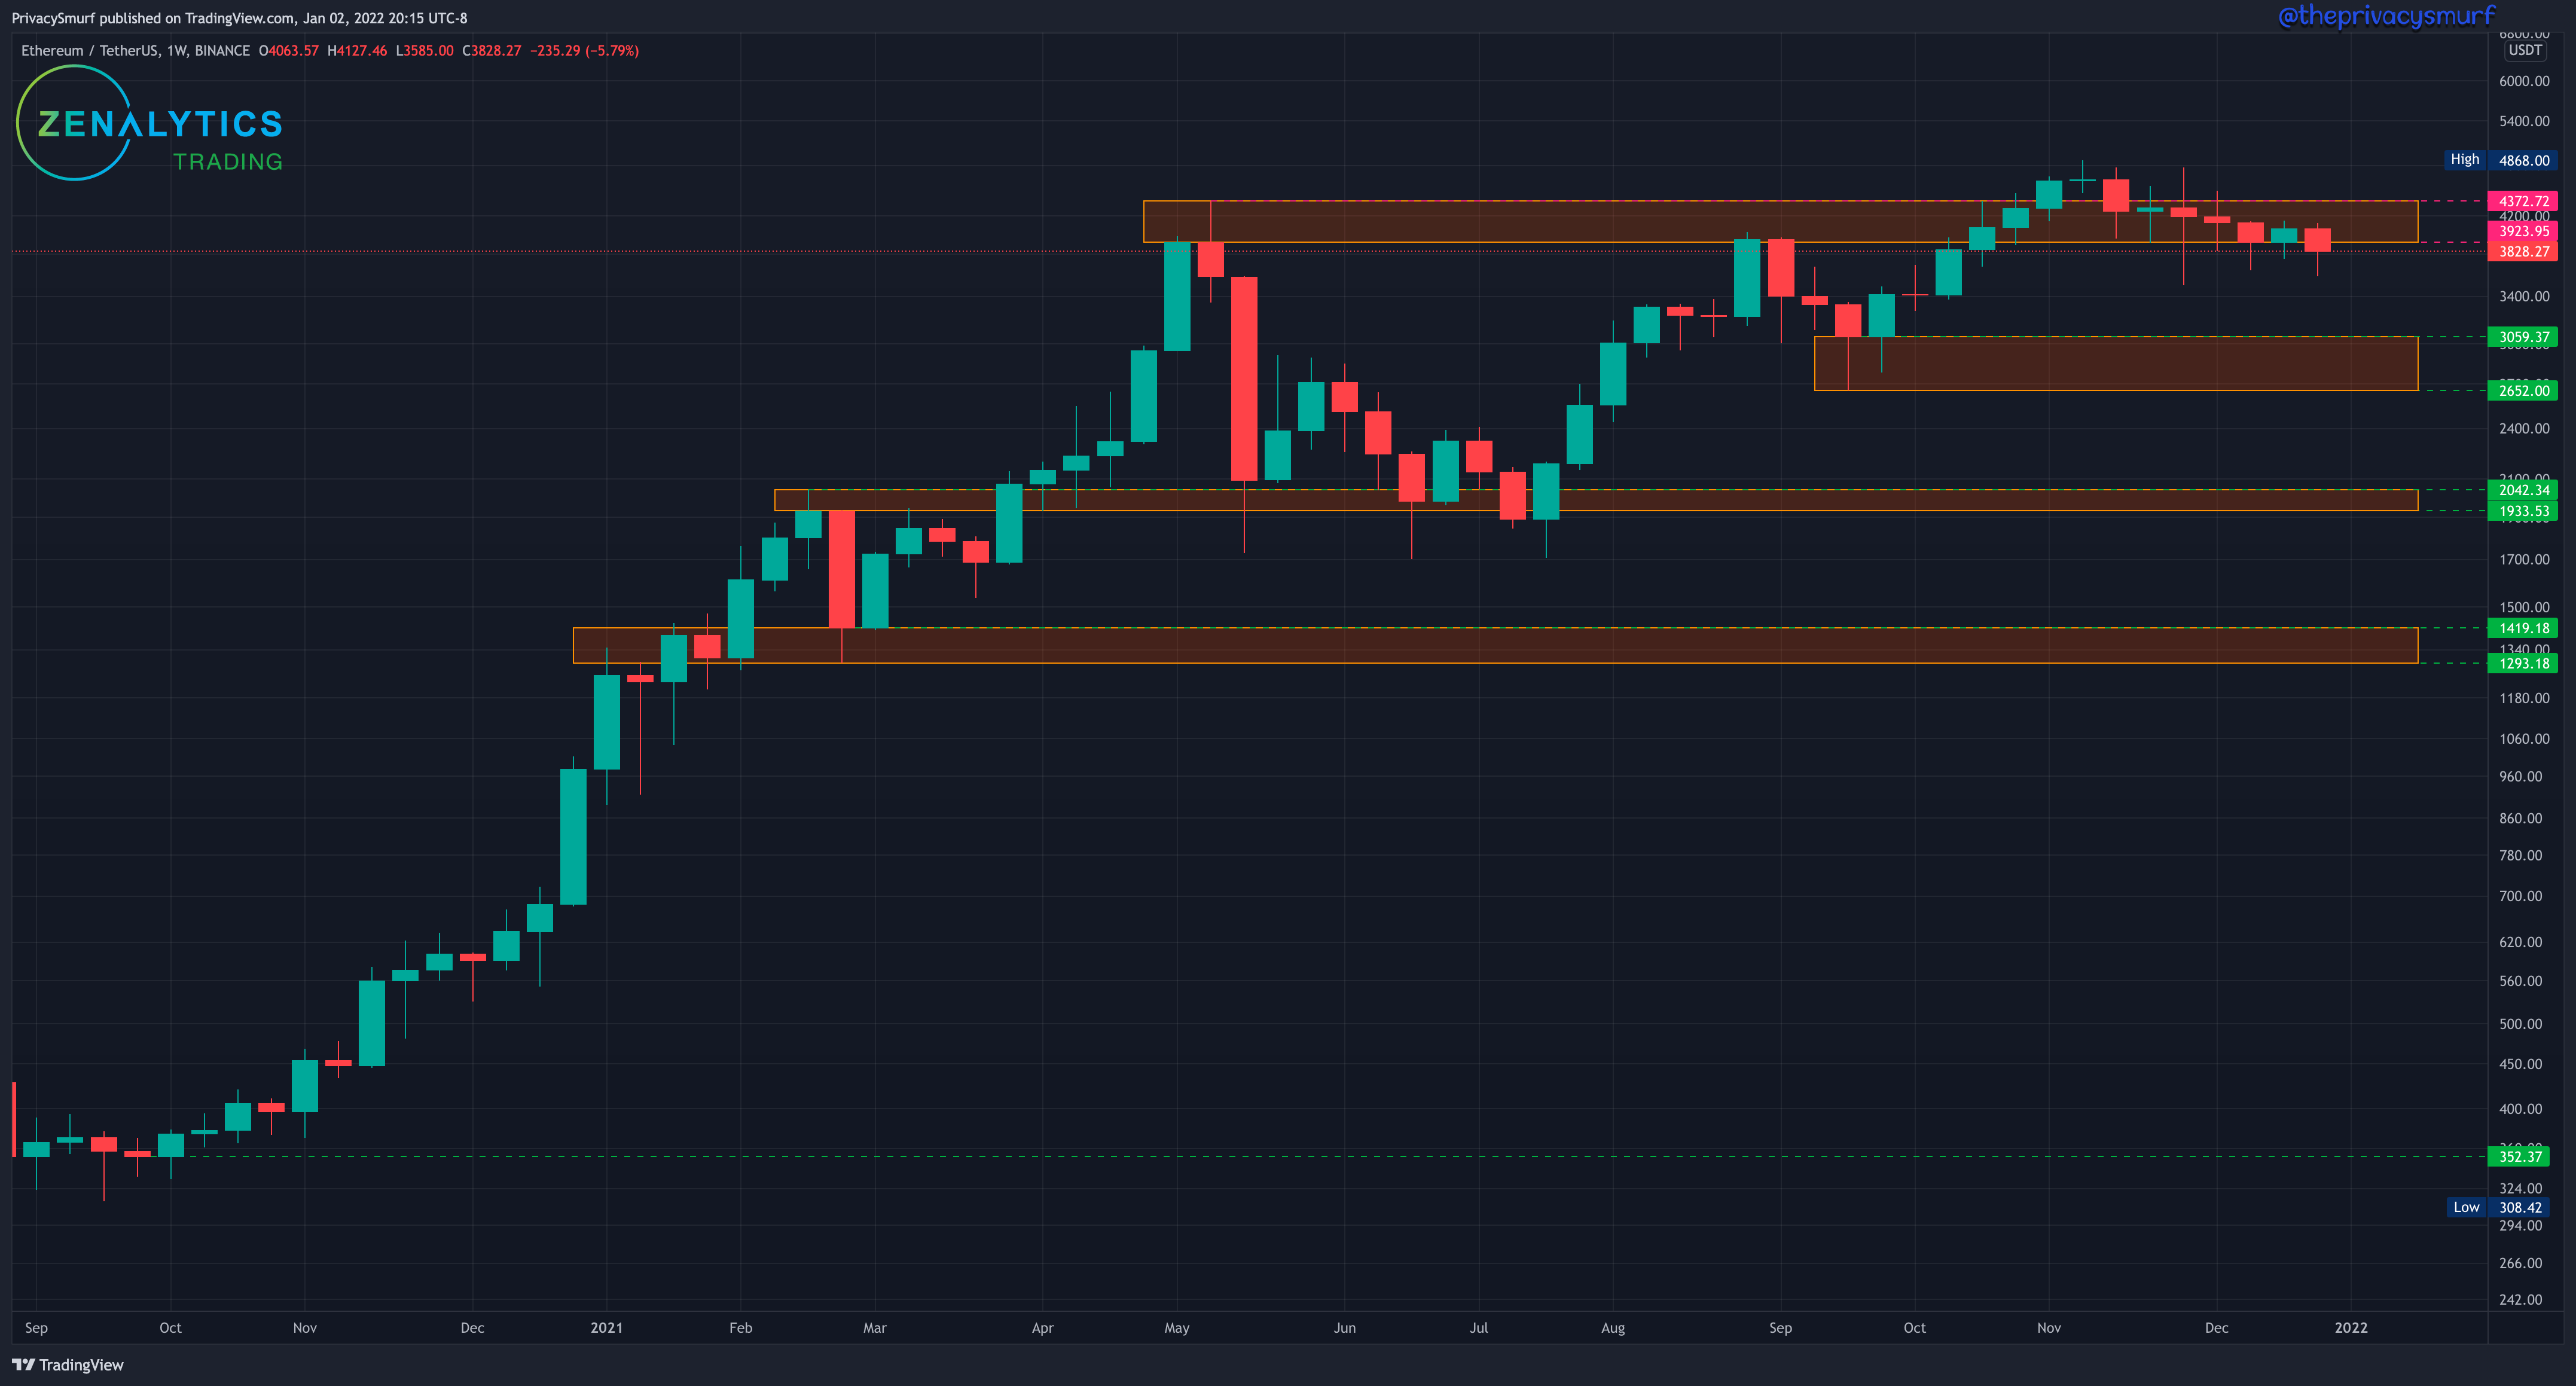
With ETH closing below the weekly resistance zone that doesn’t bode well for the next week. It’s slightly positive to see wicks longer to the downside showing bulls are still actively trying to outbid the sellers. The weekly structure is still bullish until a weekly close below $3059.
ETH/USDT Daily Chart
https://www.tradingview.com/chart/xbB6lkZu/
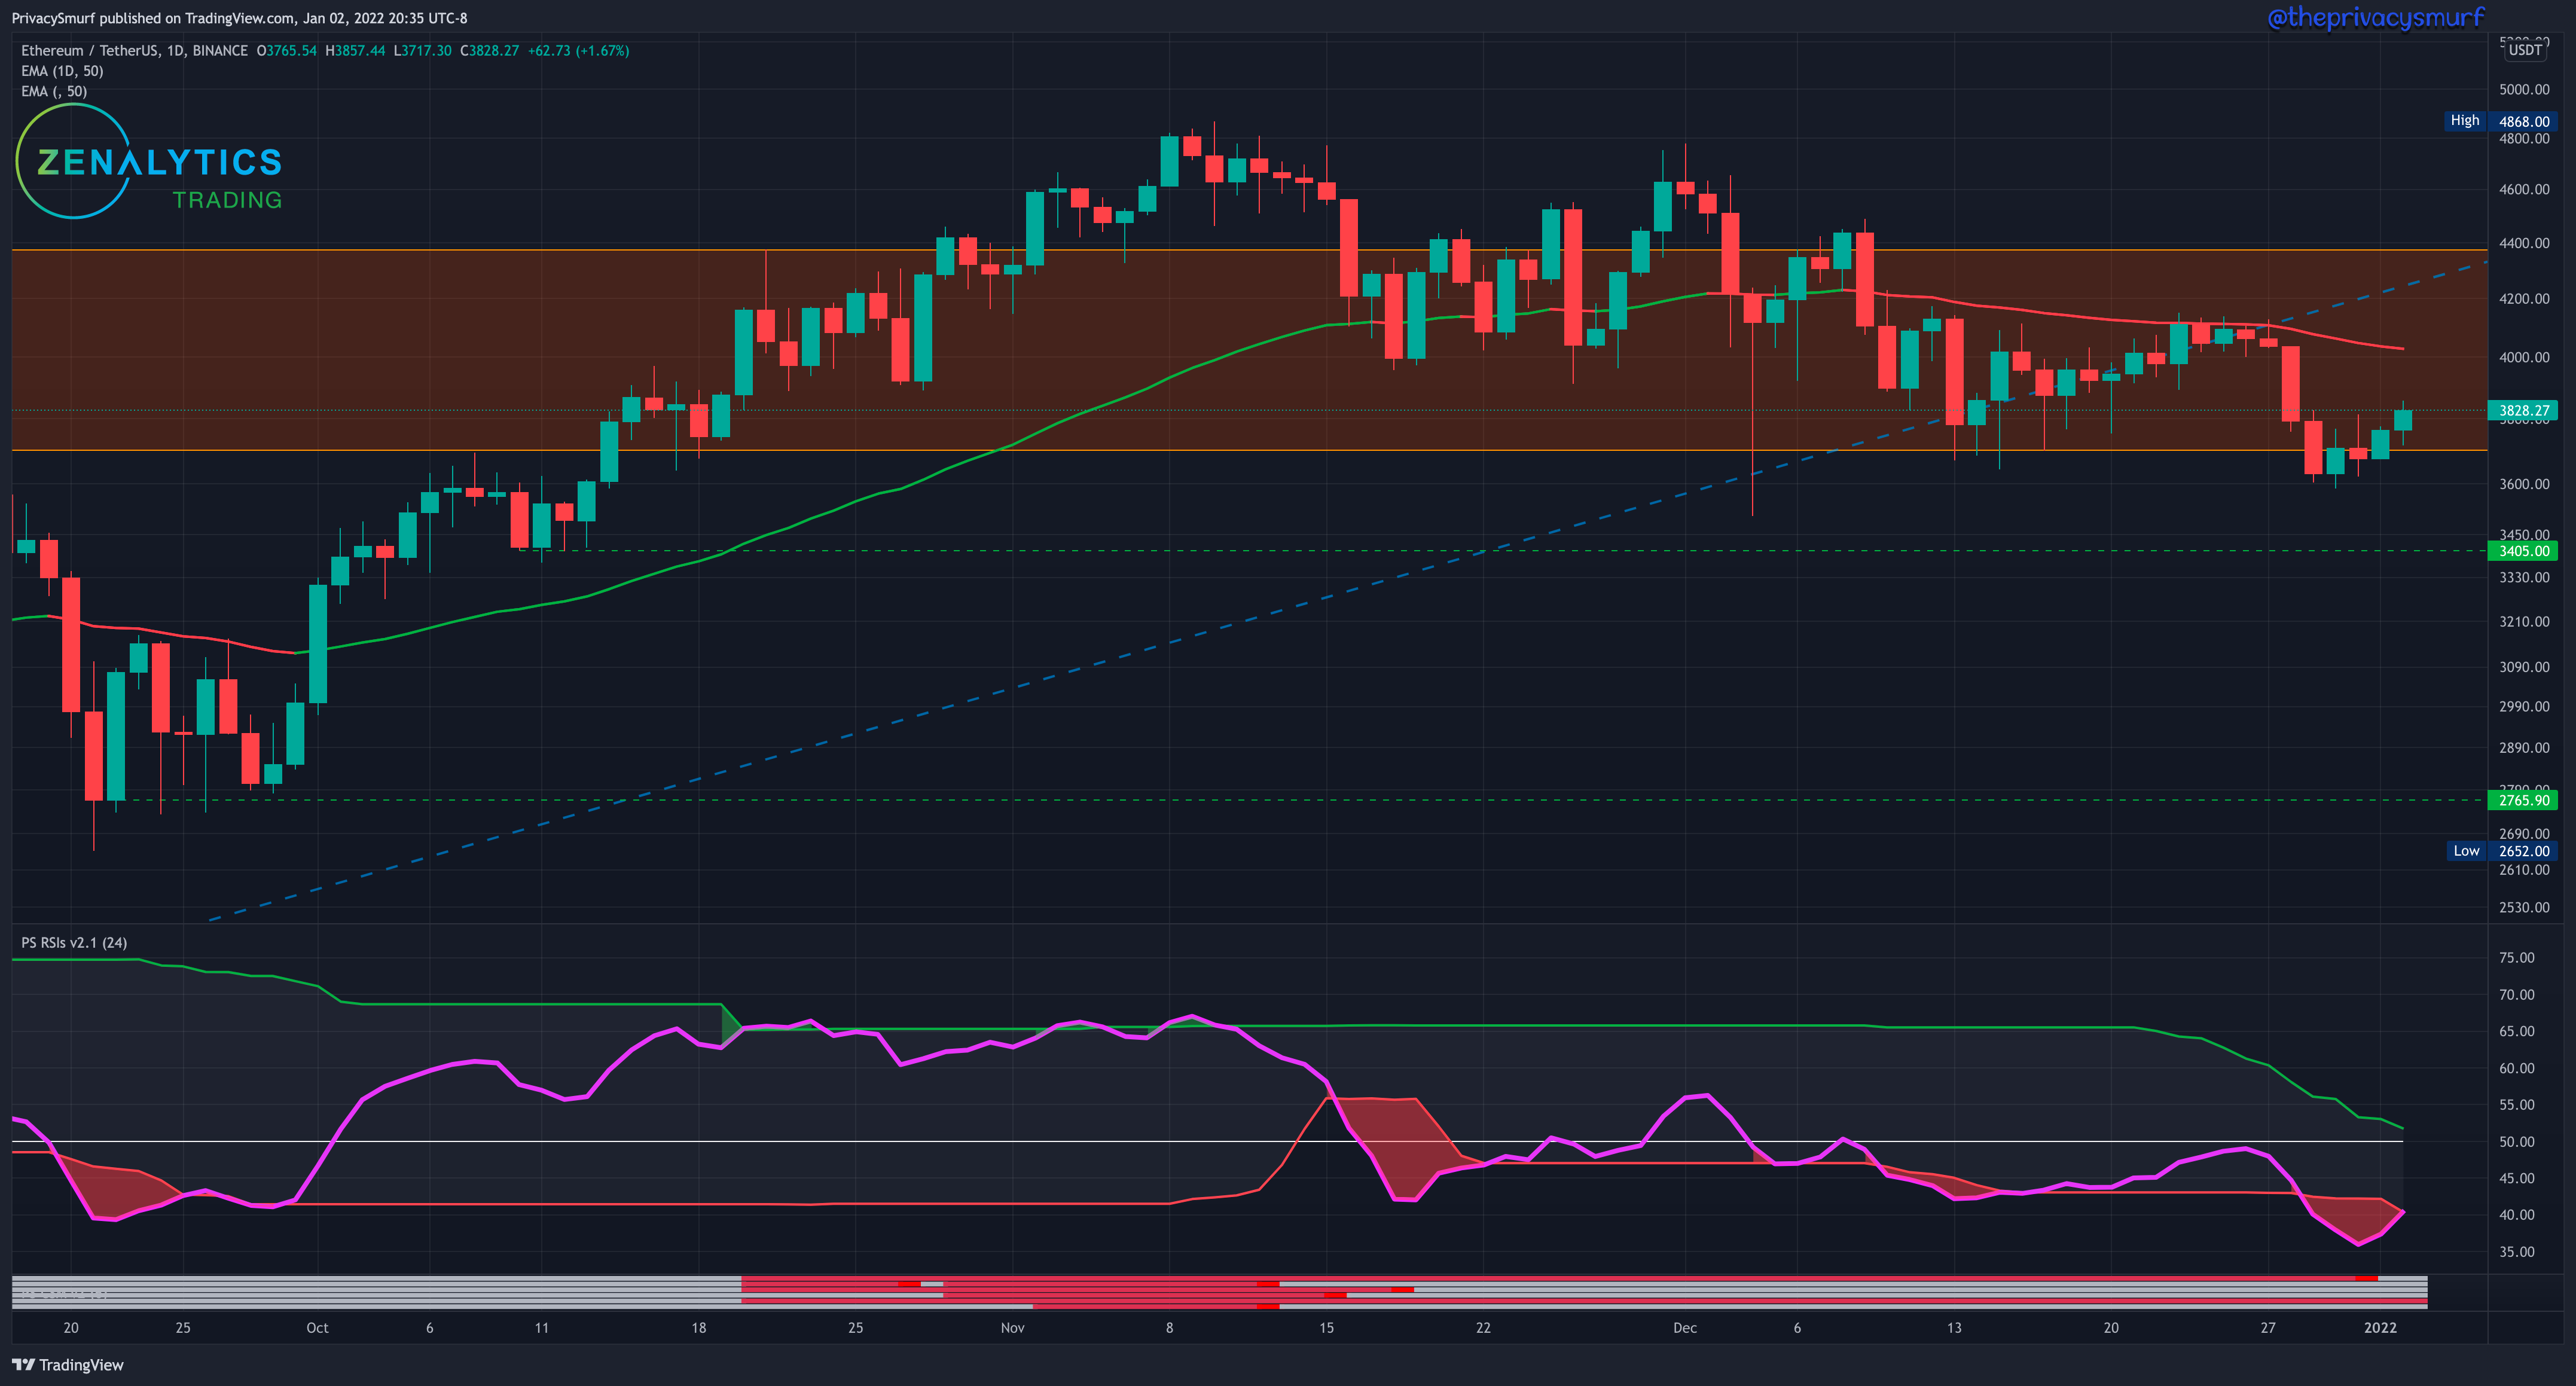
The bearish break from the ascending trendline coincided with the resistance holding at the 50-Day EMA. The RSI overall it trading in line with price at the moment and curling up back above the lower band. I’d expect potentially a test the 50-Day EMA again ($3900-4000). If buyers can hold enough to break the midline of the RSI, the adaptive band is trending down close to the midline, presenting a potential for a bullish break of both bringing on the bullish price appreciation. I am not anticipating much above the EMA though at the moment. If that does break through the ascending trendline is now acting as resistance along with the top of the support zone at around $4400. It looks like we may see the same ranging here as in bitcoin, in this case between, $3600 and $4400. Again, no movement is something to be excited or worried about until it’s outside the range.
The next post will be out Wednesday for paid subscribers with the mid-week update. This week will be interesting as potential new institutional volume can completely render everything here invalid. That’s ok. It’s not really something you can objectively forecast, it’s just intuition.
@theprivacysmurf