

Sunday Synopsis #27: Under Pressure
Sunday Synopsis #27: Under Pressure
Pressure pushing down on me, pressing down on you, no man ask for. Under pressure that burns a building down, splits a family in two, puts people on streets.

This isn’t a real video btw. It’s a digital creation if you can’t tell. They apparently never performed this live together, which is unfortunate.
Thanks for giving me a day to collect myself after the technical difficulties. I’ll show you down below what new thing I’ll be integrating into the Sunday Synopsis every once in a while. I’m unsure of the frequency at the moment for adding it to the newsletter analysis. Without any more delays let’s get into the analysis and look at what that selling pressure is doing so we can keep you off of the streets.
BTC/USDT Weekly Structure
https://www.tradingview.com/chart/4v8qizyI/
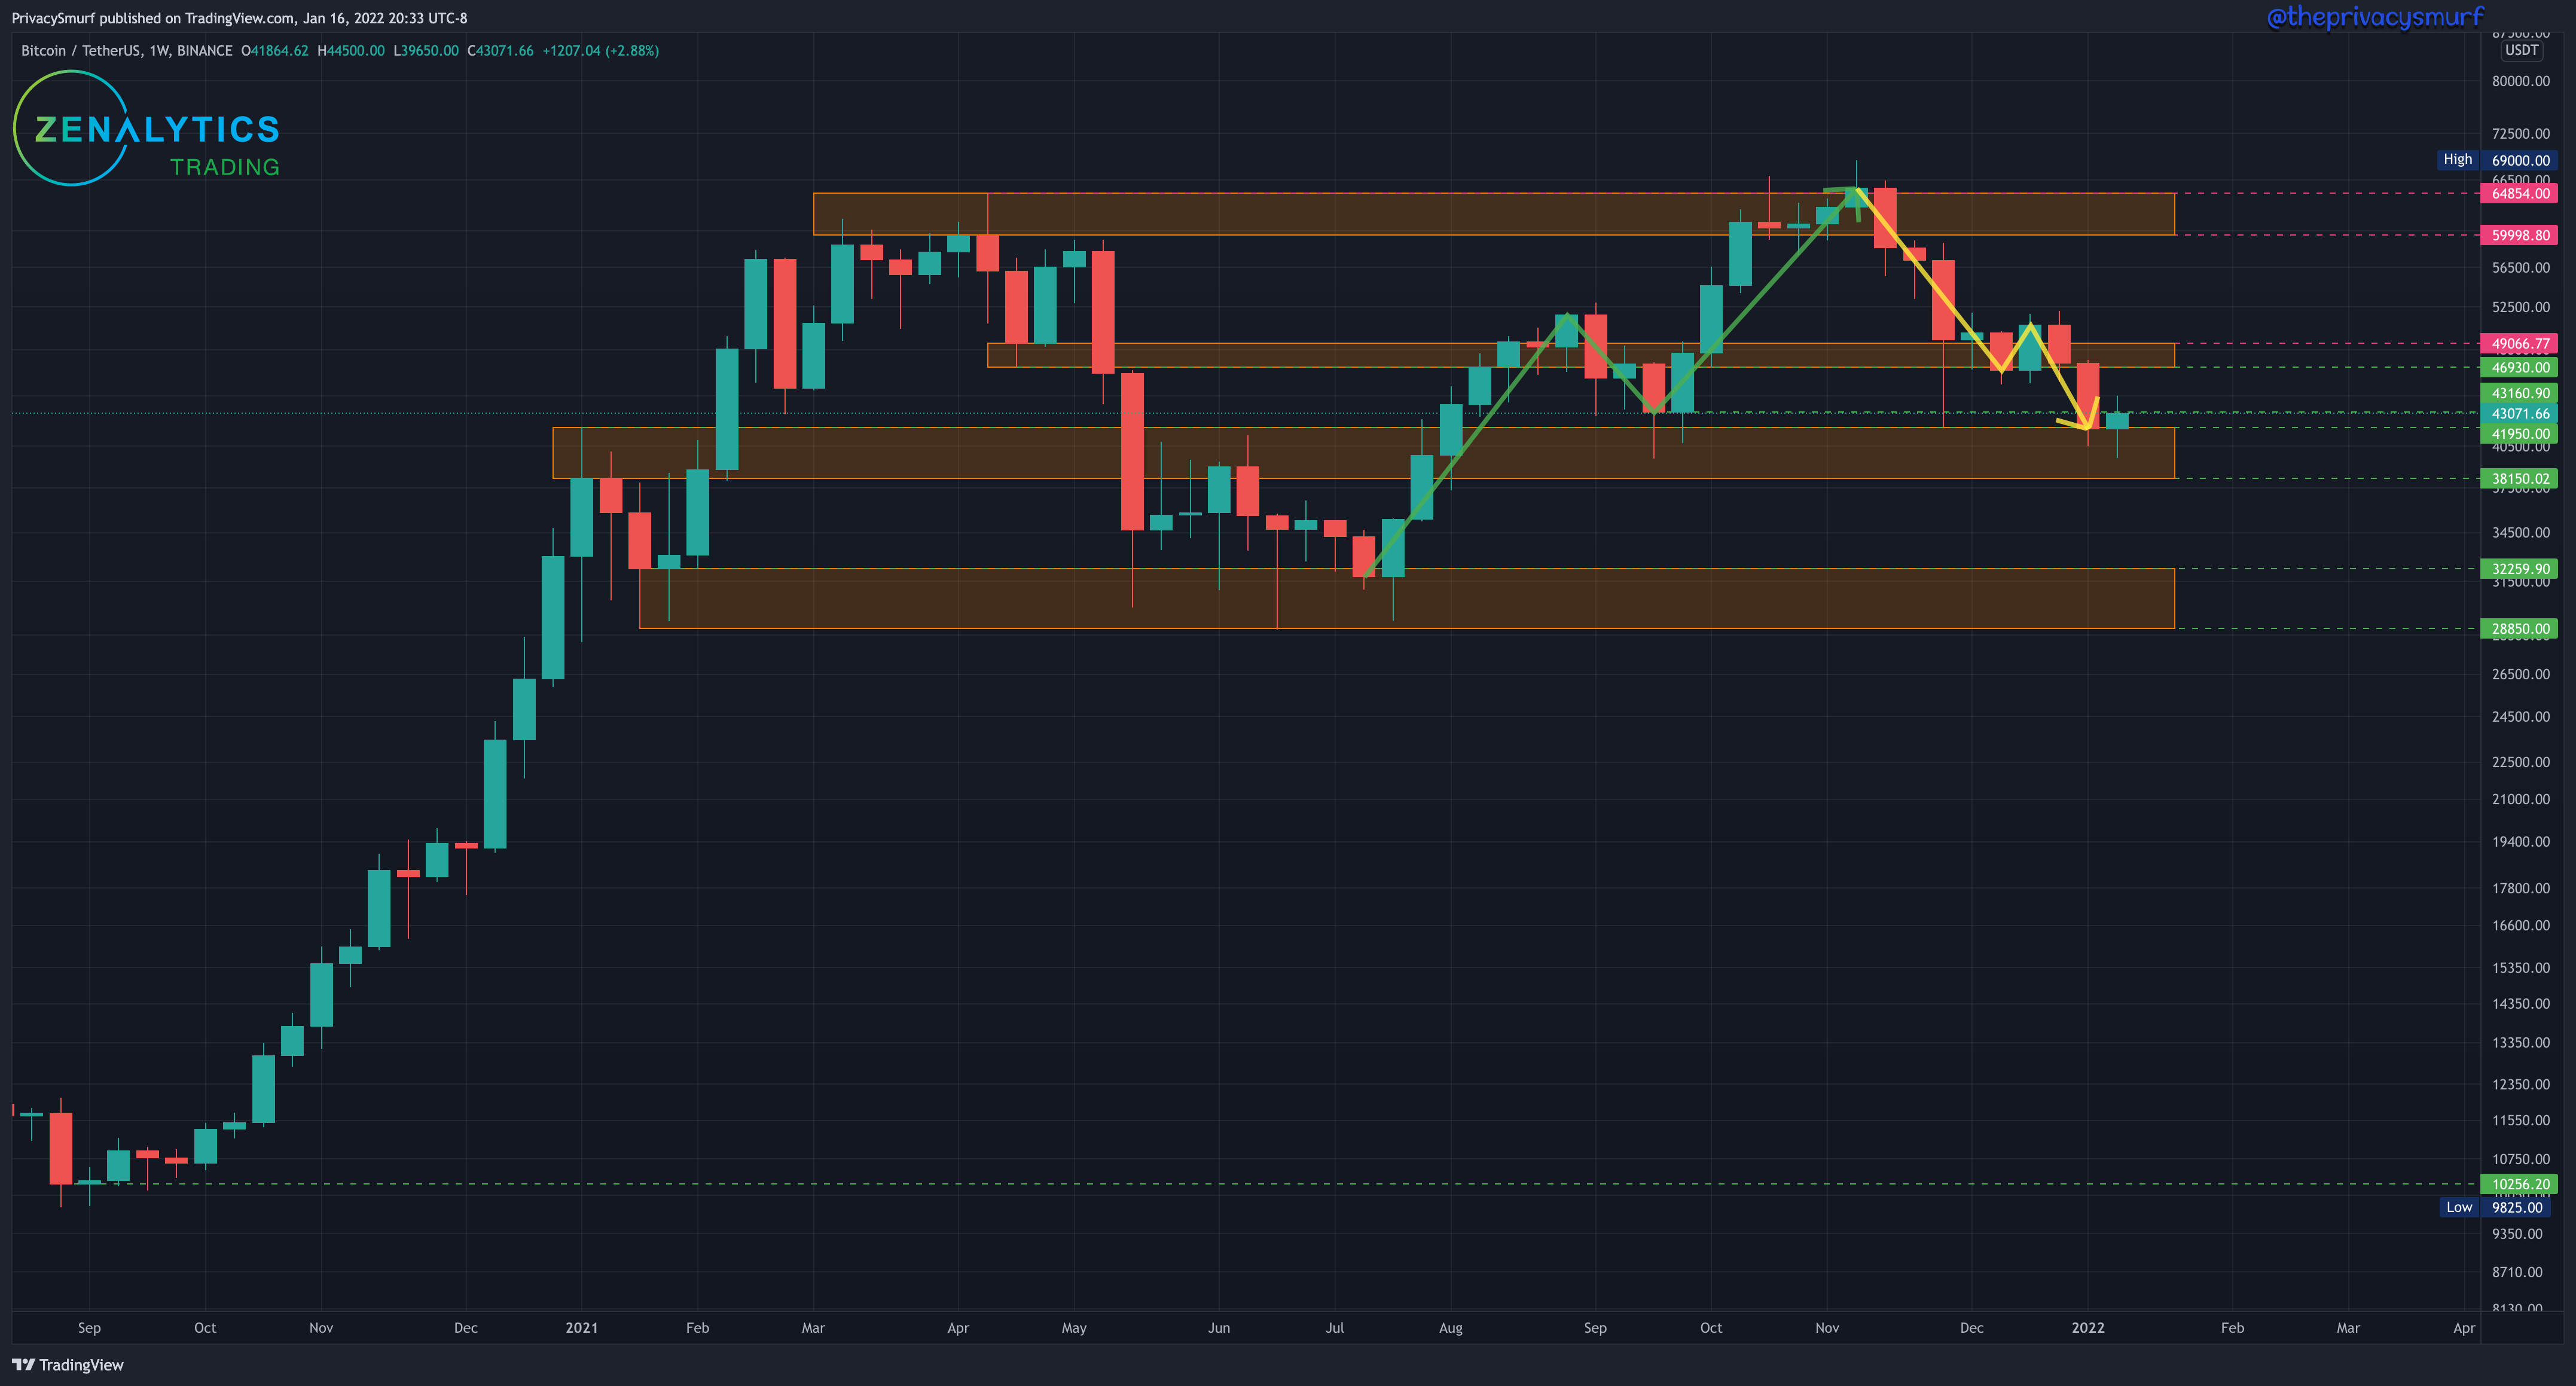
A bullish week but nowhere near the response you’d want to see from a bounce off of a major support level. With the trend now being technically classified as ‘bullish consolidation,’ there are two things we are looking for now.
To establish a new Bullish Trend:
A weekly close ABOVE $50.7k.
A pivot down from the above weekly close with a close no lower than $41.8.
A rally from there with a new higher high close above the above pivot.
OR
To establish a Bearish Trend:
A rally and weekly close UNDER $50.7k.
A failure pivot from the above close and a new lower close under $41.8
These two scenarios will require a few weeks to play out so it’s not a time-sensitive matter but it’s helpful to know what steps/criteria to look for. With this chart, I’d expect some more bullish price action (weak though). The daily chart will give us a better idea of the week to come.
BTC/USDT Daily Chart
https://www.tradingview.com/chart/jjSdFW4b/
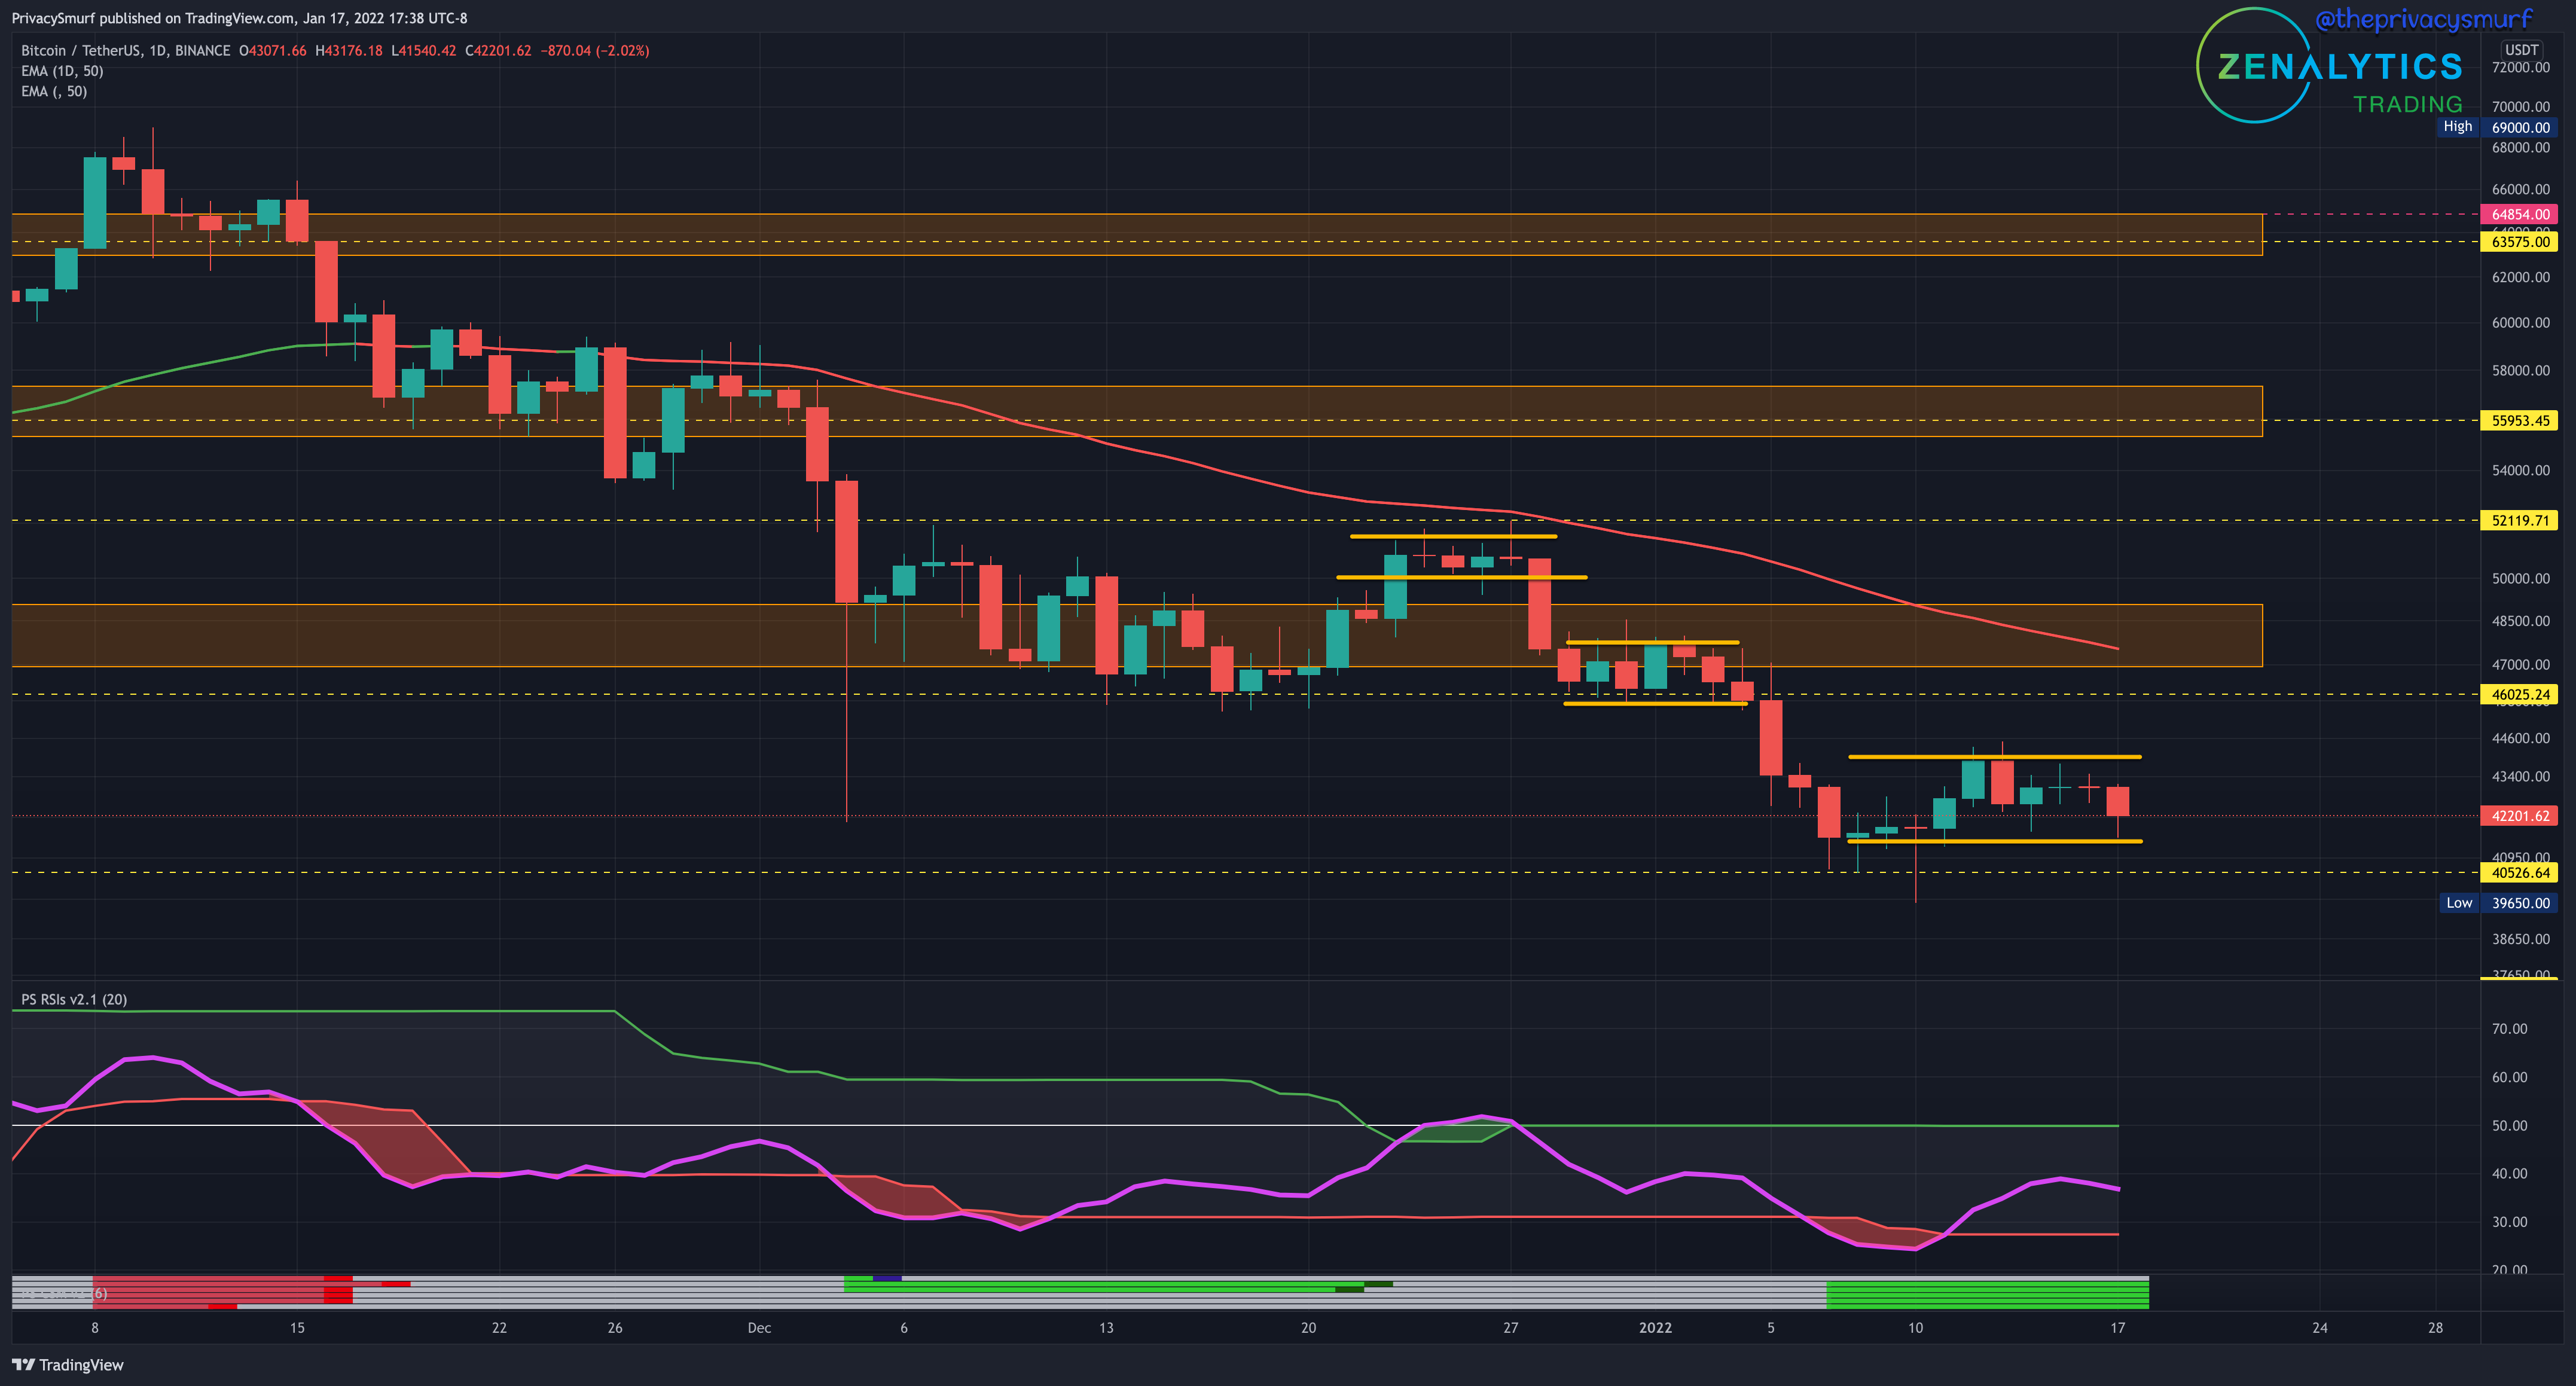
Last week did have some bullish price action but didn’t make it up to the top of the range at 46k. I may need to lower my bullish expectations as the downtrend is muting all the bullish rallies. I highlighted some pockets of price compression. When this starts happening my bias tends to lean more in the direction of the underlying trend so trading under the 50-Day EMA and being in a long-established downtrend these periods I typically like to the downside. The chart is in bullish divergence on many oscillators shown by green lines the Smurf Correction Strenght Meter on the bottom of the charm but it is NOT in divergence on the RSI. The price is trading in alignment with the RSI. With the RSI peaked and trending down again I think we have more ranging between $41.5 and $43.8 early in the week and this may break to the downside later if the RSI can’t pick up. There is still support at the $40.5k level though and that floor is gonna take some work to eat through but the longer we are there the weaker that floor gets. There are only so many buy orders there to hold up the price.
ETH/BTC Weekly Structure
https://www.tradingview.com/chart/sacHlXOv/
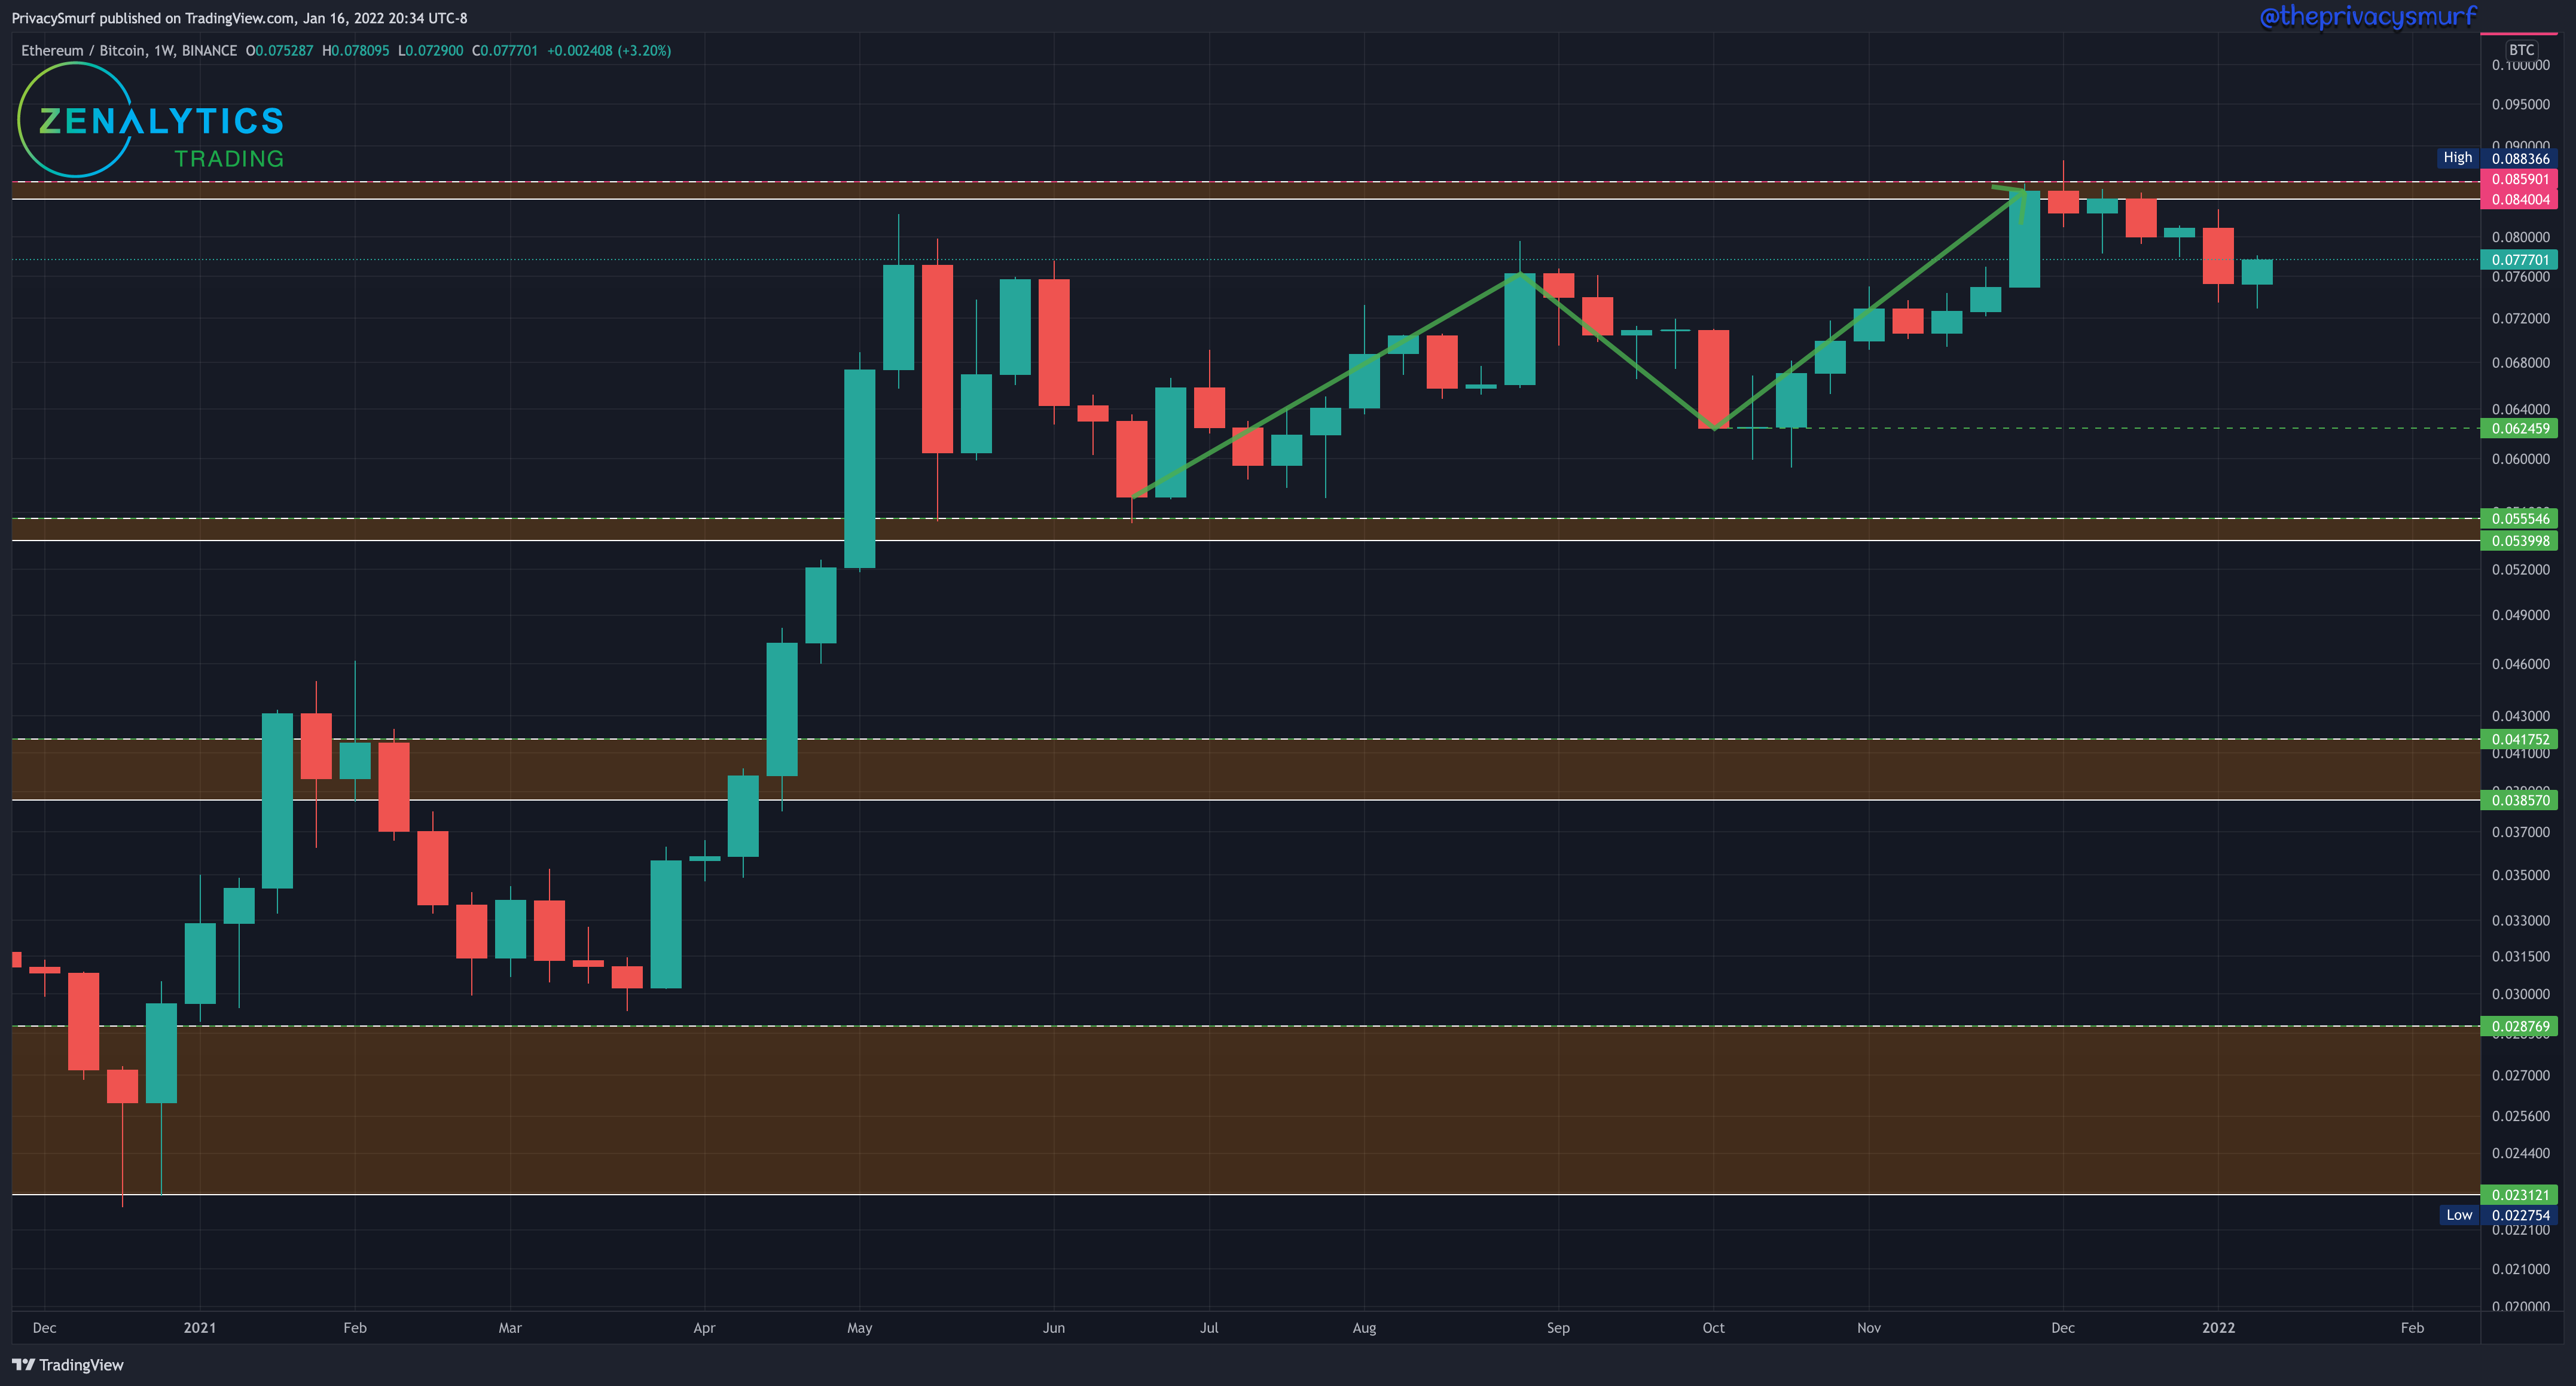
The weekly chart of ETH/BTC showed a matching weak support bounce from the prior market structure support around 0.076. The trend is still bullish. A bullish rally wouldn’t be out of the picture but I’m not expecting a test this week of the high resistance. A daily picture will be necessary to get an idea of what to expect in the week but still, no rotations for medium to long-term positions are indicated between ETH or BTC outside of this 0.076-0.085 range.
ETH/BTC Daily Chart
https://www.tradingview.com/chart/gTkSjkj6/
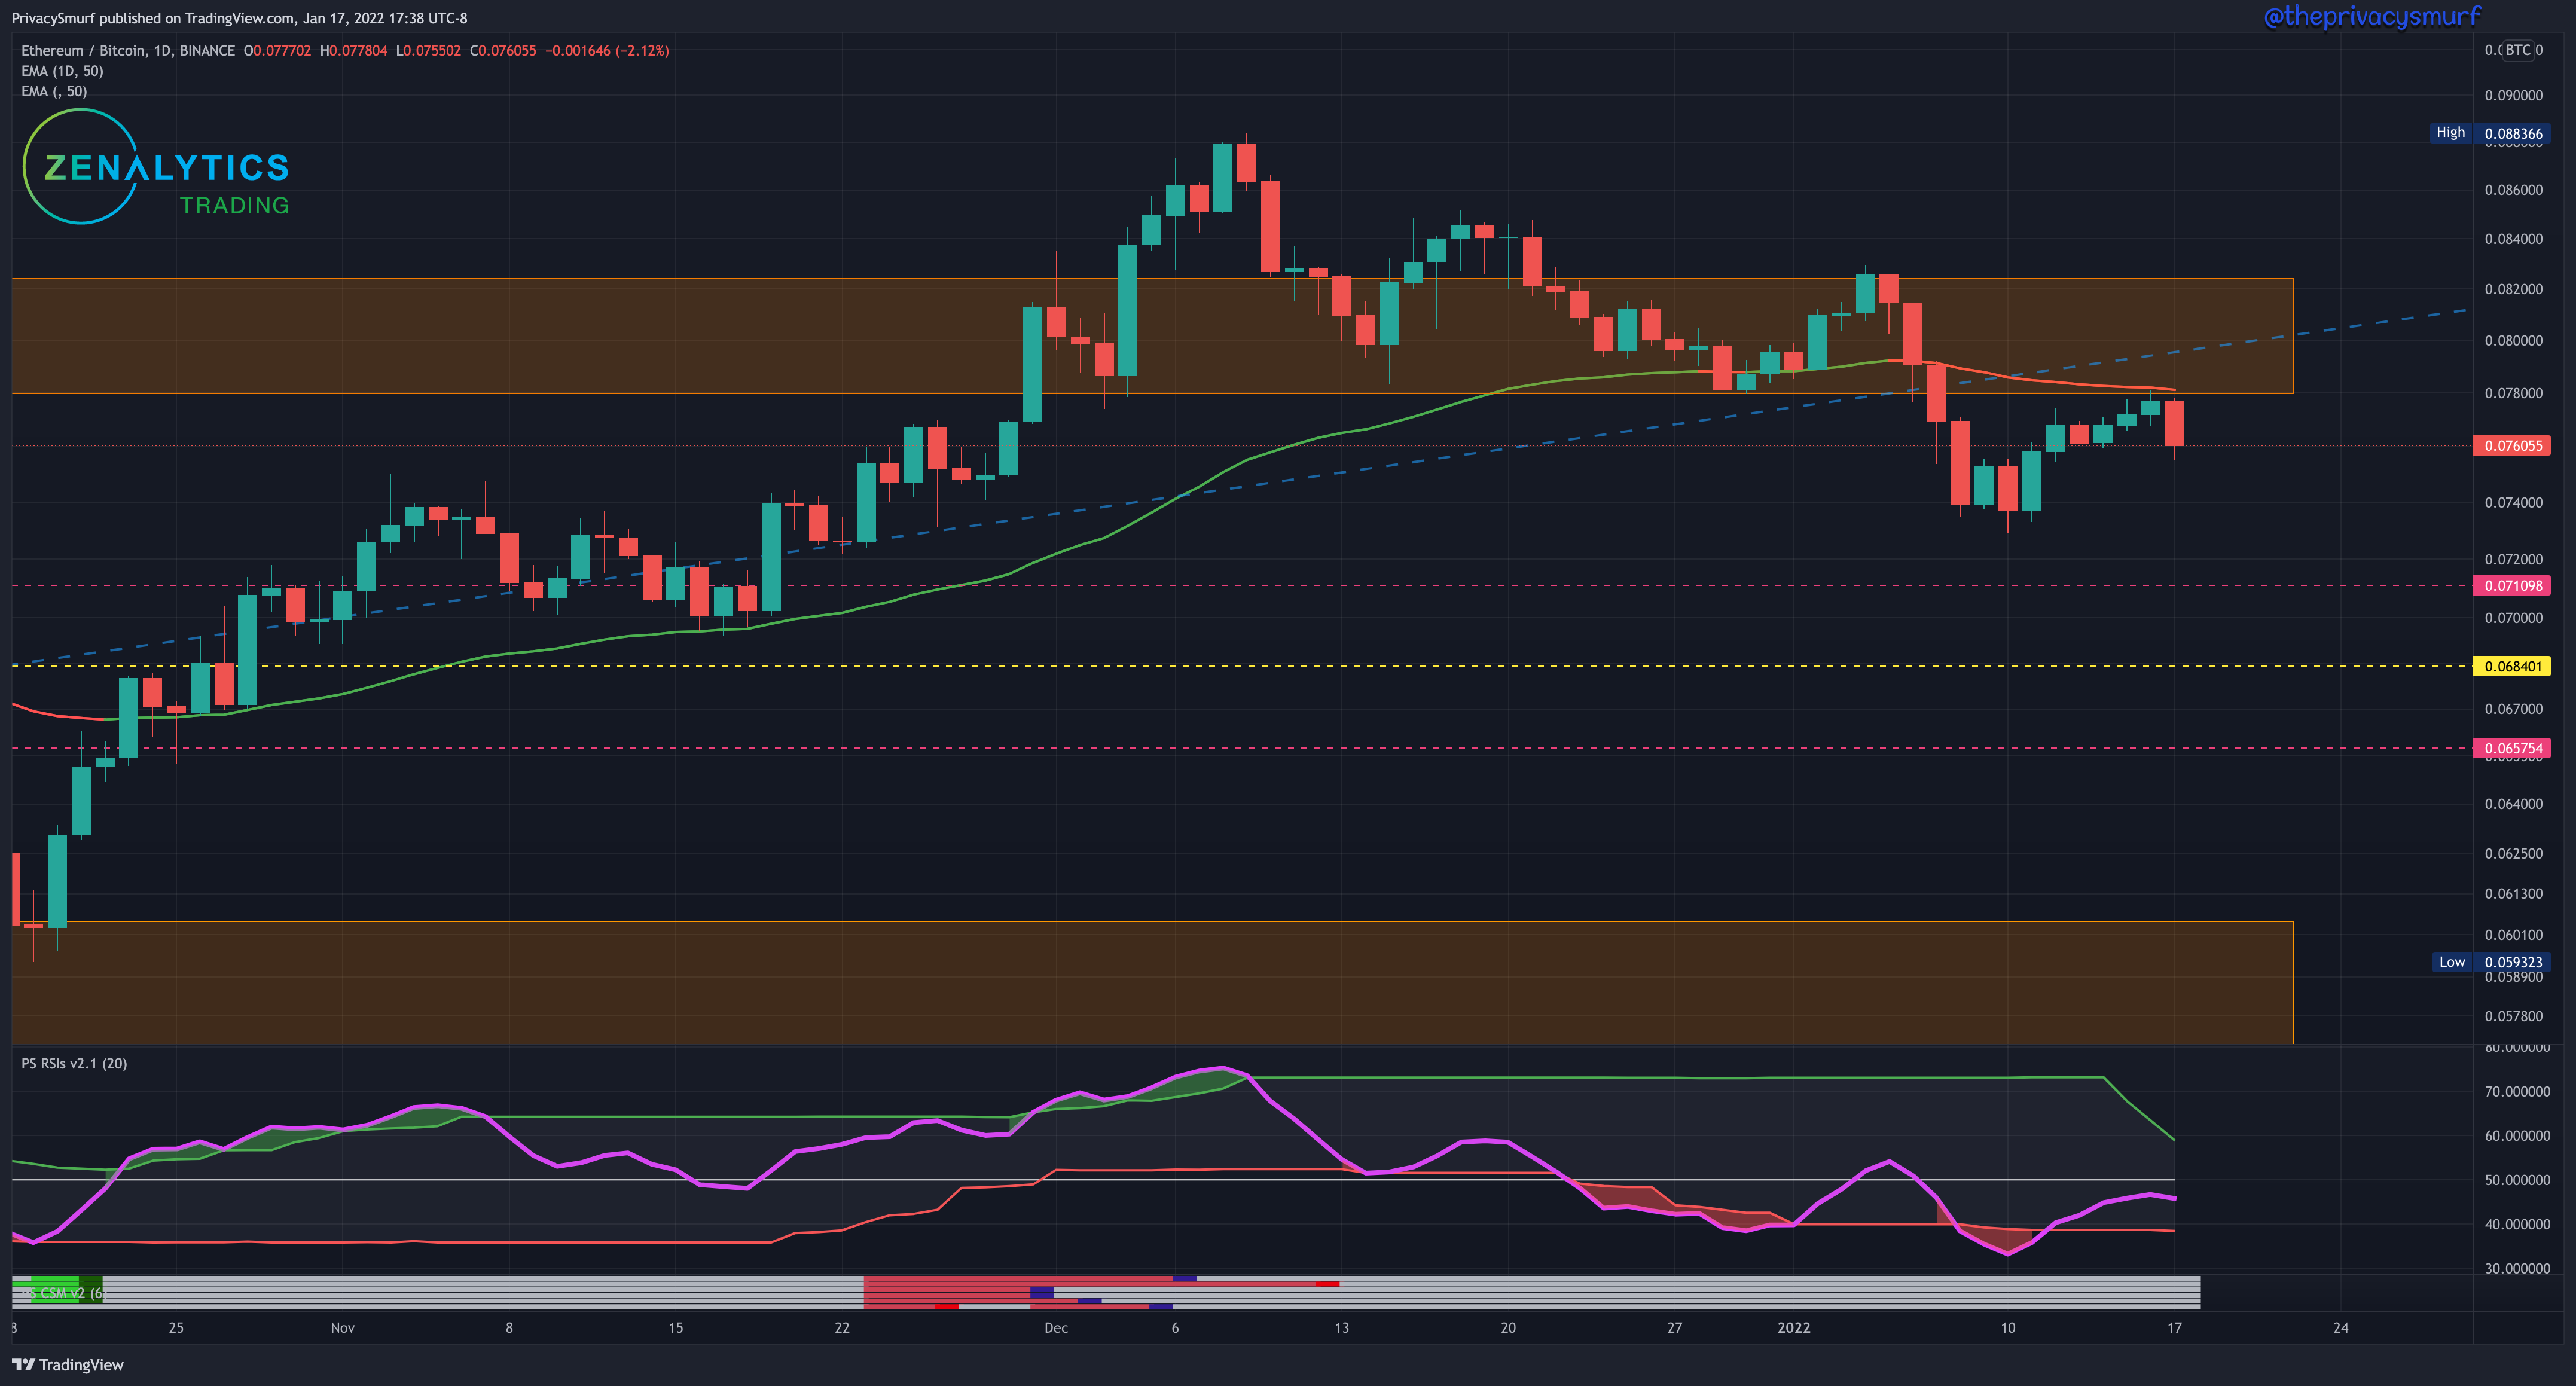
On the daily chart, the 50-Day EMA put in some work held off the buyers. The RSI also didn’t respond positively near the midline of the RSI. With a bearish engulfing candle appearing at resistance, the RSI trending down I’d expect bearish price action in the coming days. Consolidation between the 0.074 pivot point and the 50-Day EMA would be likely with BTC looking weak IF ALSO ETH has a similar picture.
ETH/USDT Weekly Structure
https://www.tradingview.com/chart/JPTp0aXw/
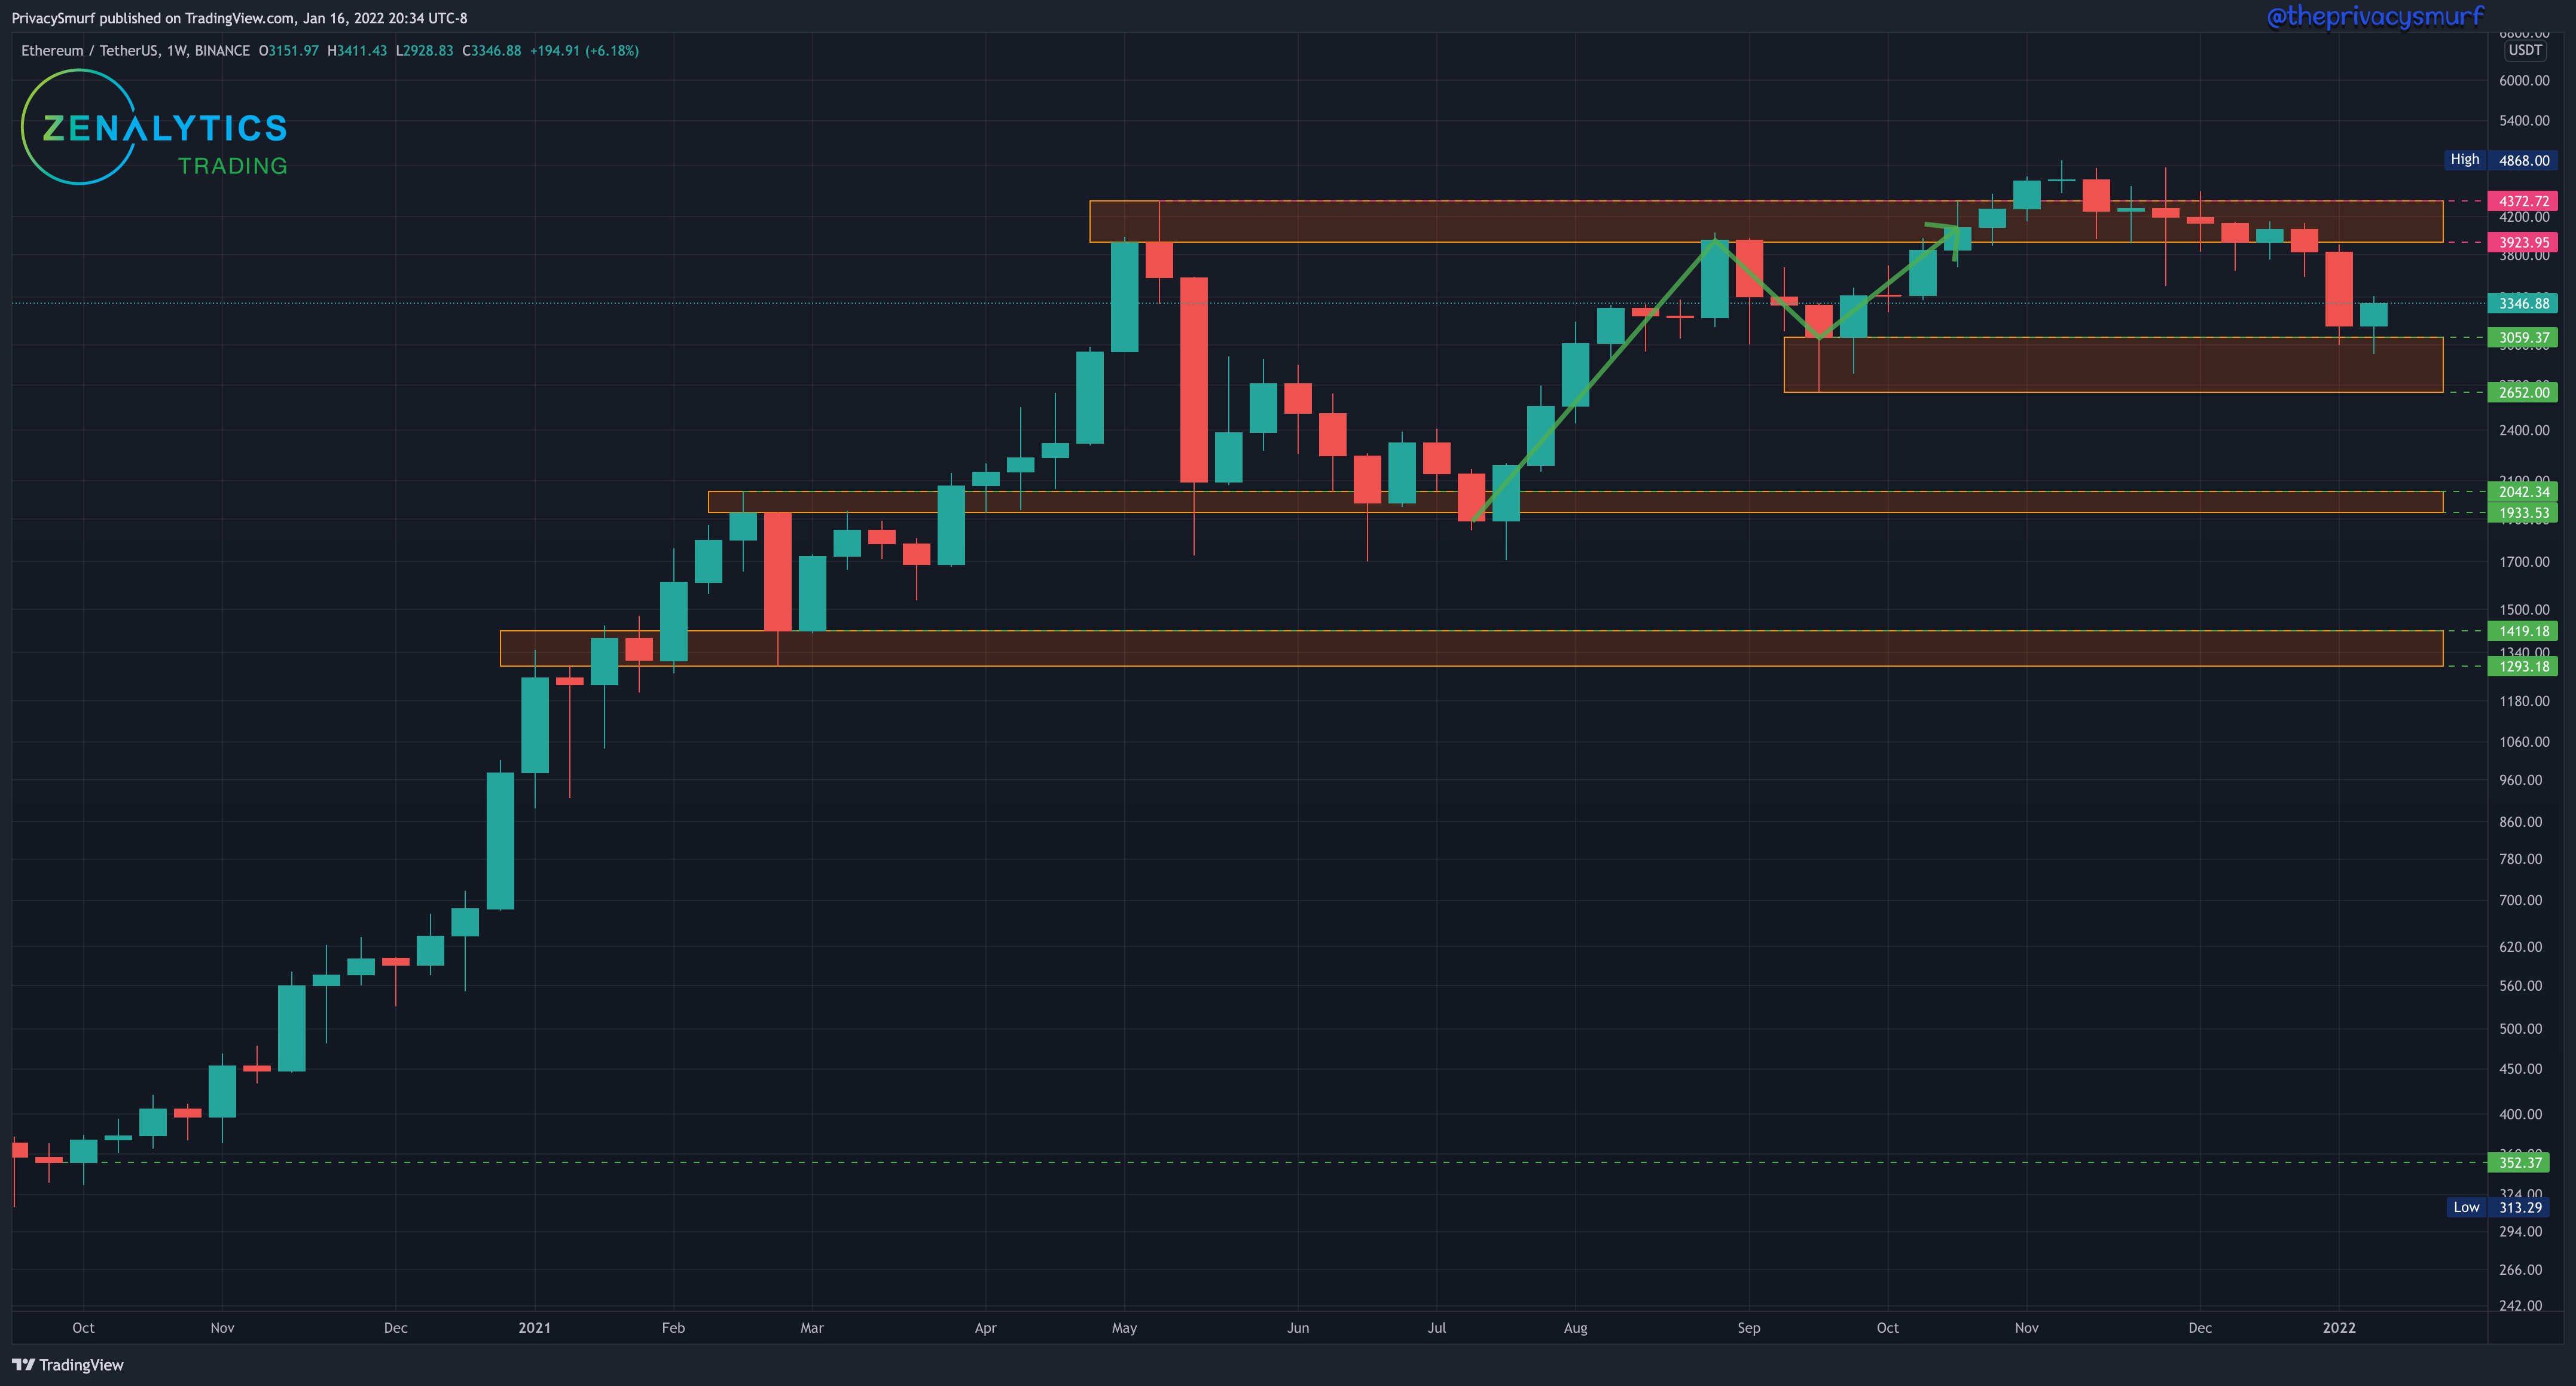
We got the wicking into the support zone as suggested last week. ETH matched BTC with a relatively weak bounce out of a major support zone. With the trend being bullish I’d expect some bullish price action but I wouldn’t rule out more low wicks into the support zone. Most importantly the bullish trend structure is only maintained as long as weekly closes don’t go below $3059. Not pictured in this chart, the weekly chart has shown multiple bearish divergences across oscillators suggesting lower price action.
ETH/USDT Daily Chart
https://www.tradingview.com/chart/xbB6lkZu/
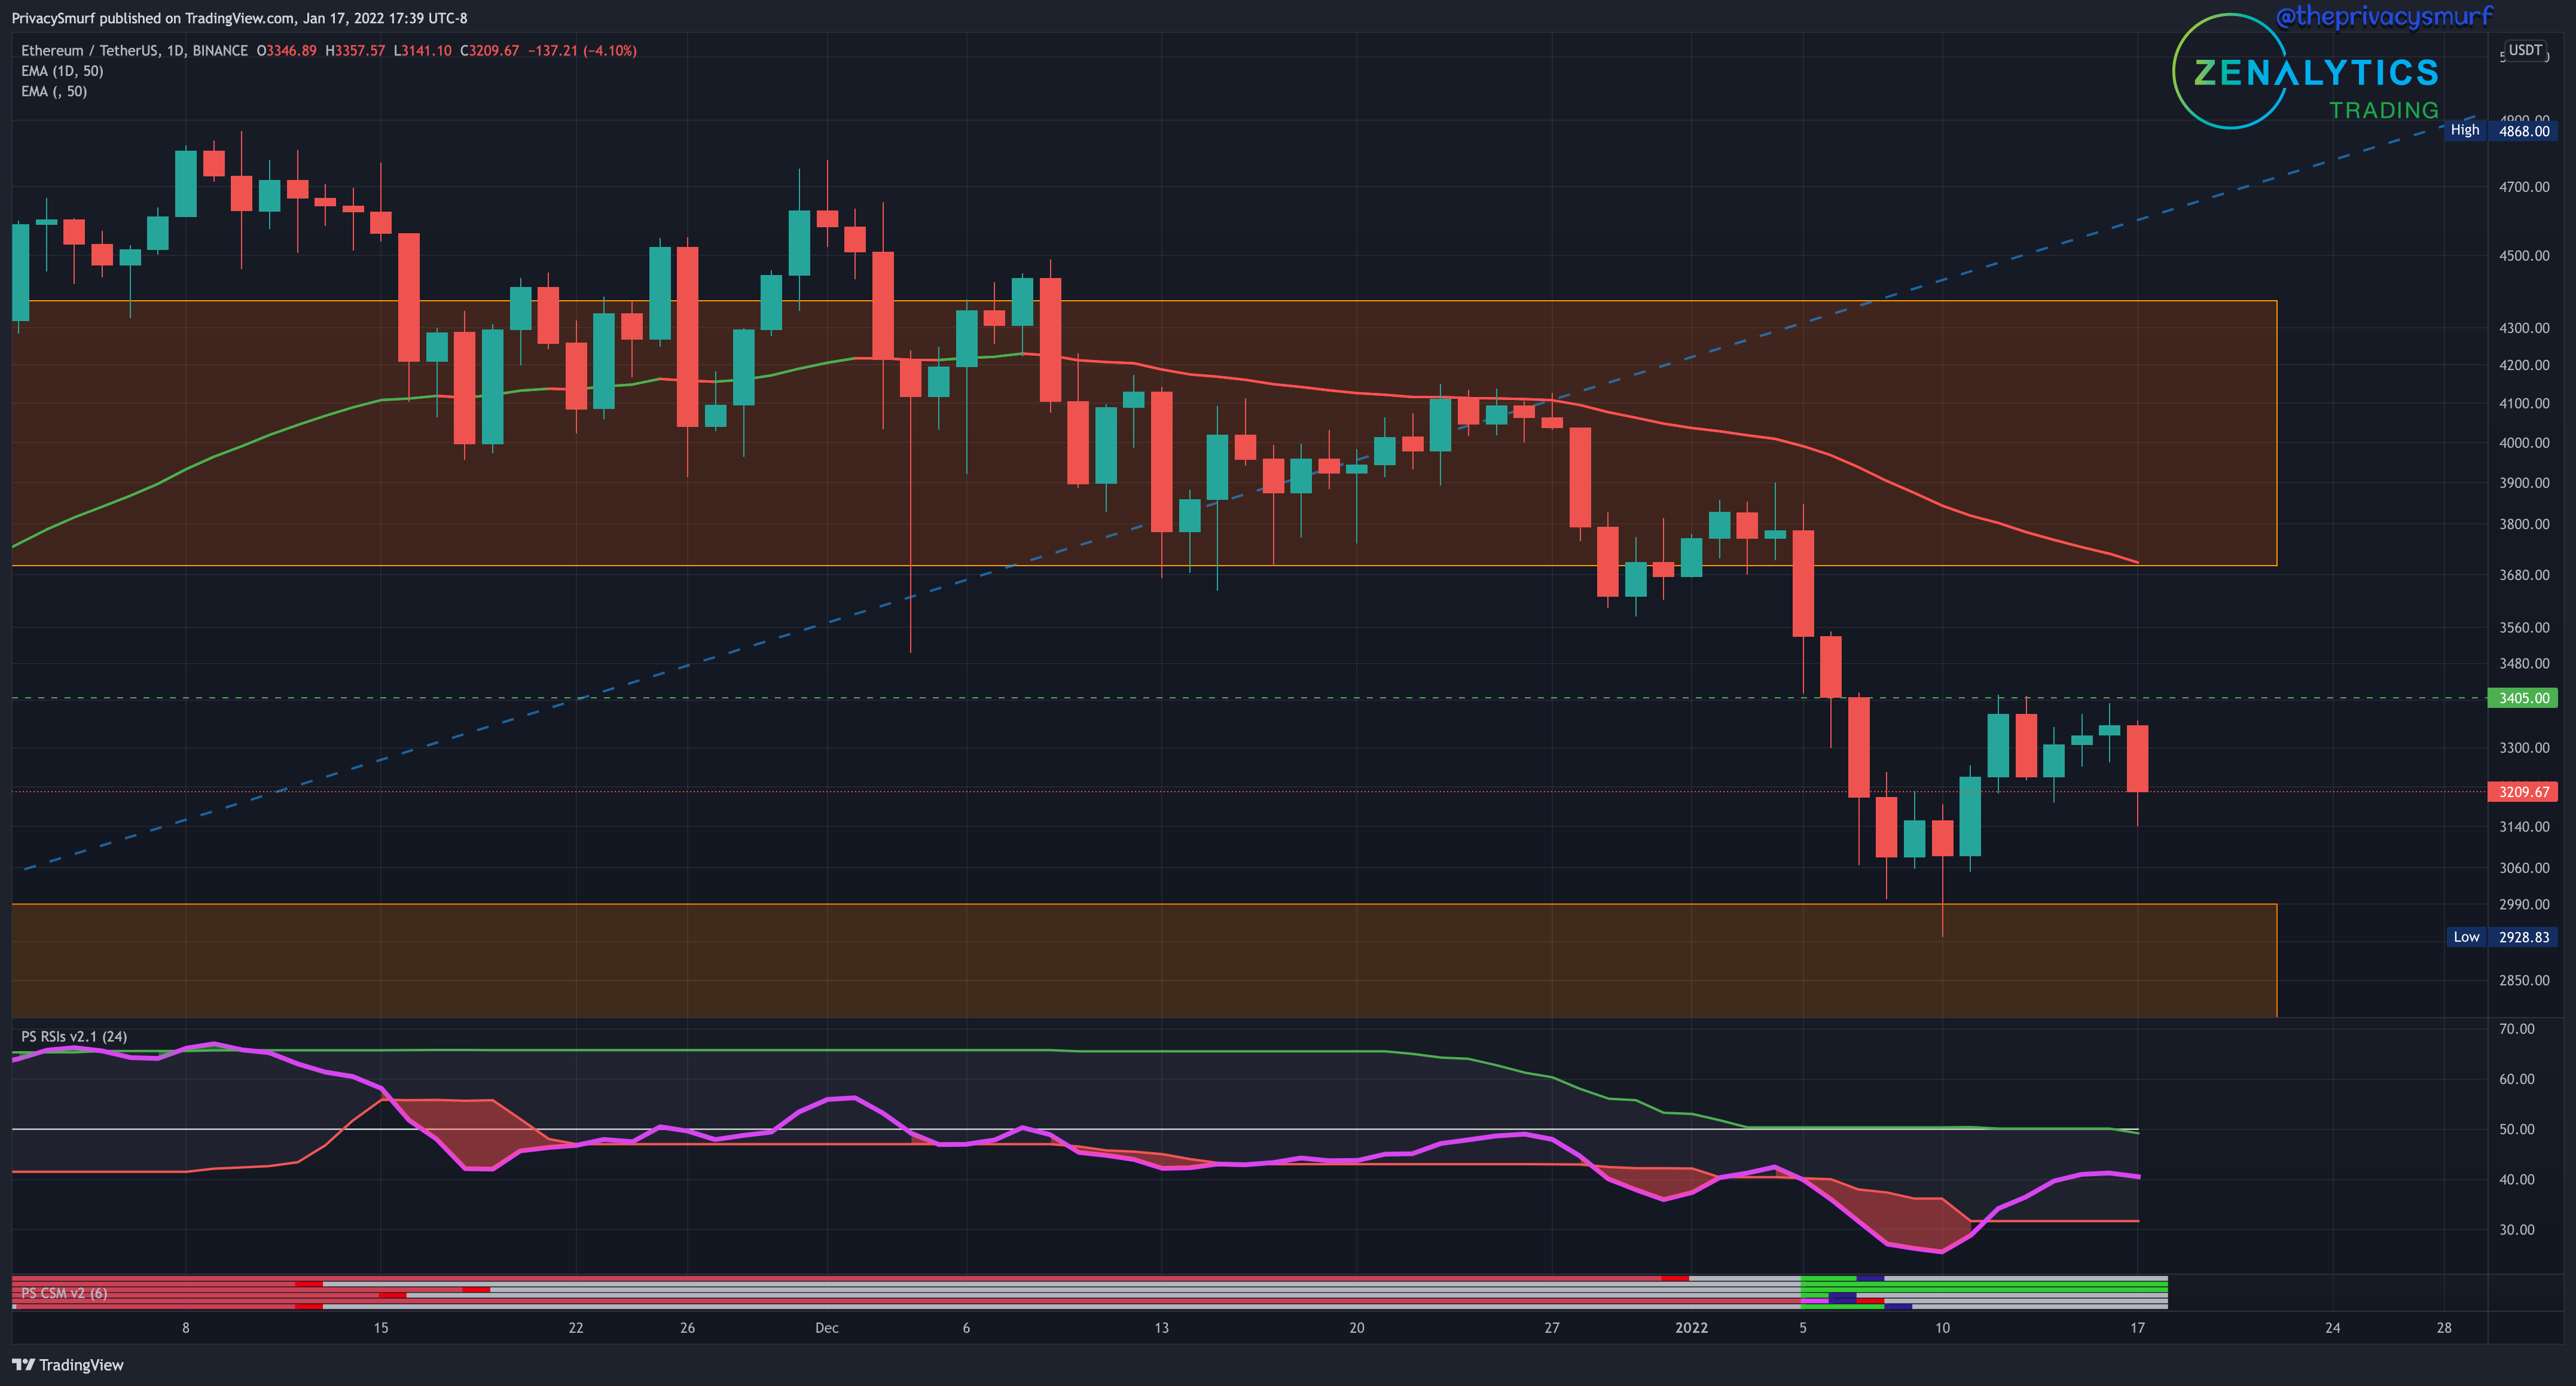
This is not the response one would want out of a support bounce. The $3405 resistance has held twice and the more recent test closed as a bearish engulfing candle pattern suggesting a return to the support zone. The bullish divergences are still present on a few oscillators shown by the light green lines on the Correction Strength Meter at the bottom of the chart but a trend reversal does not often come sustained from a single oscillator trigger. I’m expecting more consolidation in this range from $3000 to $3400. Be on the lookout for some more sub $3k ETH. This floor, just like BTC will take some time for sellers to eat through.
Market in Sections
I have shared the Crypto Money Flow Chart before but here’s another link to what it is and how it’s a better replacement for the Bitcoin Dominance chart (BTC.D).

Below I’ve reconstructed this chart in another platform with some custom indices that I think better represent the market than the FTX index futures tickers.
Below we have each symbol, the 50-Day EMA, and the PS RSI. The bottoms sections are the different market cap sections, looking left to right, large-caps, mid-caps, and small-caps. ETH (top right) and mid-caps (bottom middle) are still showing the most strength across the market and are still my focus for positions in the next bullish rally.
The strength is shown by:
ETH/USD trading above the 50-Day EMA.
ETH/BTC is setting higher highs and higher lows and showing a potential test/break above the 50-Day EMA.
Mid-Caps (CC100MC) are showing a higher low floor and a similar potential test/break of the 50-Day EMA.
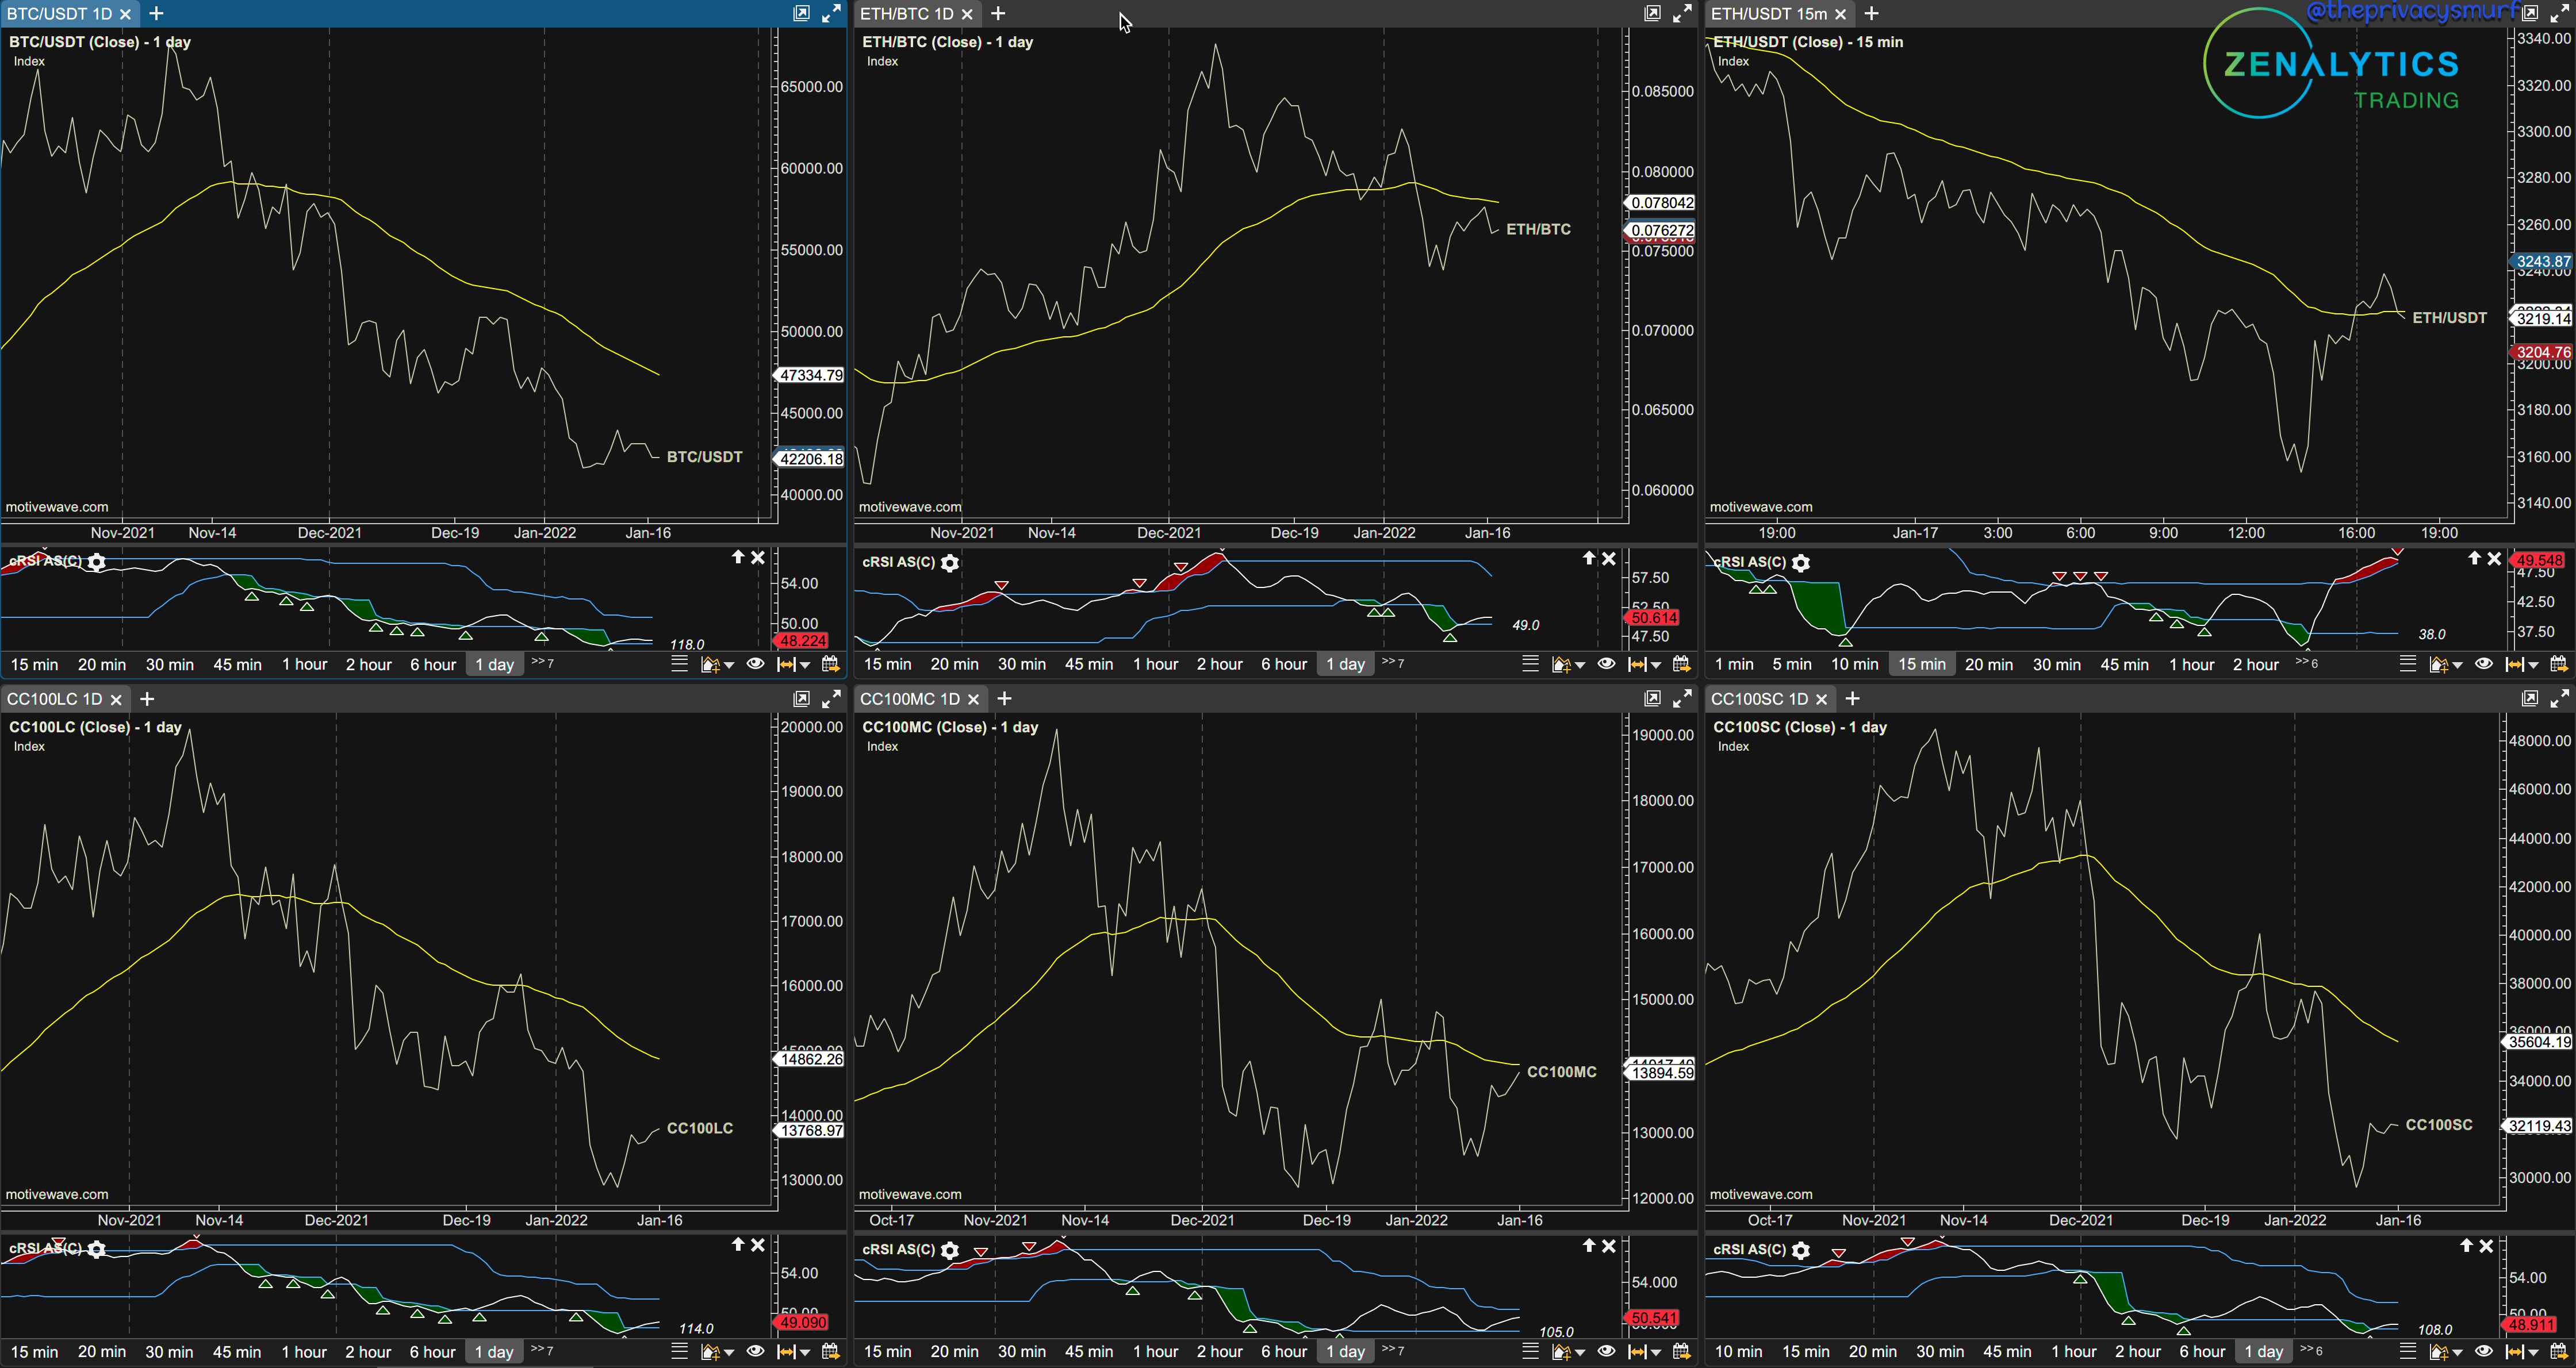
In my opinion, when the market goes up again with actual conviction, ETH and assets $5bil-$40bil are going to be the big winners. Money is moving into these assets for a reason.
This chart, being a higher time frame and the larger macro view isn’t entirely necessary to look at each day or week but is good to check in around market turns at a minimum. I can’t really share this chart for you to use on own time to look but the alternative one in tradingview that I linked above will serve as a good replacement.
Thanks again for your patience and have a great week out there. You short-term/intraday traders, unless you are shorting, be safe. The pressure has to be released sooner than later. See you paid folks later this week for the midweek update, the video I SWEAR I’ve got to release about the weekly close and market structure, and the (I’m sure much-anticipated) update to the Smurf Sentiment Index (my fear and greed replacement).
@thepricacysmurf