

Sunday Synopsis #29: Marble Machine
Sunday Synopsis #29: Marble Machine
We just keep rolling down the staircase on step at a time.

I really enjoy people’s creativity, diversity of skill and patience. This just is not something I’d ever be able to complete no matter how cool I think it is.
Finally an up week across the market. Is it the end of marble machine or are we just going up the escalator to fall down the steps again?
BTC/USDT Weekly Structure
https://www.tradingview.com/chart/4v8qizyI/
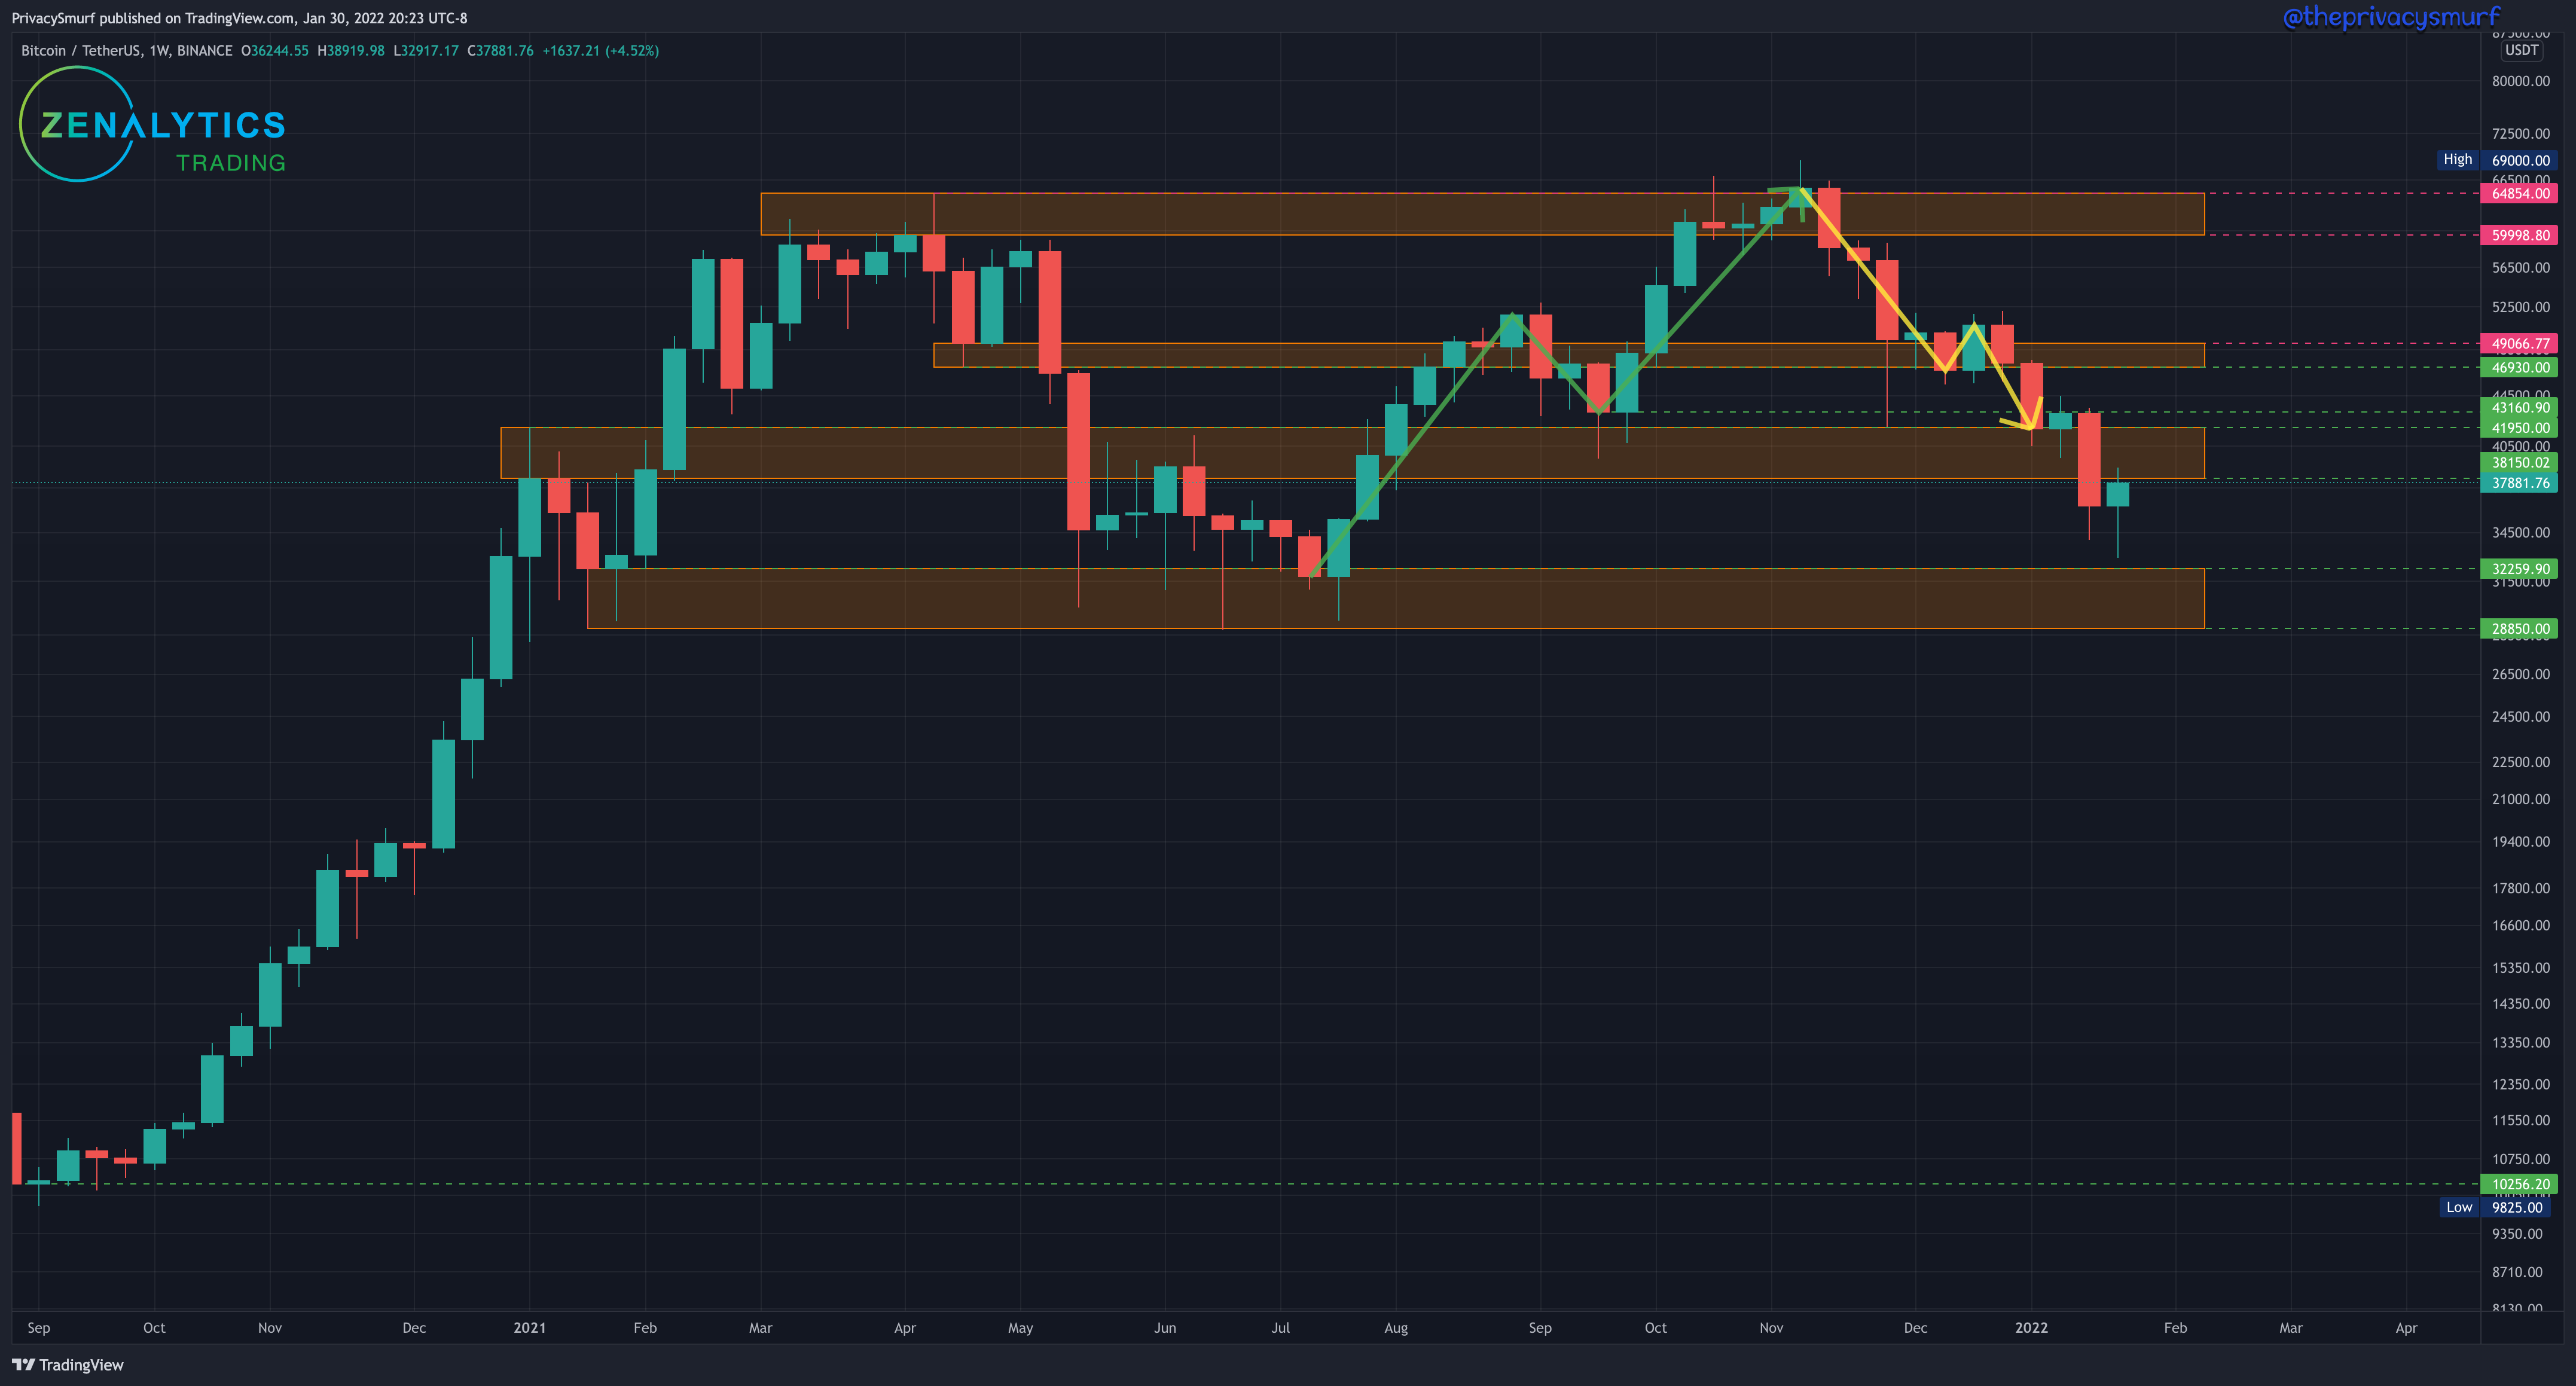
This week BTC managed to close up but if the last few bullish weekly closes are any example I’m not wary of this next week being bullish as it still managed to close under a support zone. I’ve also expressed before my reluctance to consider single hammer candles as a sign of reversal way back when in my first educational post about candlestick patterns (click here). The lowest weekly close and final line of support on the weekly chart is still $31778. As we get closer to the floor a close below this point brings the lower mid term projections (in this → NOT FUD piece) into much higher odds. Let’s take a look at the daily chart for some insight for the coming days.
BTC/USDT Daily Chart
https://www.tradingview.com/chart/jjSdFW4b/
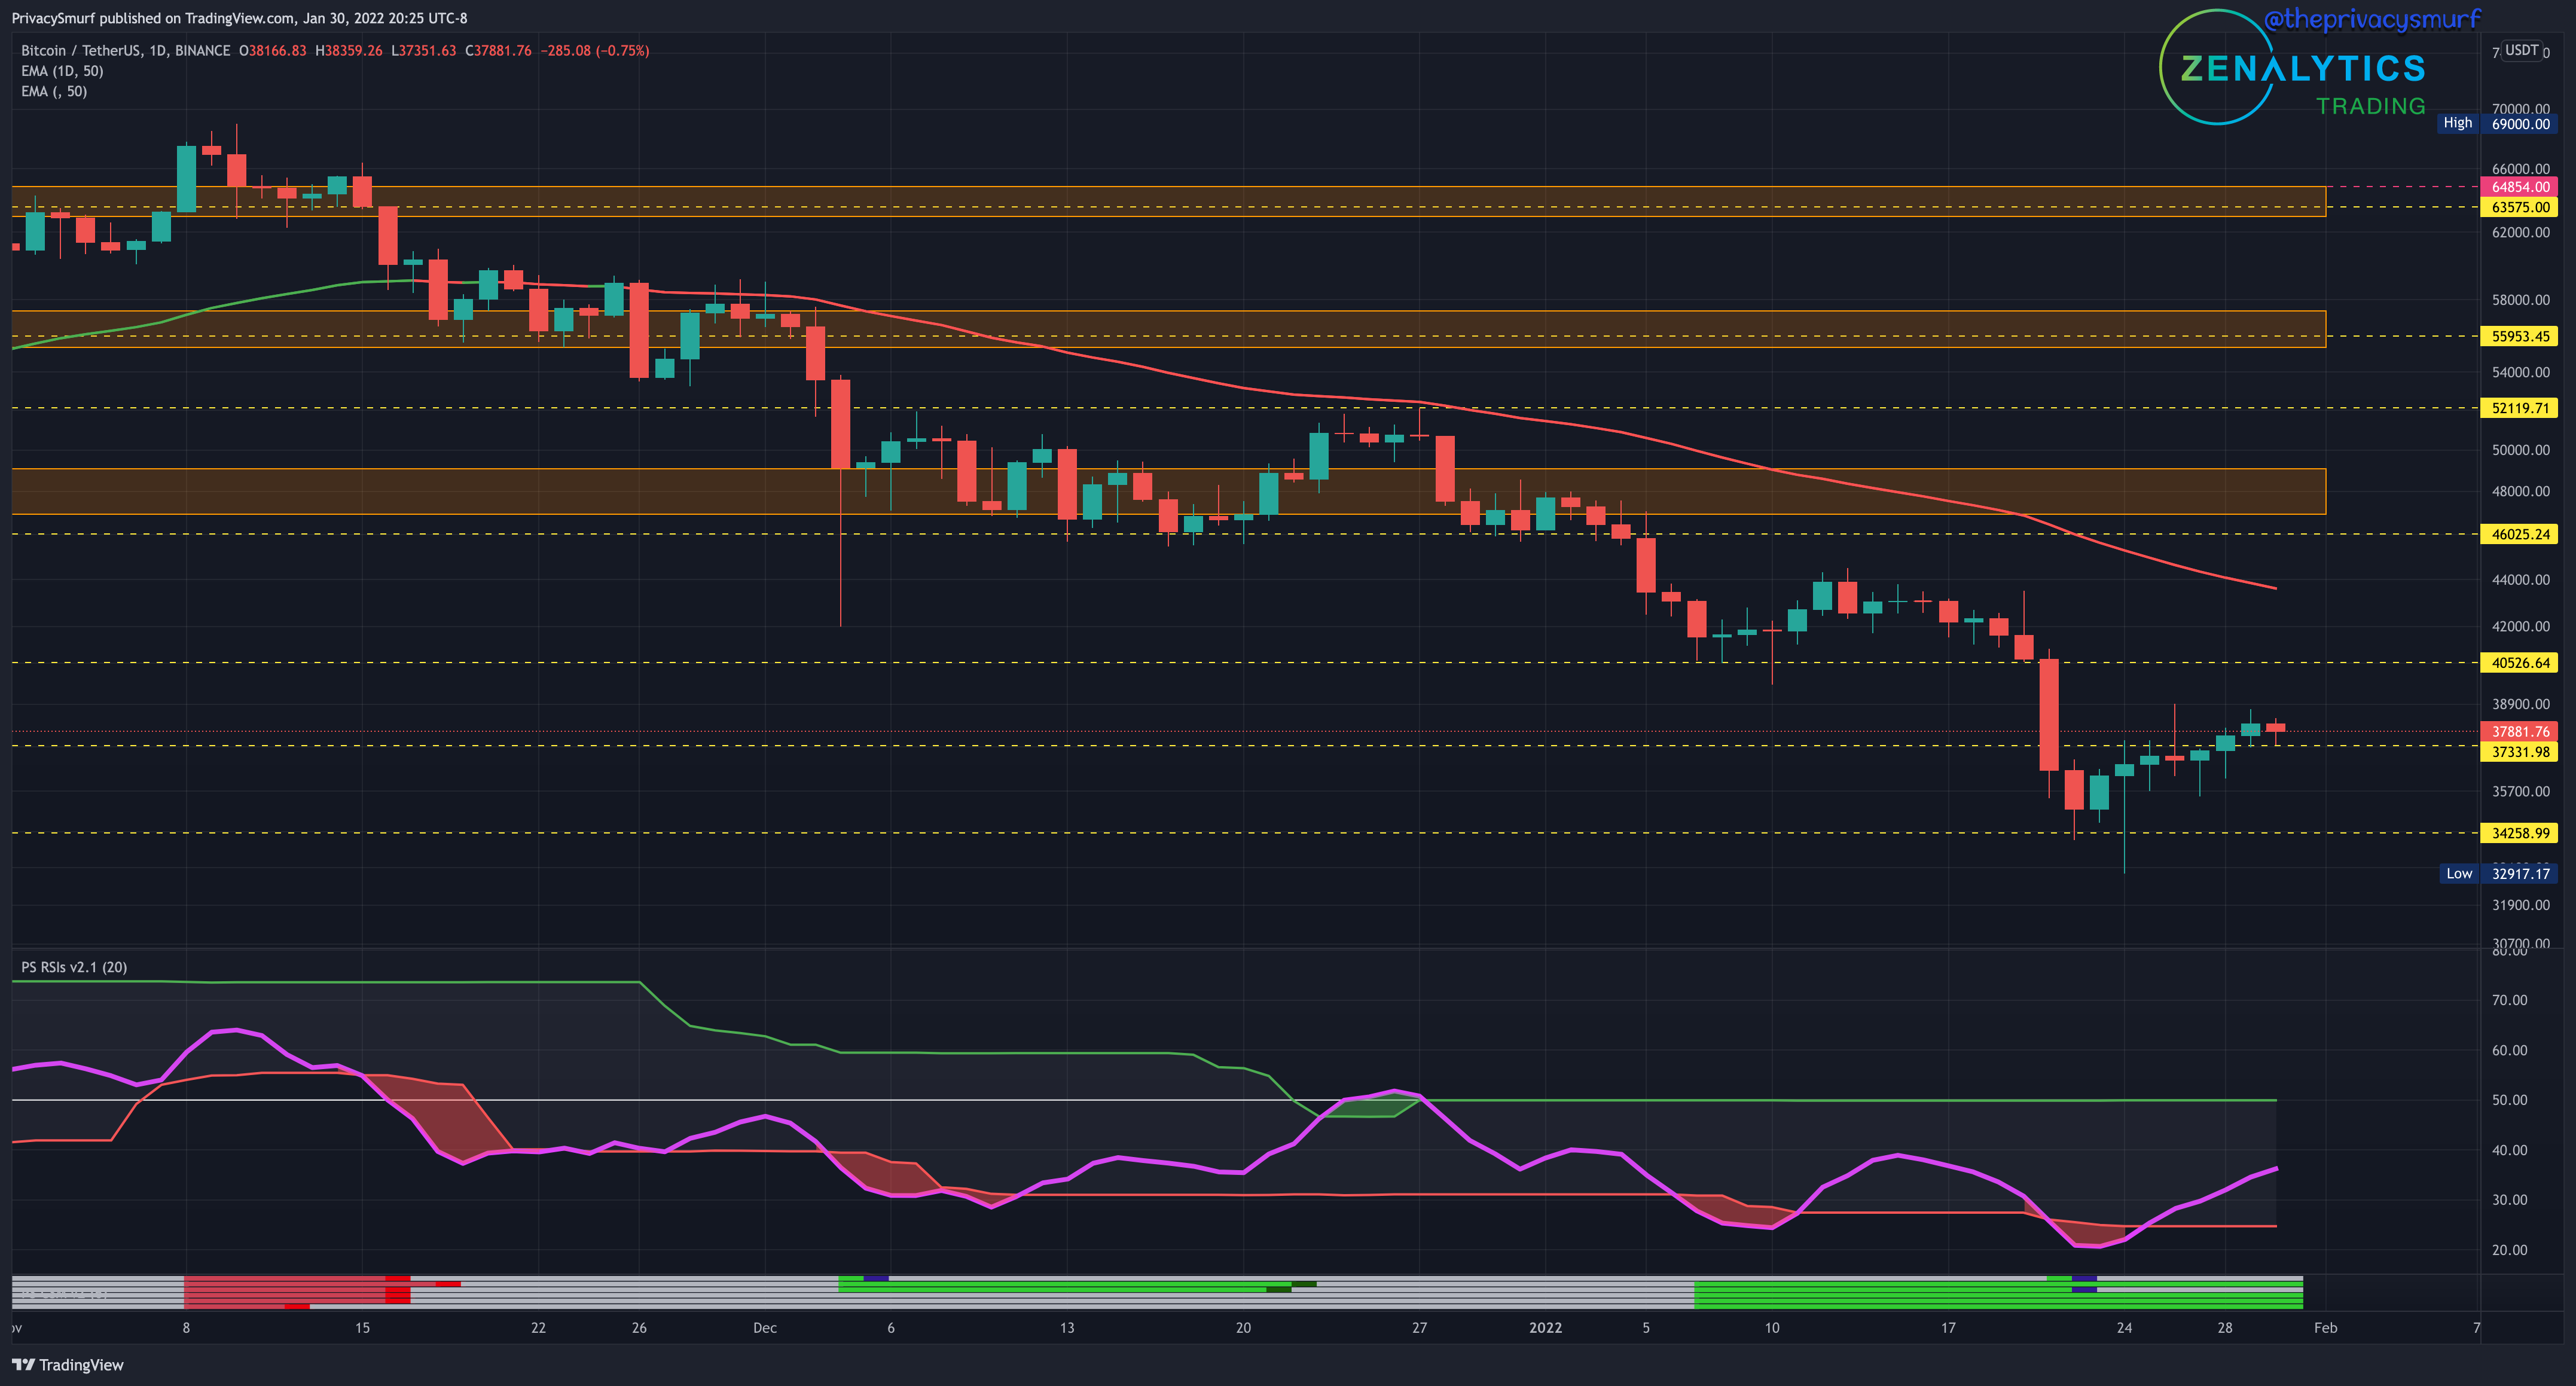
Last week’s suggested range of $34k to $38k was on point. The week closed out with an overthrow of the the top of the range high. I’d expect a test of that as support before ruling it out as a resistance. The highest ceiling is still at the $40.5k resistance if the support holds. The RSI is trending up but I don’t have any reason to expect anything besides more ranging volatility over the next week. Perhaps a higher low will be set finally.
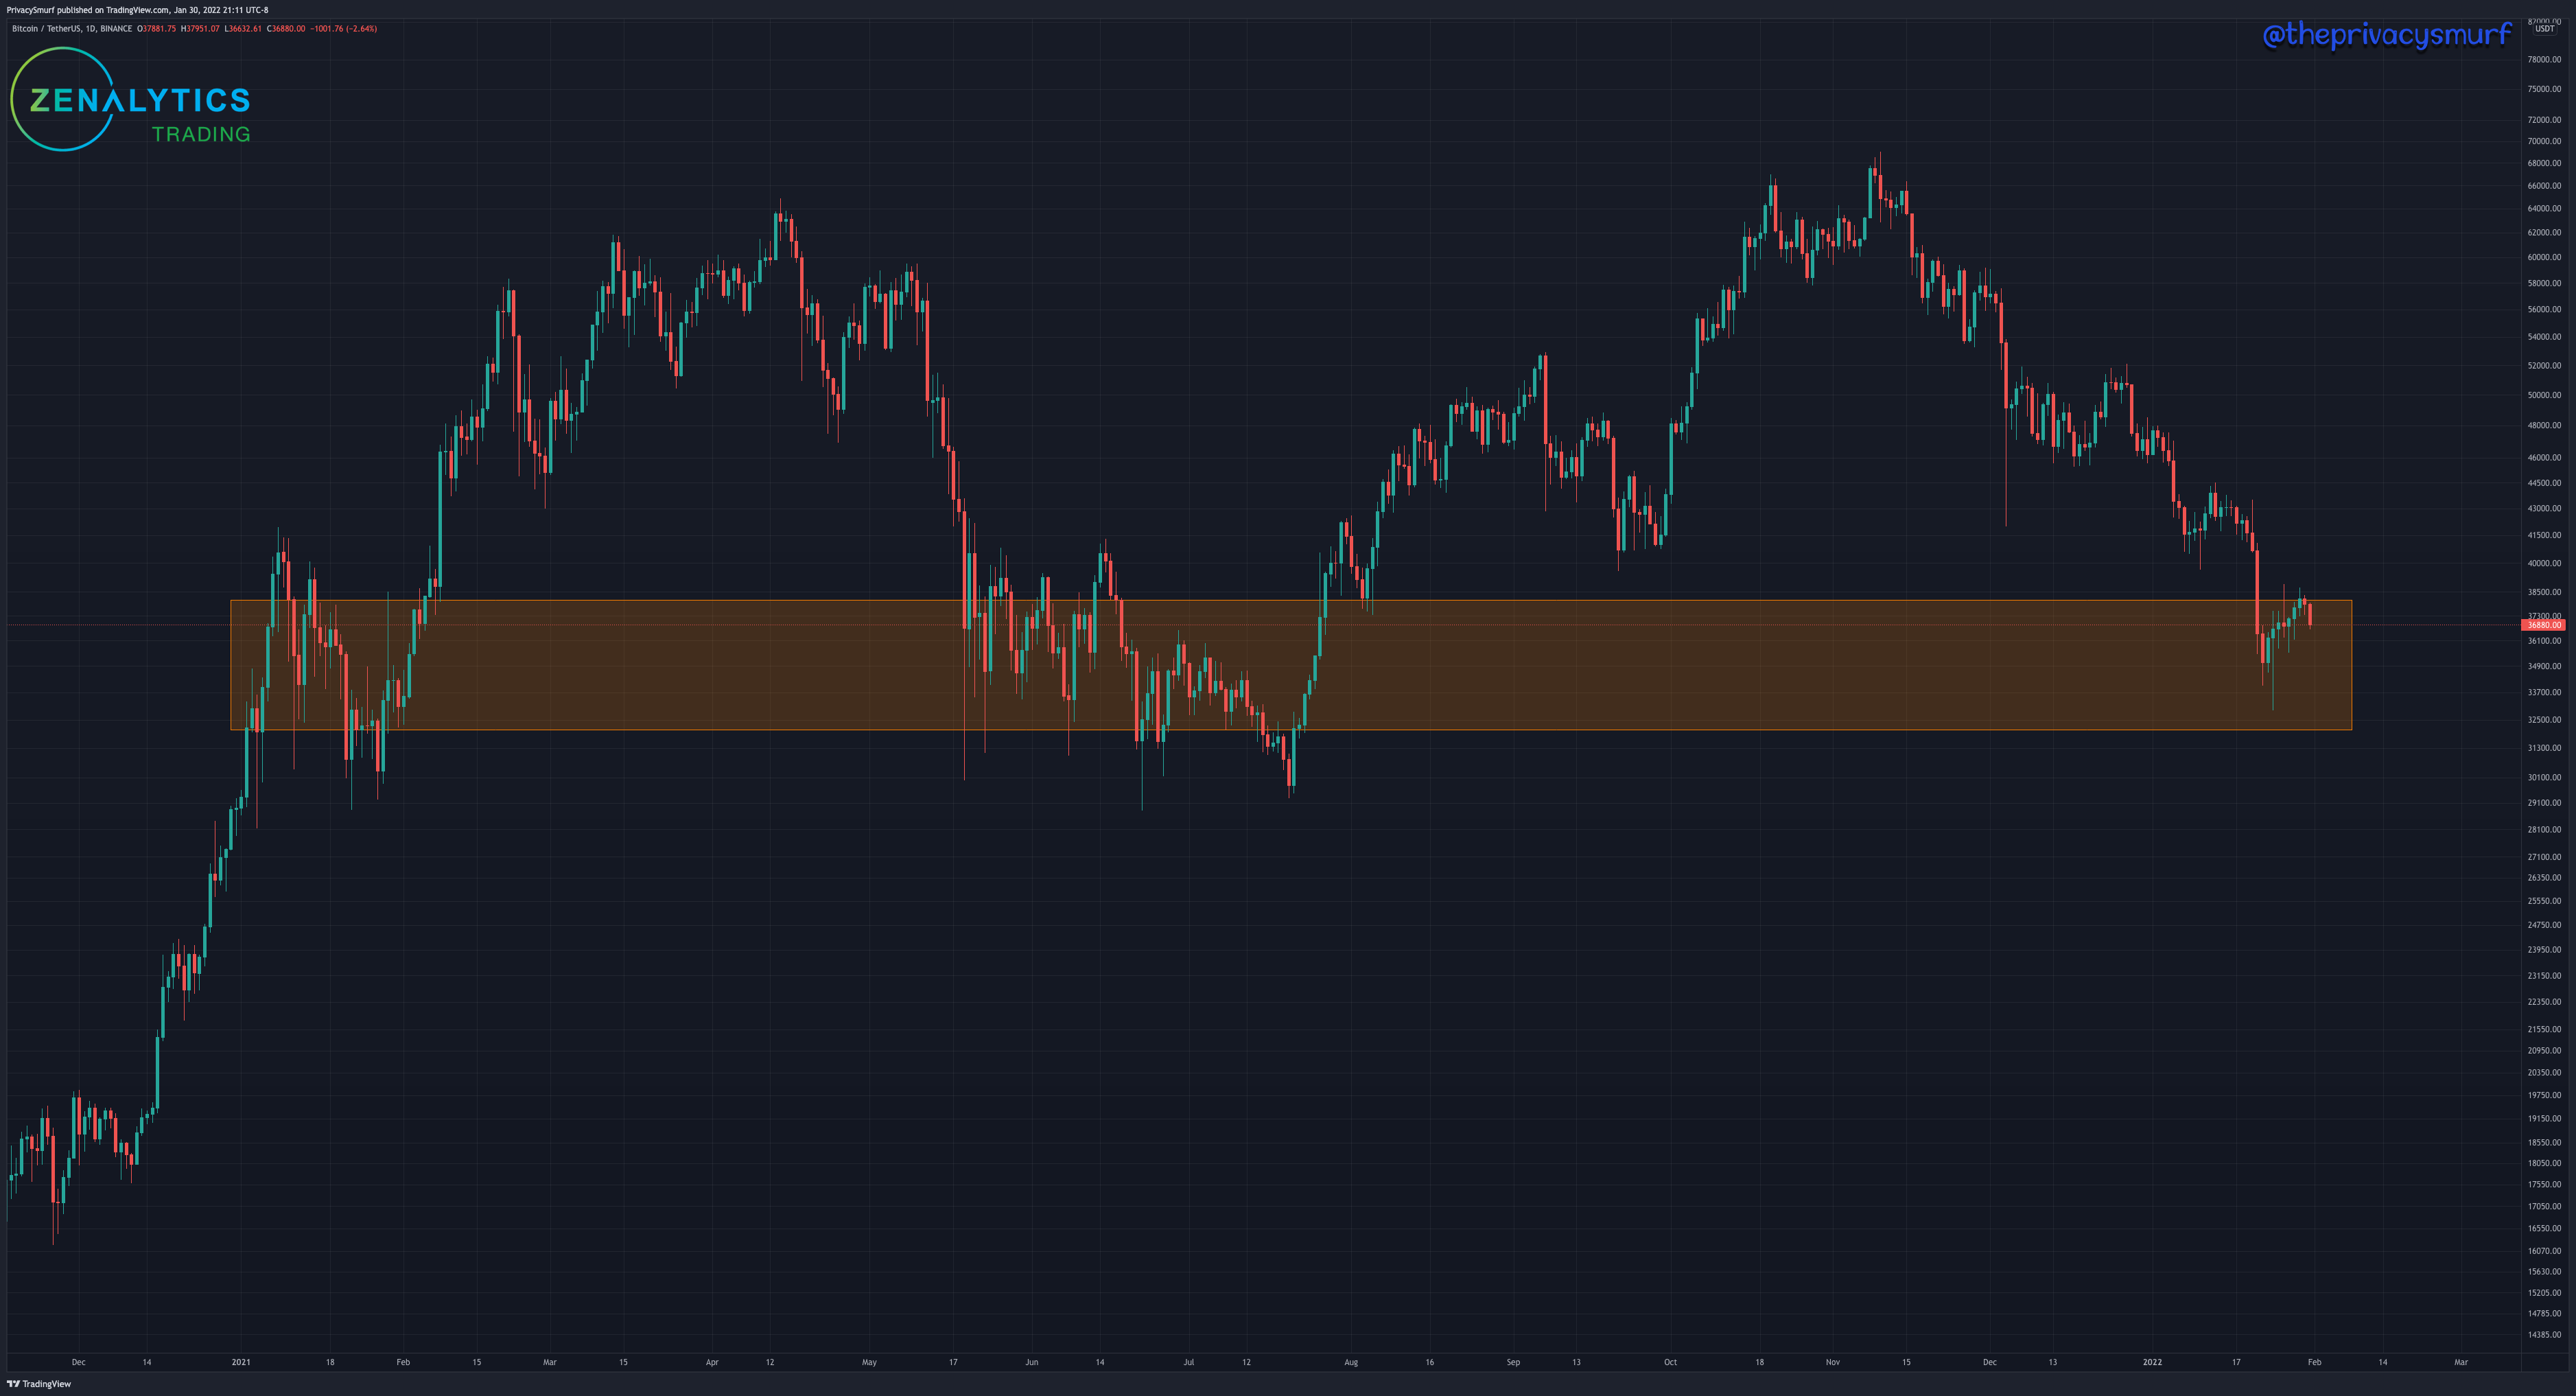
Zooming out some an argument could be made that the amount of time spent in this zone ranging reliably is a reason for the volatility. The whole region is an area of value for long term buyers. The top of the zone is an area of value for short term short-sellers looking to short/sell the top and cover/buy at the bottom.
ETH/BTC Weekly Structure
https://www.tradingview.com/chart/sacHlXOv/
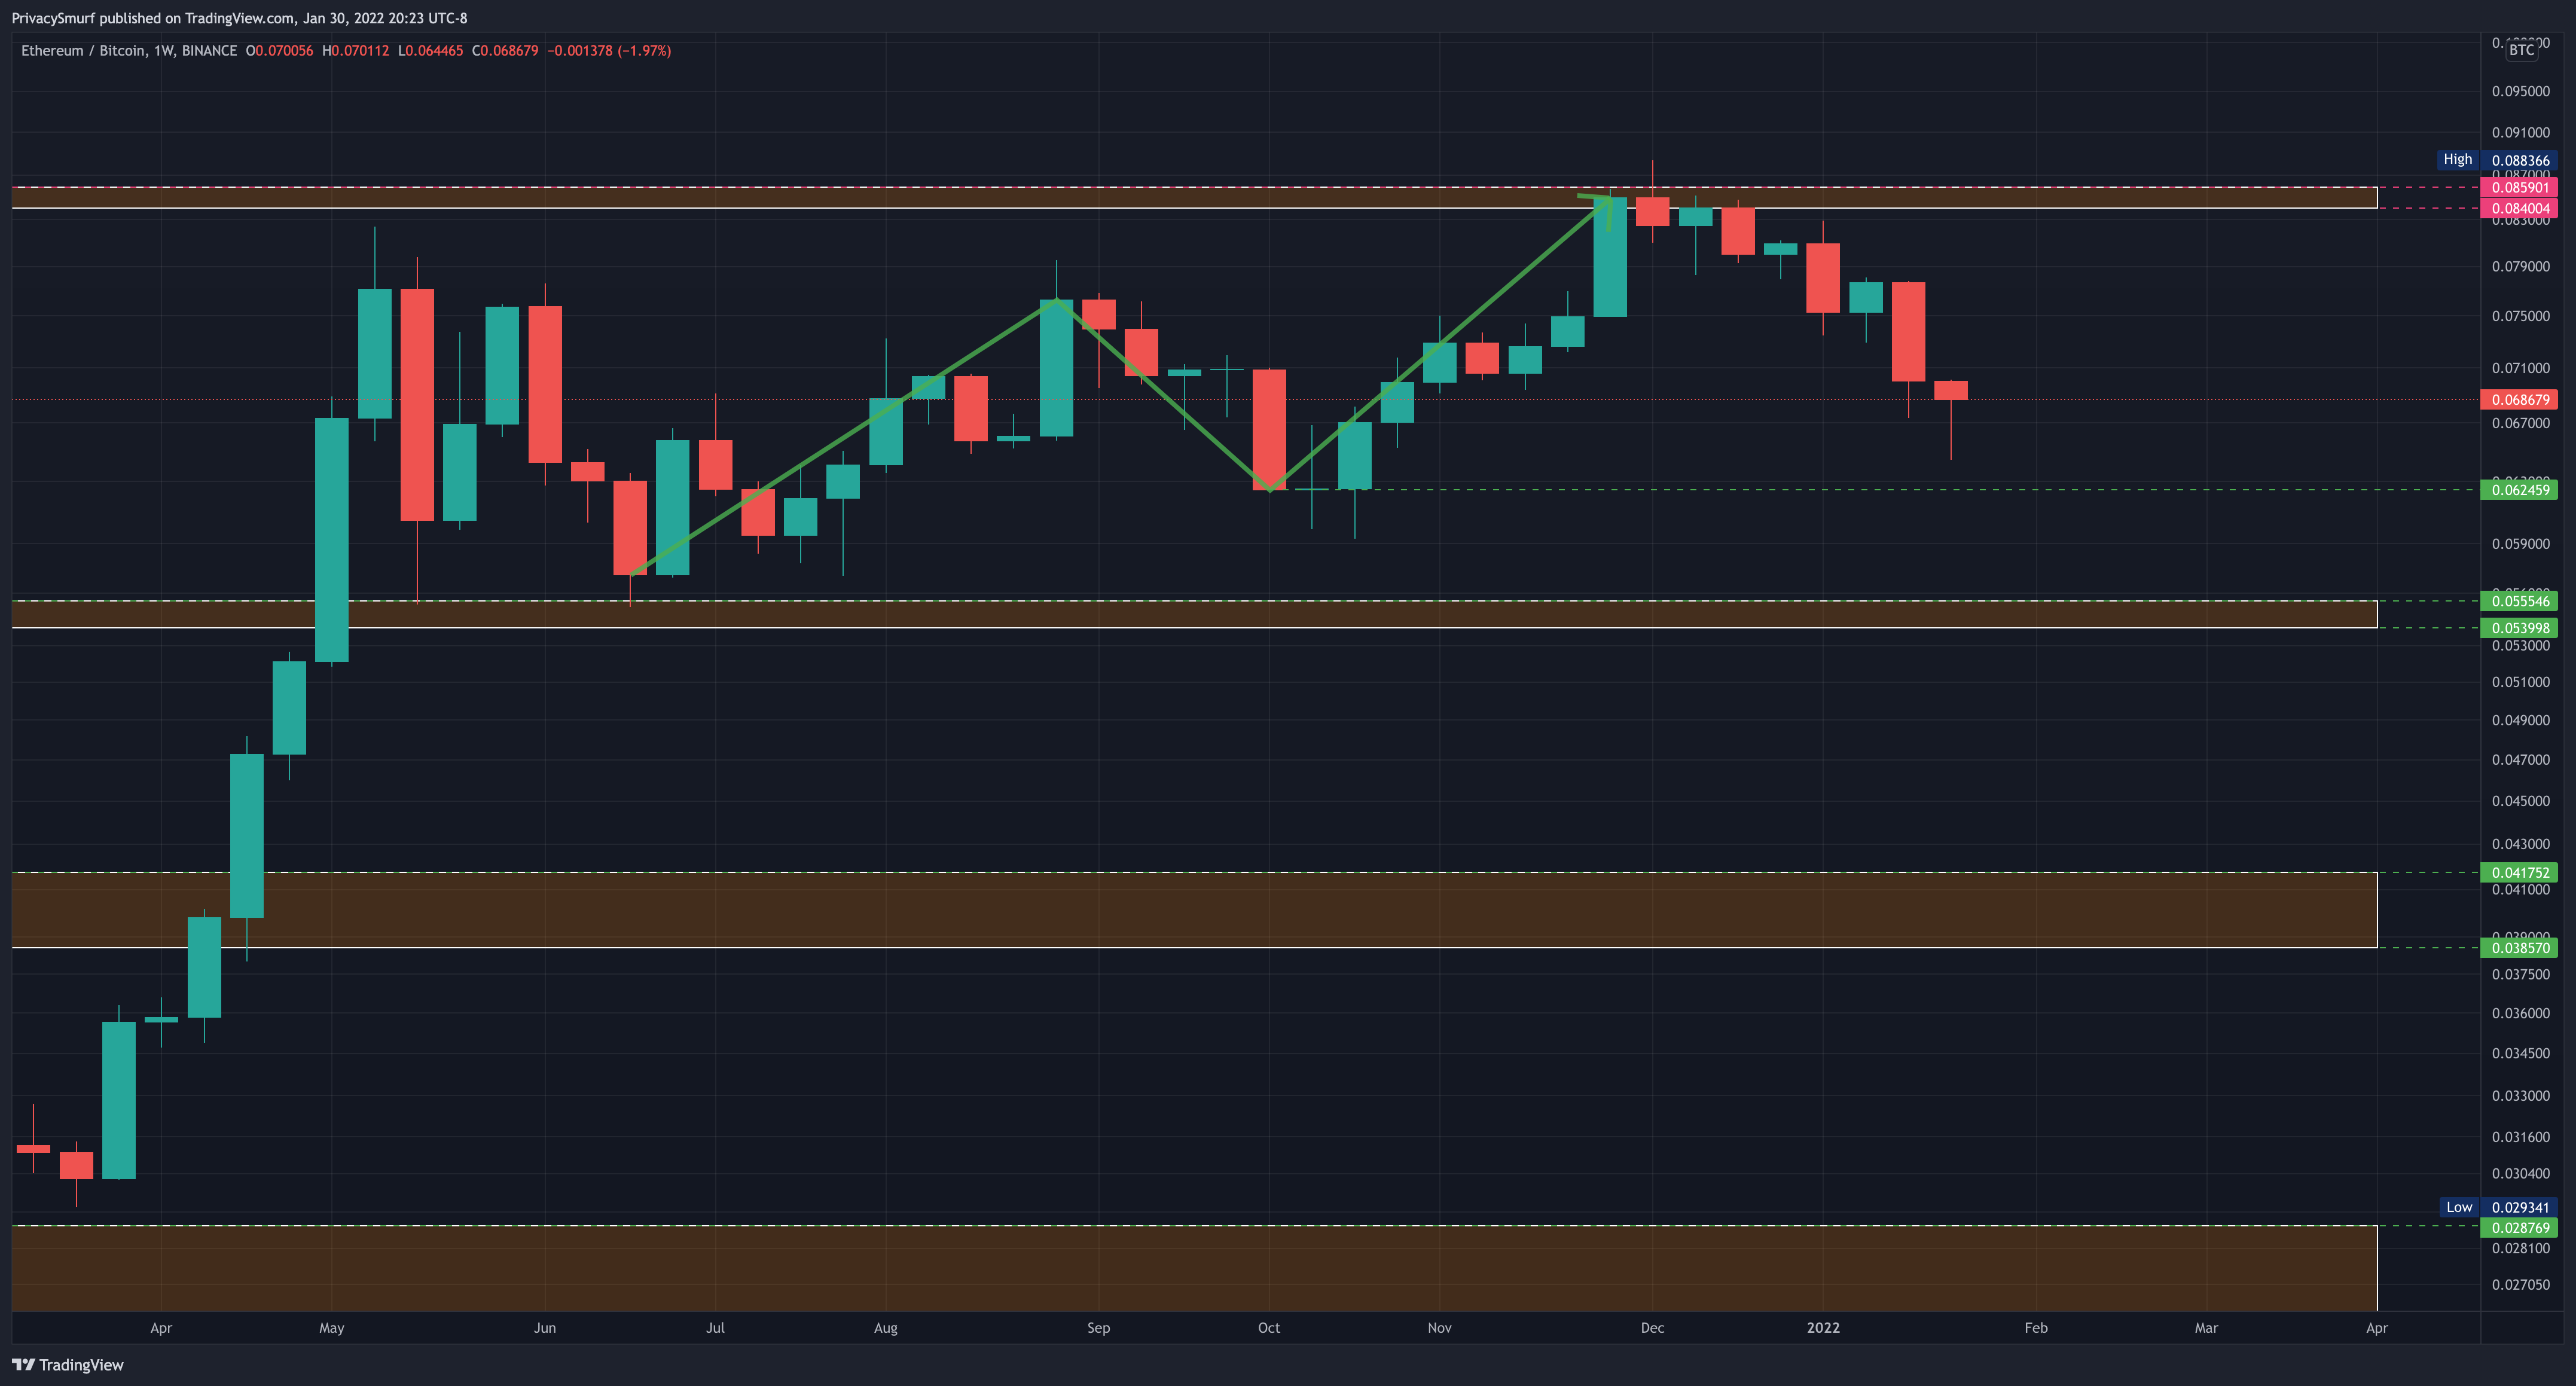
The weekly chart of ETH/BTC closed bearish. Since ETH/BTC is not matching the BTC/USD chart we know that ETH/USD is either going down OR it’s up but not as much gain as BTC/USD. A close below 0.0624 will set a new lower low close and establish a market structure bearish trend. At that point an argument could be made to rotate ETH to BTC if the BTC/USD chart isn’t showing failure to preserve some value and reduce some exposure or risk. Care will need to be taken though as the 0.0624 may act as support. Adding oscillators or looking at the daily chart when that level is approached can be used to validate or invalidate that rotational play possibility.
ETH/BTC Daily Chart
https://www.tradingview.com/chart/gTkSjkj6/
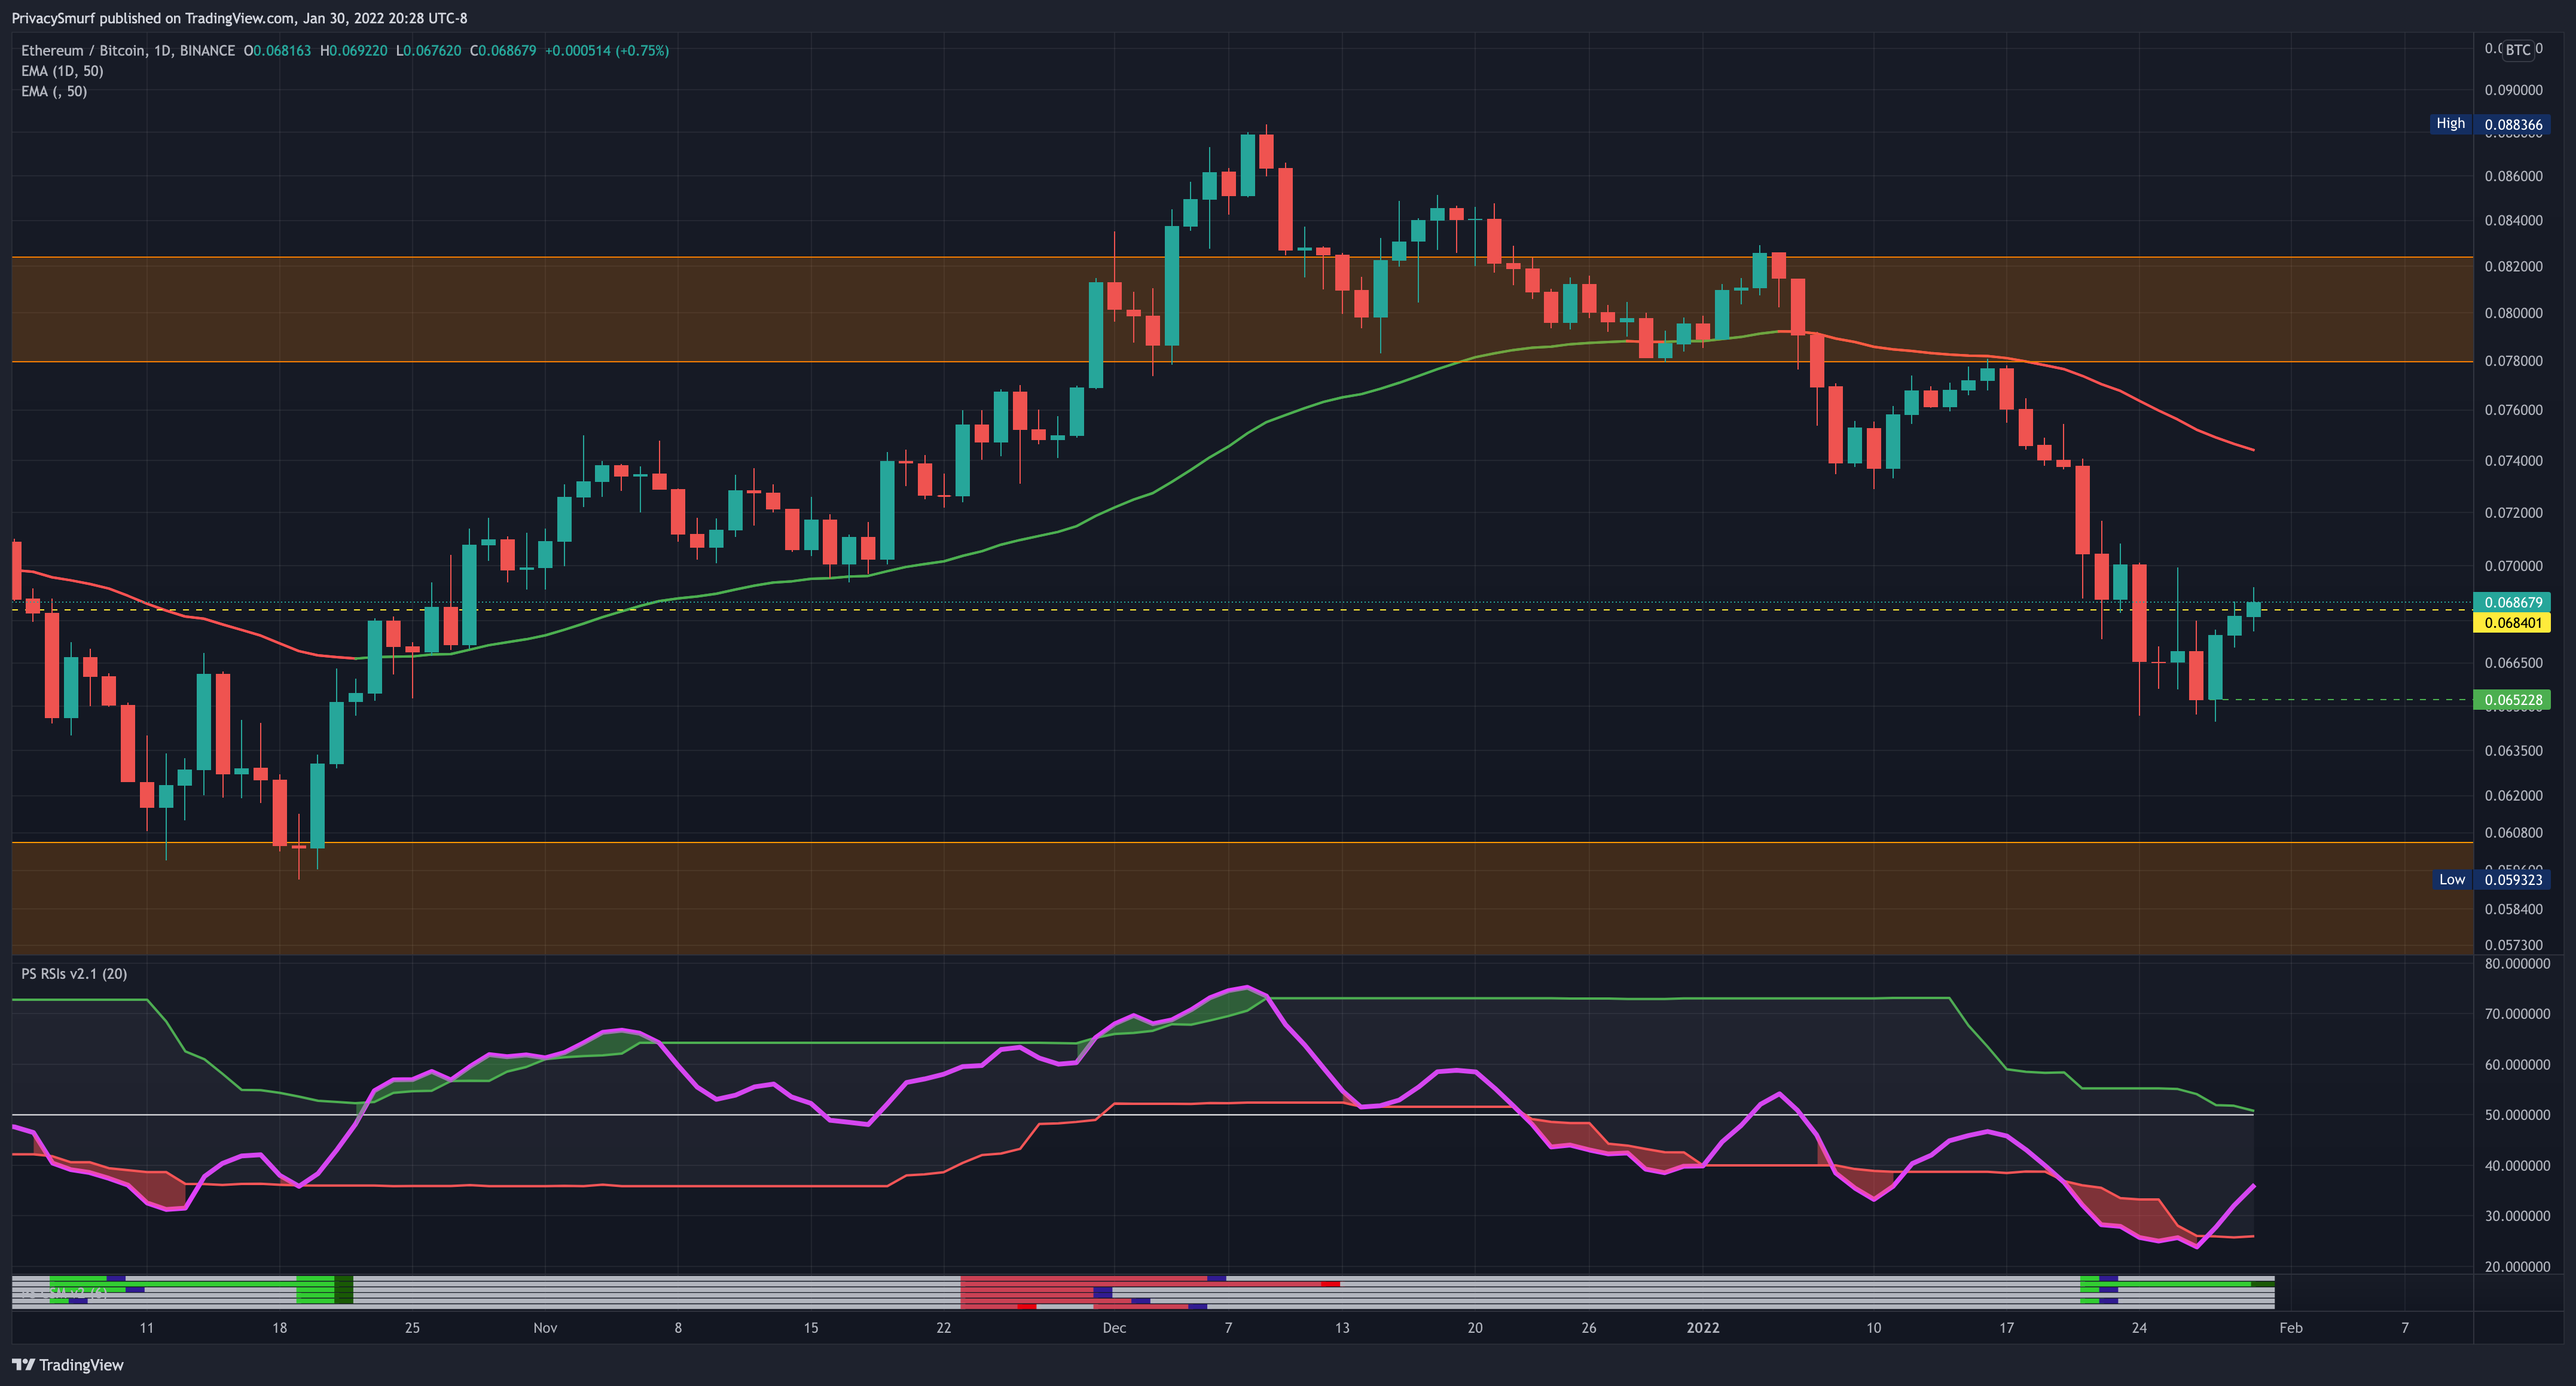
On the daily chart the week closed above support, so similar to the BTC daily chart I’d be looking for a test of that support for validation. Looking at the bottom indicator of the chart at the Smurf Correction Strength Meter, one oscillator did trigger a bullish correction trade, indicated by the dark green dot. With this action and the test and a close above the resistance I’m satisfied enough to set a range floor here at 0.0652, albeit weak as there’s only 1 oscillator in divergence instead of all 6 that are a part of the system. There’s a pretty similar outlook here but a bit more strength for the moment than BTC/USD, I’m anticipating ranging here with tests of the lows again and a range ceiling around 0.071. There’s no reliable short term rotational play at the moment. Being in a downtrend I’d be looking for a quick short at the 50-Day EMA if oscillators supported that idea.
ETH/USDT Weekly Structure
https://www.tradingview.com/chart/JPTp0aXw/
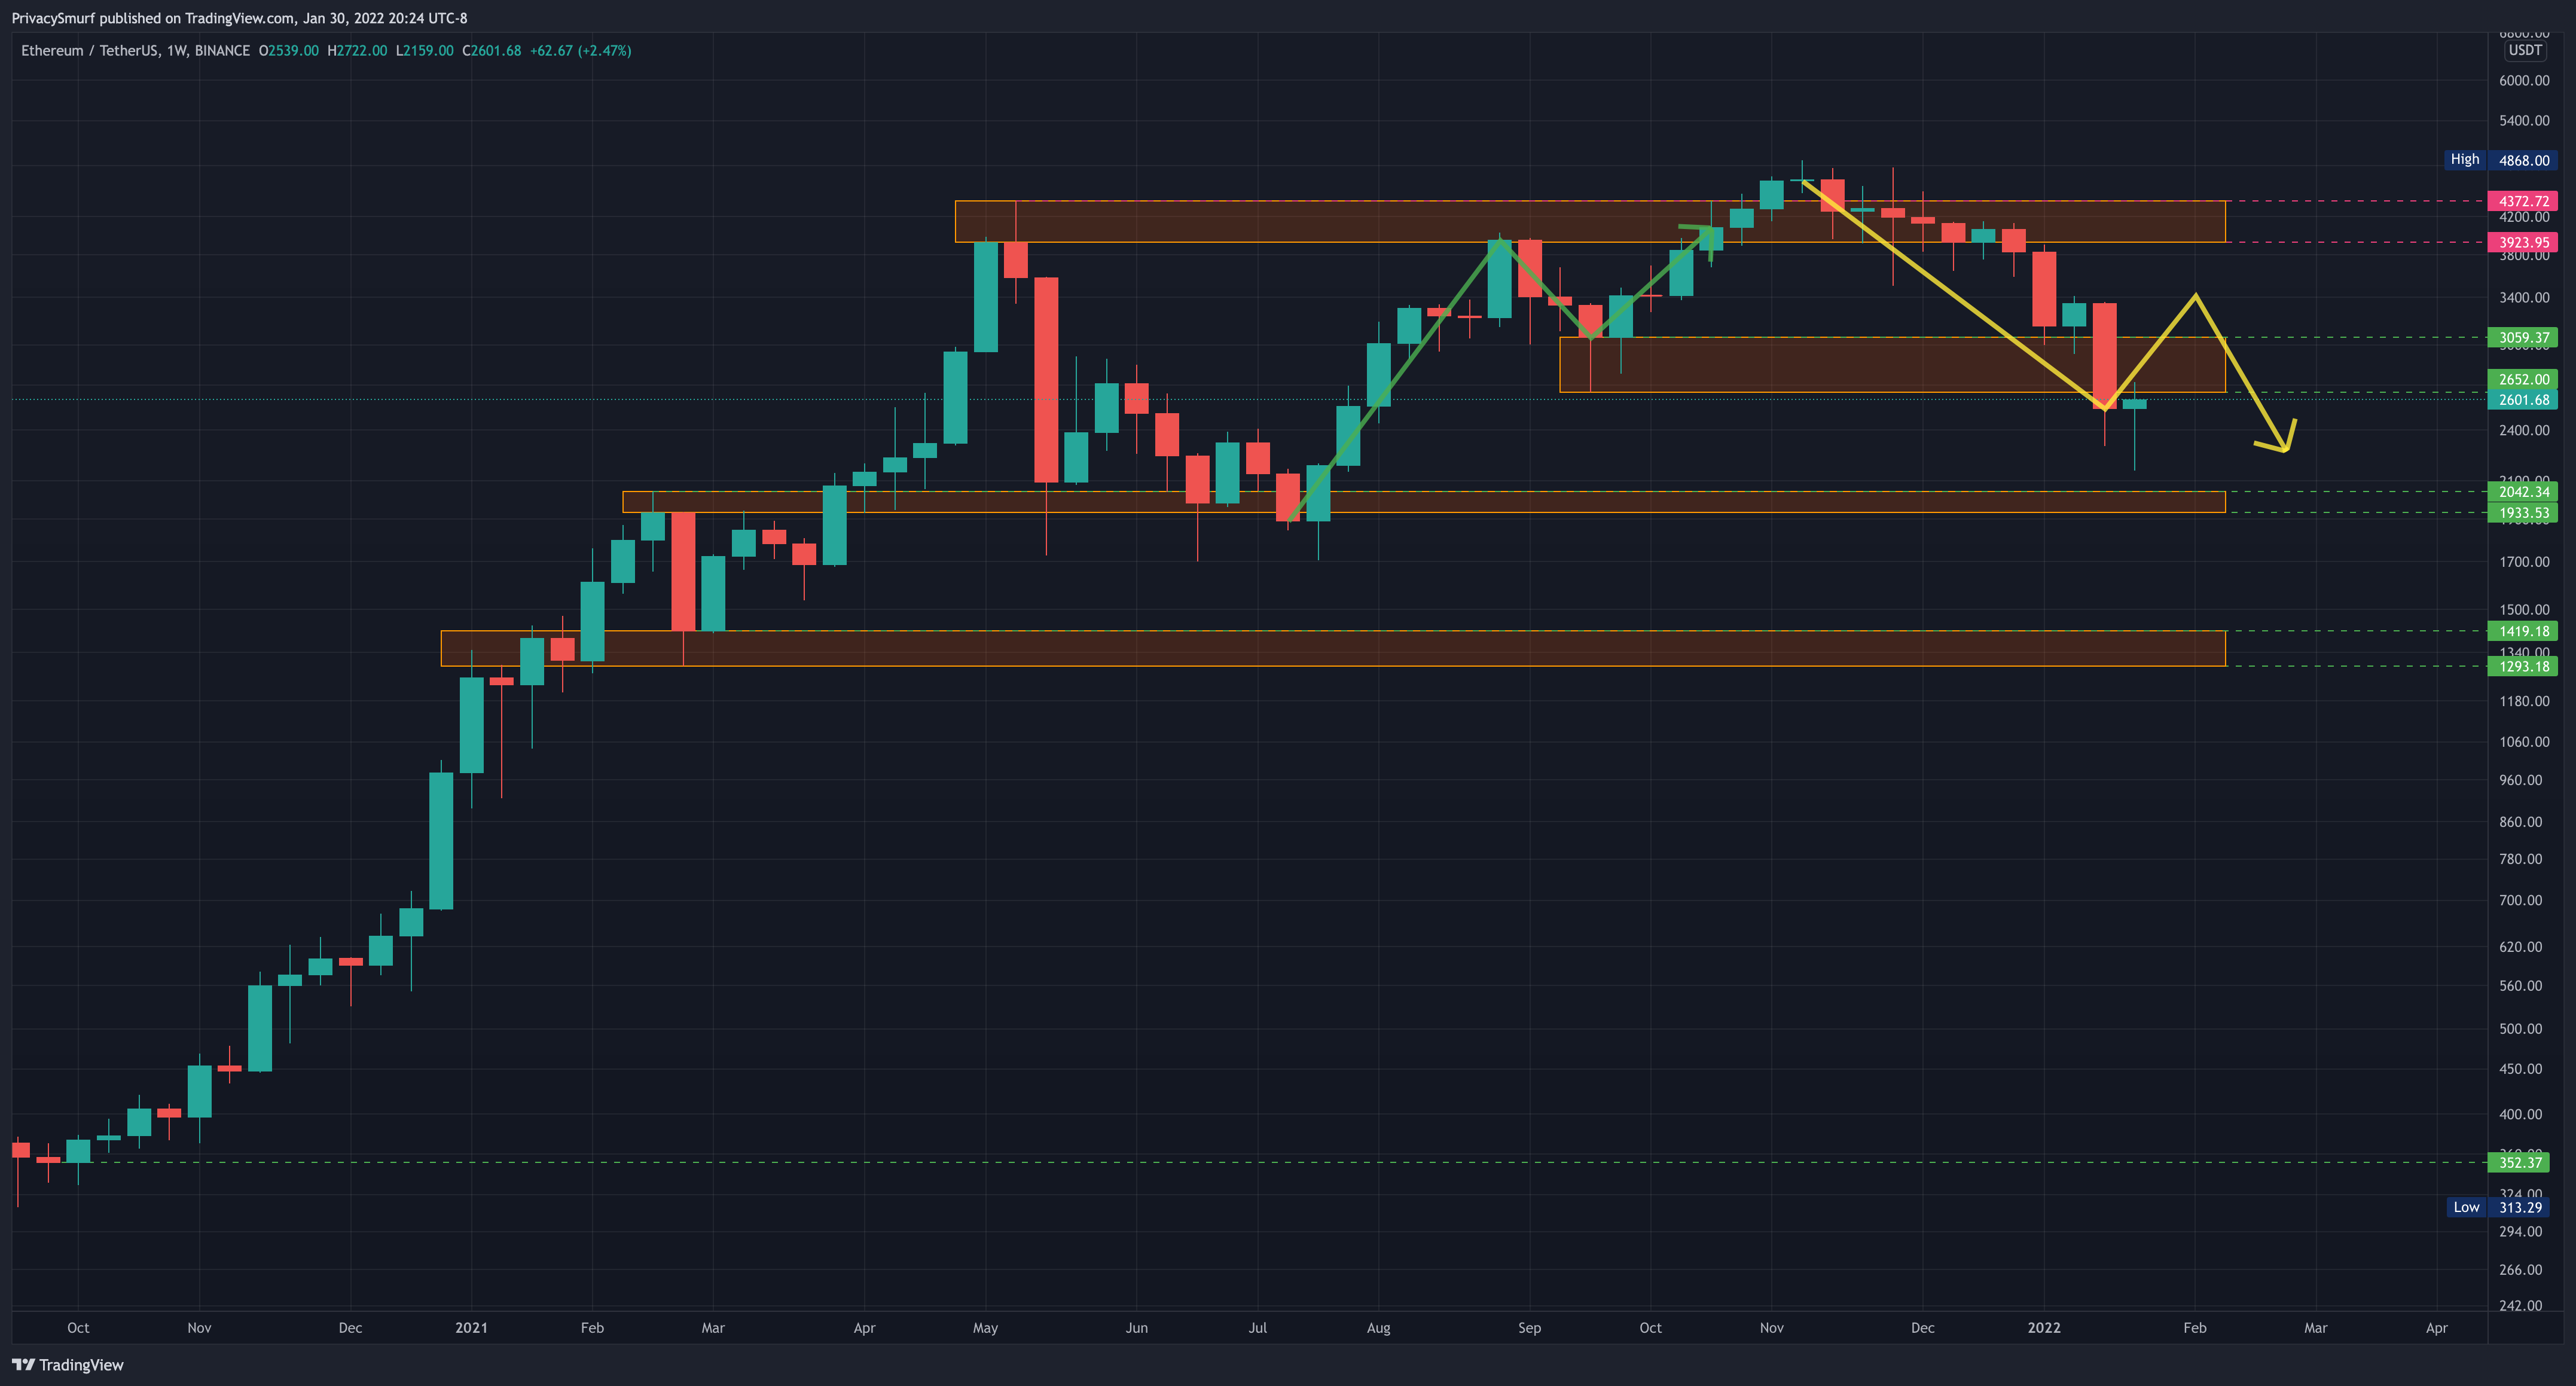
This weekly closed similarly to BTC under a support range and as a weaker hammer candle. The inability to close in the support zone gives me little confidence of a bullish break above the $2600-$3050 ceiling. There is still a longterm support at $1891 that is nearby though and likely where we will bounce up from if there is a retracement from this resistance. The daily chart will show this potential.
ETH/USDT Daily Chart
https://www.tradingview.com/chart/xbB6lkZu/
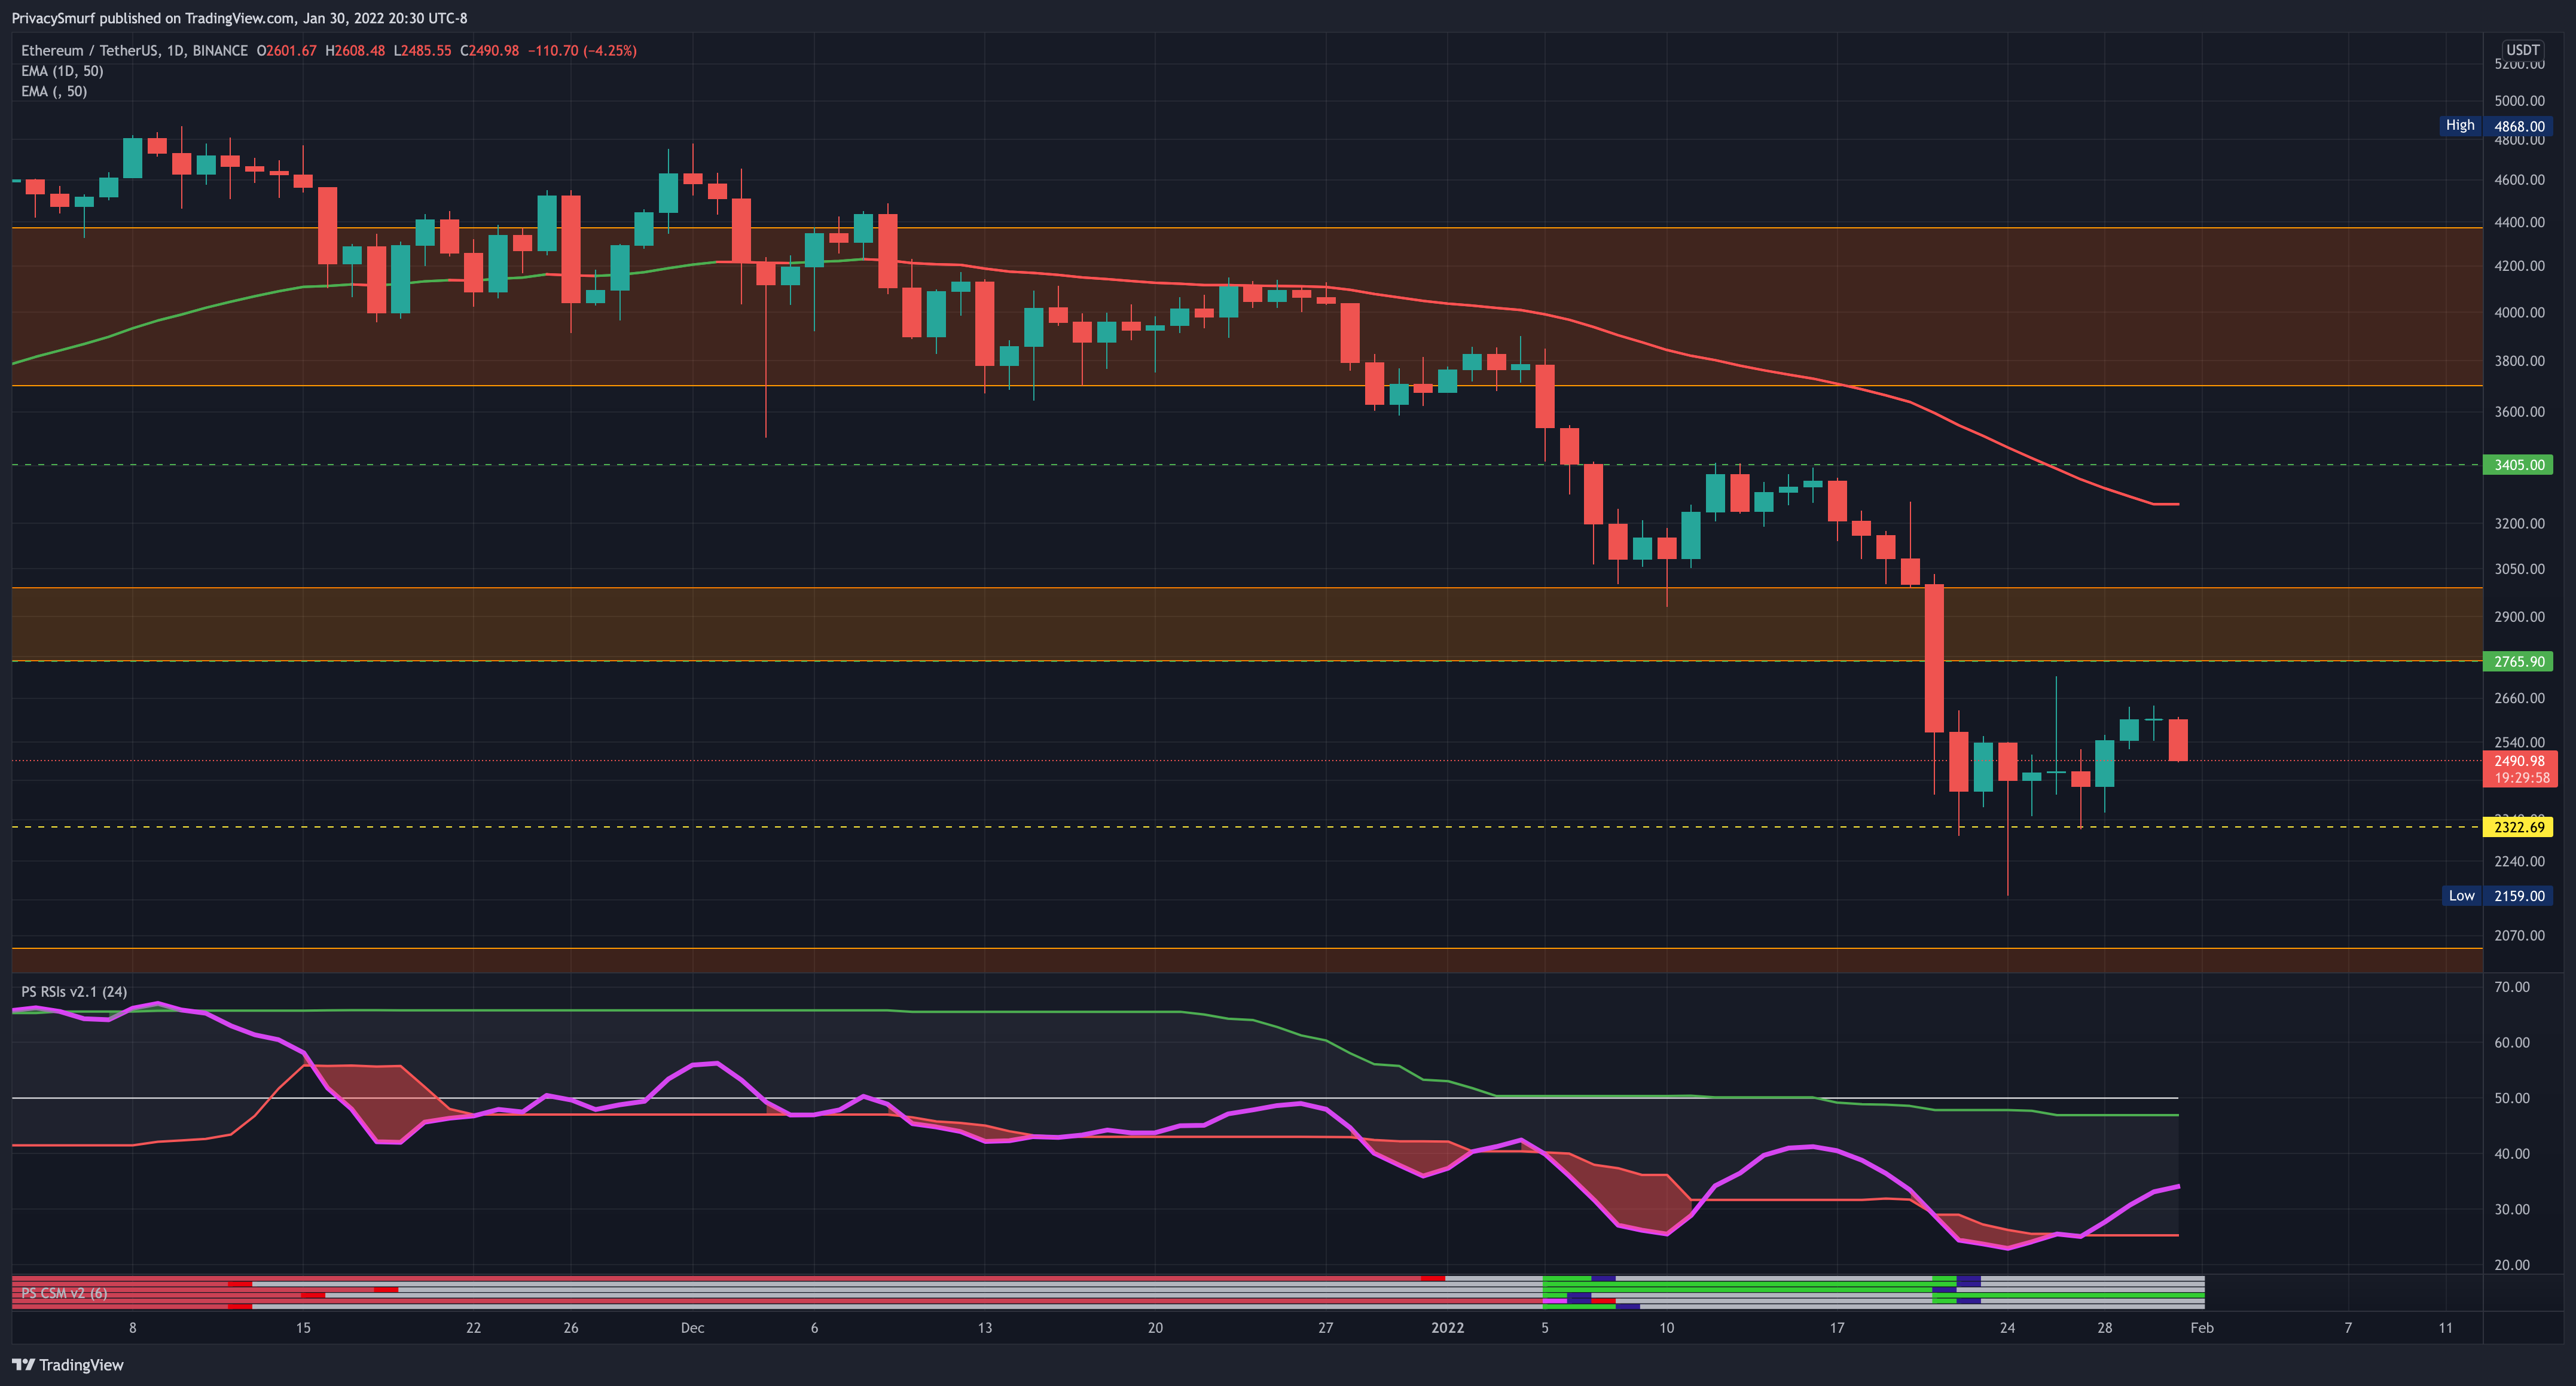
This week the ETH closes stayed in the proposed $2300 to $2700 range with wicks to both sides. I accidentally left the current bar on the chart, and luckily it supports the analysis. MOAR RANGE. I’m still expecting more consolidation in the same range.
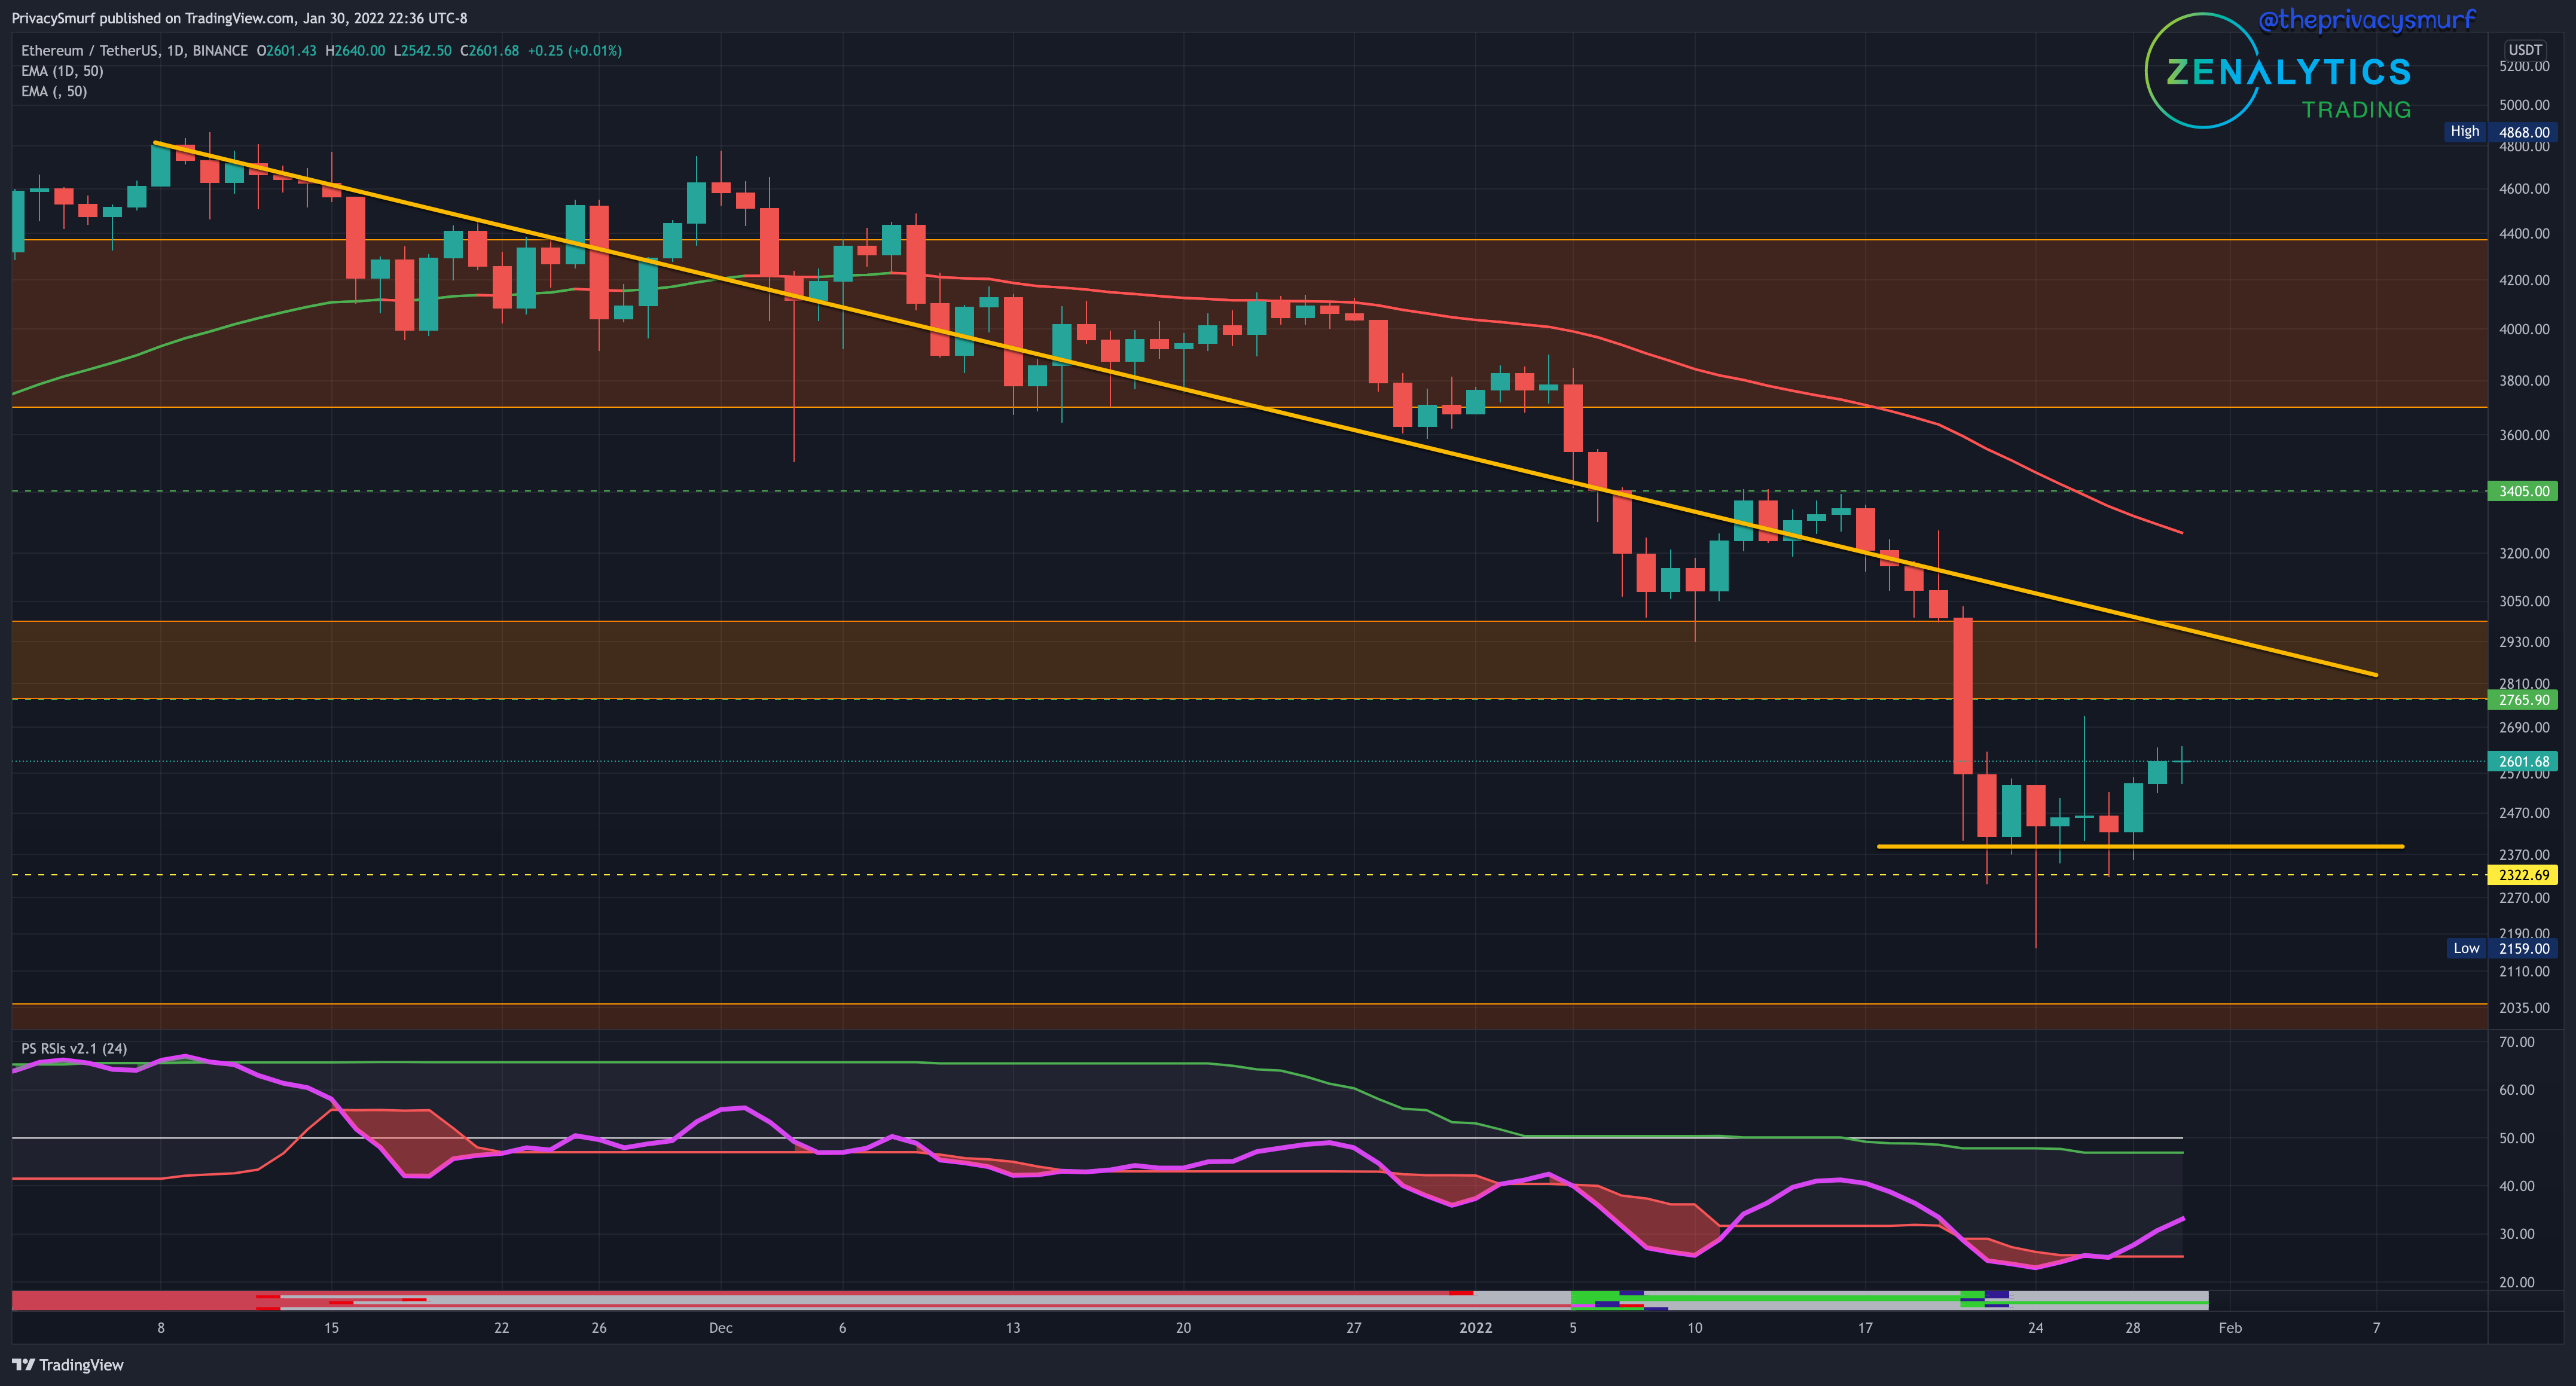
One could argue with a very badly drawn trend line we are nearing an inflection point of compression in price between horizontal support and the angular trend. We are in a bearish trend so the bias would be to the down side, but with the RSI trending up it’s not out if the picture that crossing above the midline and the adaptive top band will yield a quick bullish rally to test of the top of the ceiling of the range or even up to the 50-Day EMA.
If you missed my message or are new please help me spread my tweet/thoughts to the pro crypto analysts and crypto influencers about my alternative cycle theory. The shorter long term cycle has a better corellation to price data and timing market turns doesn’t require “lengthening” to identify tops/bottoms.
Here’s the tweet.

Here’s a quick explanation I made in the zoom call yesterday.
Thanks for your help. I really think it could end up creating a lot more cool models and alter a lot of widely accepted ideas.
@theprivacysmurf