

Sunday Synopsis #3


Another week in and more of the same. Welcome back to the free subscribers. Looks like I was right to urge caution with the bullish activity that was leading into the week. That kinda stinks though. I wish there were a lot of new things to say but this has been a pretty bland week and things are relatively unchanged big picture. I’m here for you regardless.
The can keeps getting kicked down the road. The same market structure price targets exist. The week managed to close above the 2 prior market low closes. Still no reasons for panic. The bullish market structure is still in place. A weekly close below the price of 32271 is still the indication of a potential shift in the market.

The weekly cycle is also unchanged. The cyclical low is approaching. Next weekend will mark the weekly cycle low. Bullish divergence on the higher timeframe hasn’t been invalidated yet by new lows in price or new lows on oscillators so I’m still in the opinion that we are in the bottoming patterns and just waiting for confidence and stability in the market to continue the bullish price action.

Takeaway: In the top photo of the market structure I added in a ray at the most recent low pivot at the 34703 price point and a ray at the high close at 39034. Those will likely act as some support and resistance. Price action below 34700 is the start of warning signs.
Are you tired of this picture? I sure am. At least it makes things simple. I just keep extending the ranges over and over. There’s really nothing much hidden on this chart. It’s clearly sideways. I don’t mean to say that it’s clear to see the chart is sideways, I mean to say that all the oscillators and measurements aren’t showing any hidden features to the price action. Oscillators are confirming the same thing price is saying. There’s a new ascending trendline connecting lows. If that continues to hold I anticipate erratic price action as the ascending and descending converge in the coming days. I’m leaning slightly bearish. A failure at 33440 would send the price back to the value area box at the bottom. I see a few positive things from that scenario. First, a lower low than 31111 would put in a higher low on many price action oscillators and setup bullish divergence coinciding with the cycle low model. Second, a low higher than 31111 would simply be a higher low, a bullish macro indication. A negative aspect to that failure though would be a further weakening of market sentiment. Many people act under the notion that the more support is tested the weaker it gets. Whether that’s objectively true or not revisiting lows over and over again is a drain on emotions and has the potential to be reflected in the price as decreased buying.
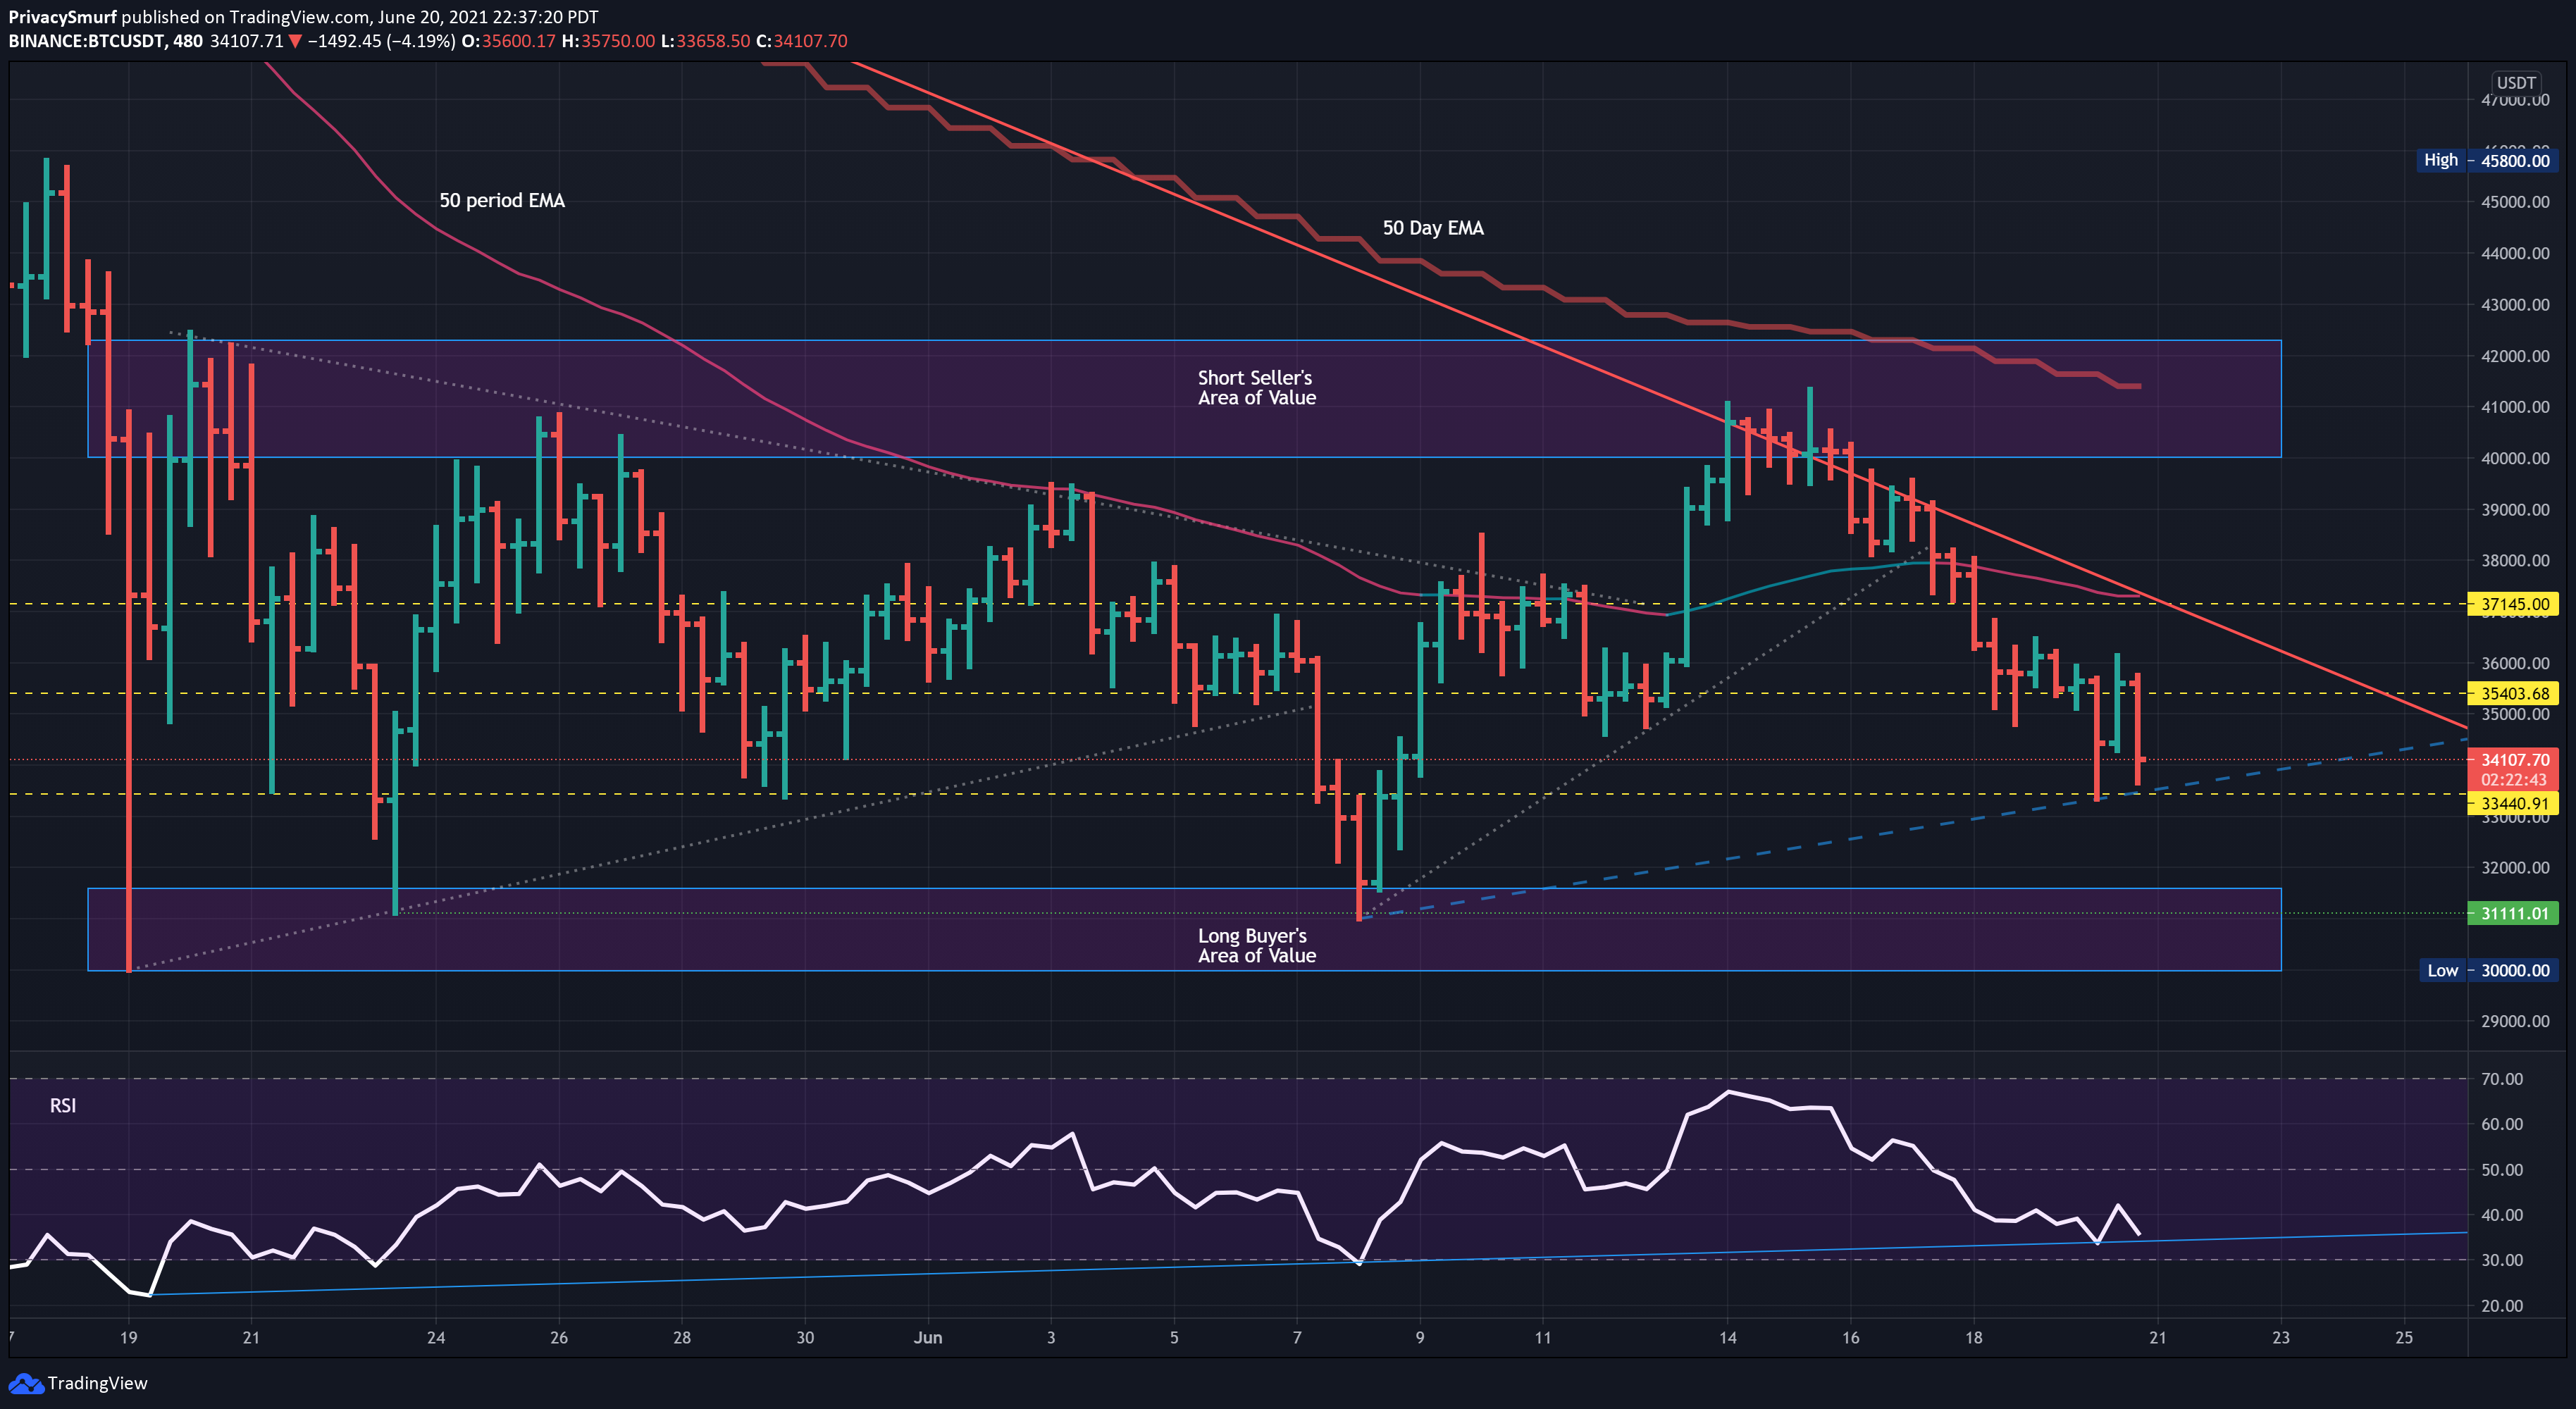
Takeaway: Overall, same a many weeks before. The big picture is bullish but price action is sideways. Move along. Don’t do anything until the price is outside of those two value large zones.

If you want to see some tight consolidation look no further than ETH/BTC. With BTC unable to break its range ETH’s value relative to BTC also has consolidated in a tight range between the 50-day EMA and the most recent lowest close.
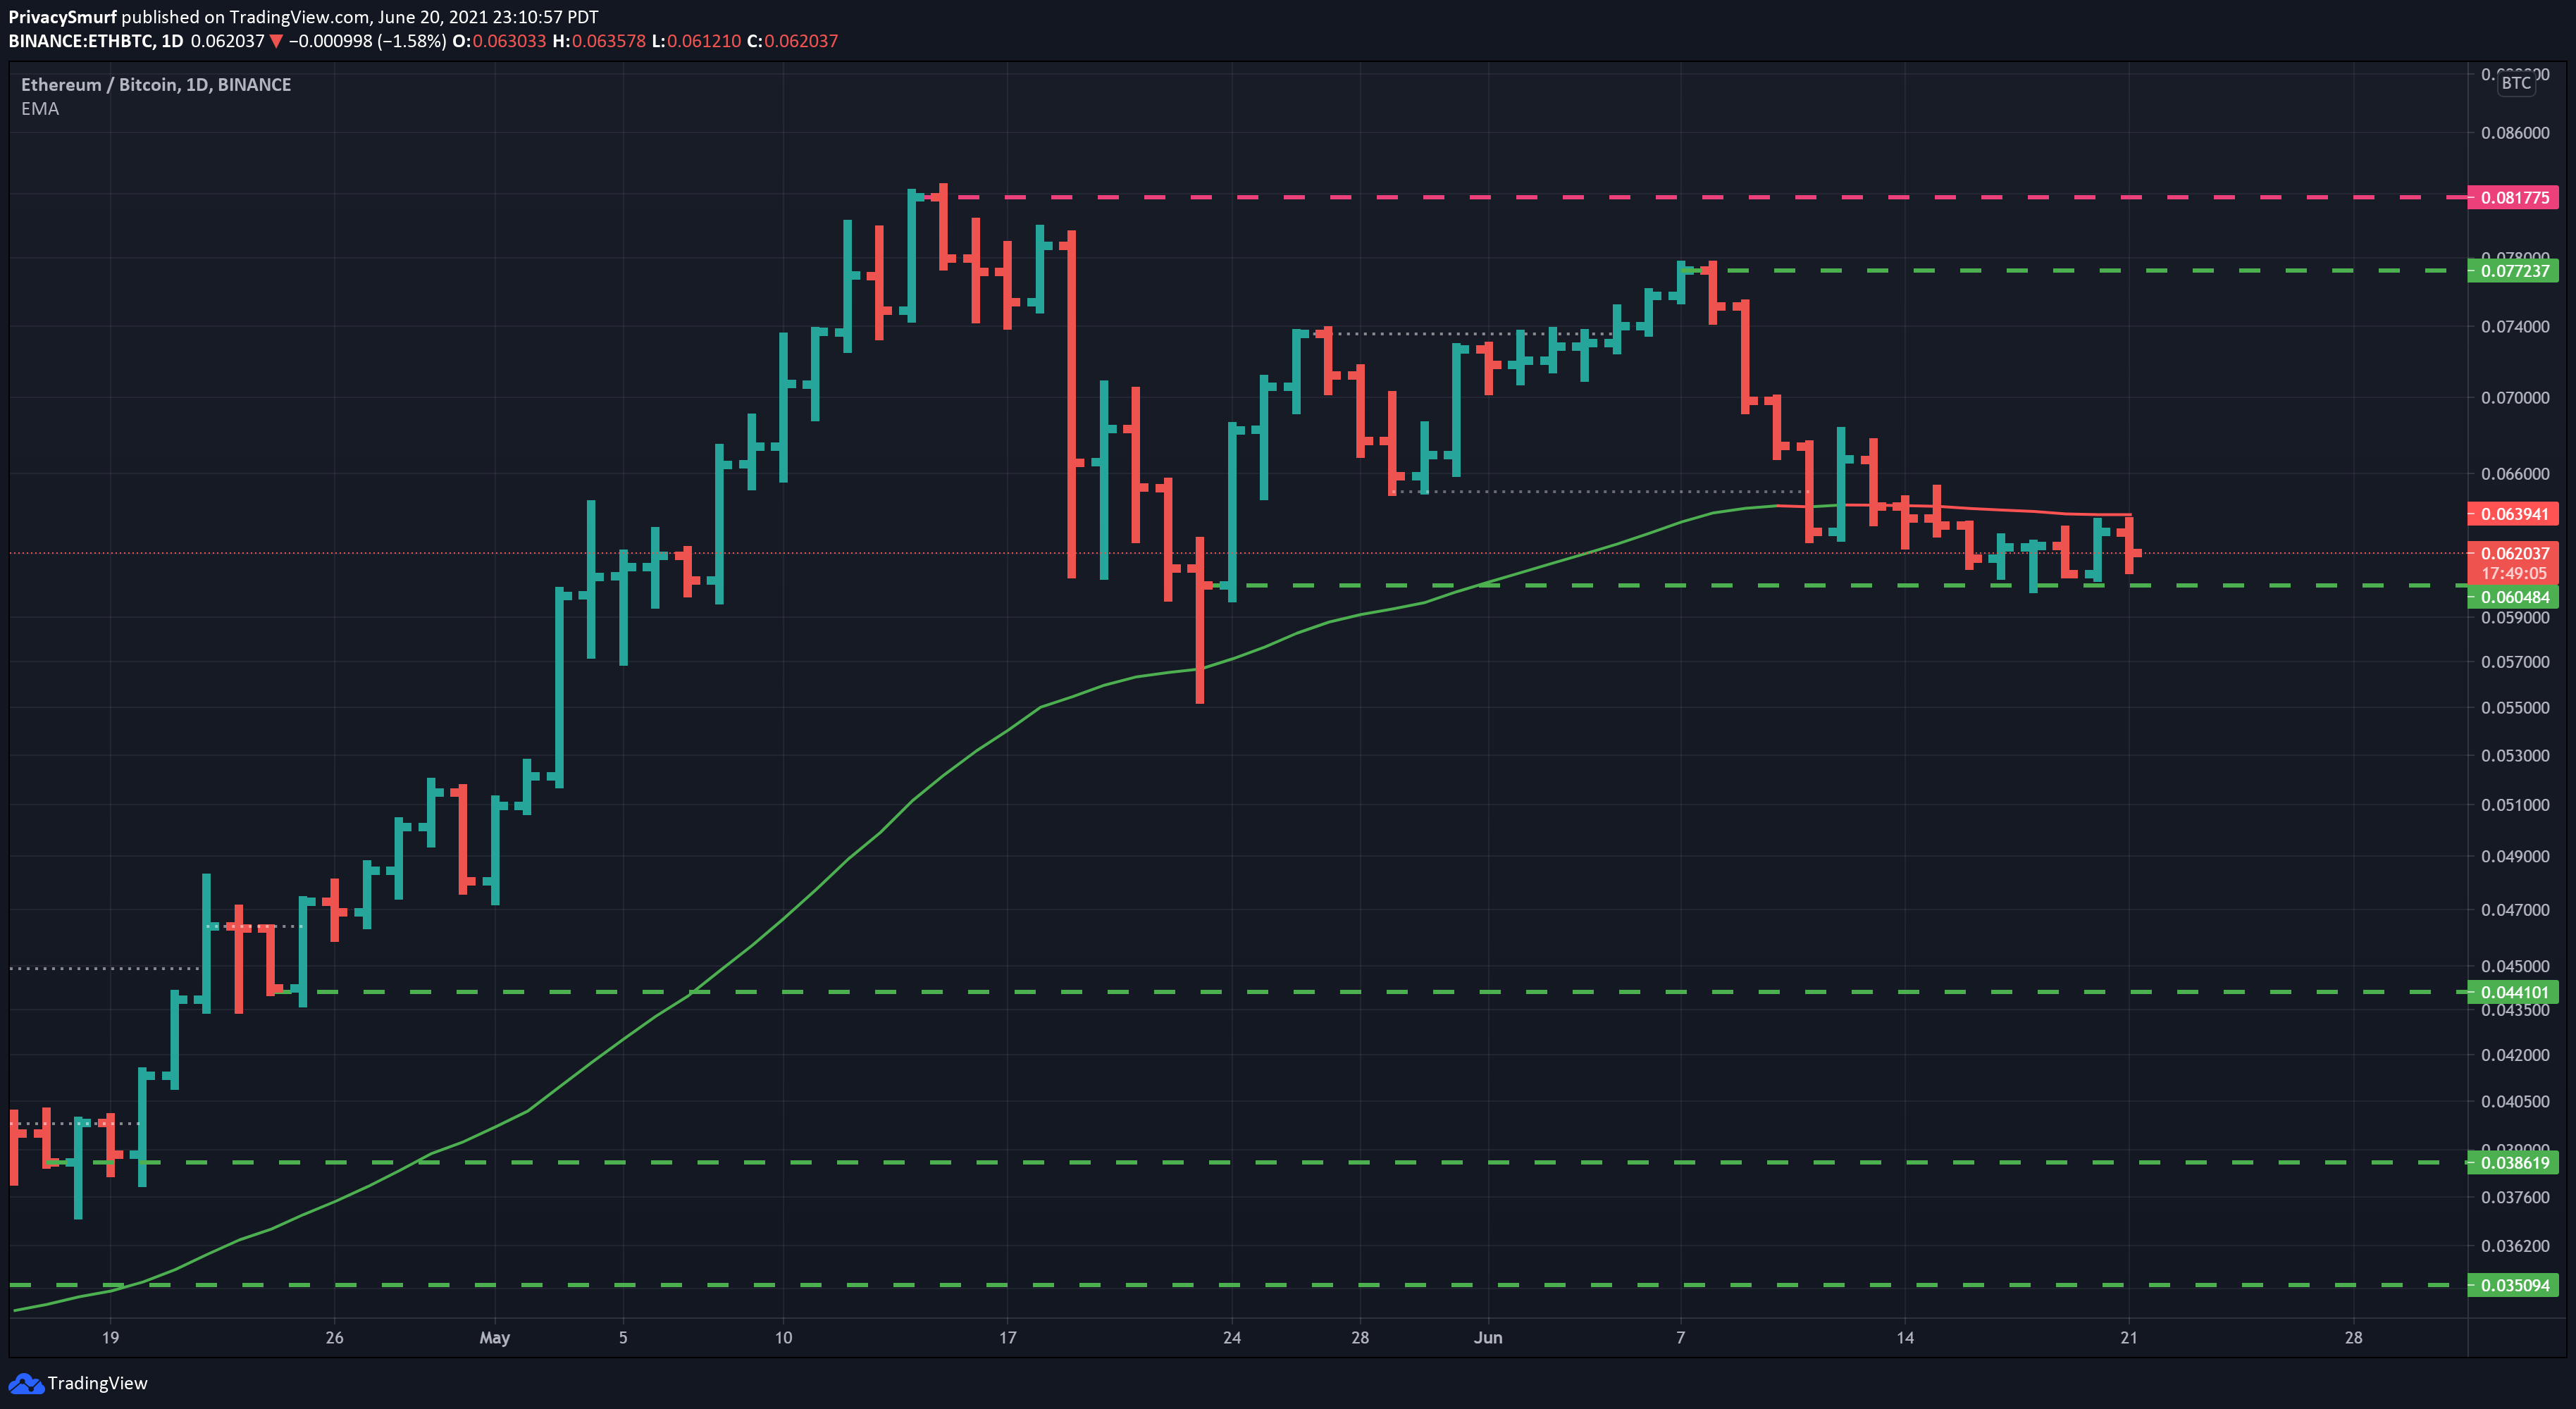
I’m slightly bearish on this relationship as the cyclical trend posted last week is down and ETH is printing a bearish setup against the USD but we’ll get to that in a second. Under the current support of 60484 sats there is a gap down to 55332 sats that doesn’t have a lot of trading volume. If the support fails this may lead to a quick drop through that space.

Takeaway: ETH may take a hit in its value compared to BTC. The bullish price action of BTC at the beginning of last week did no favors for ETH and is barely noticeable here. This correlation is falling away. Further ranging of BTC or failure of ETH is likely to make this chart print some lower lows.
Last Sunday’s ETH outlook, for paid subscribers, was on point.

Price took a dive all week breaking down to lows of 2040…
As I’m typing this BTC is falling out…. That’s twice now. Happened in my first Micro Monday post, lol. Back to the synopsis.
ETH has a little bit of support down in a zone from 1728-1888 which will likely give some bounce but it’s still a pretty bearish picture. Prices getting into the low zone will likely put the RSI into an oversold region but it could also be a lower low on the RSI which doesn’t point towards a strong immediate bullish rally just yet.
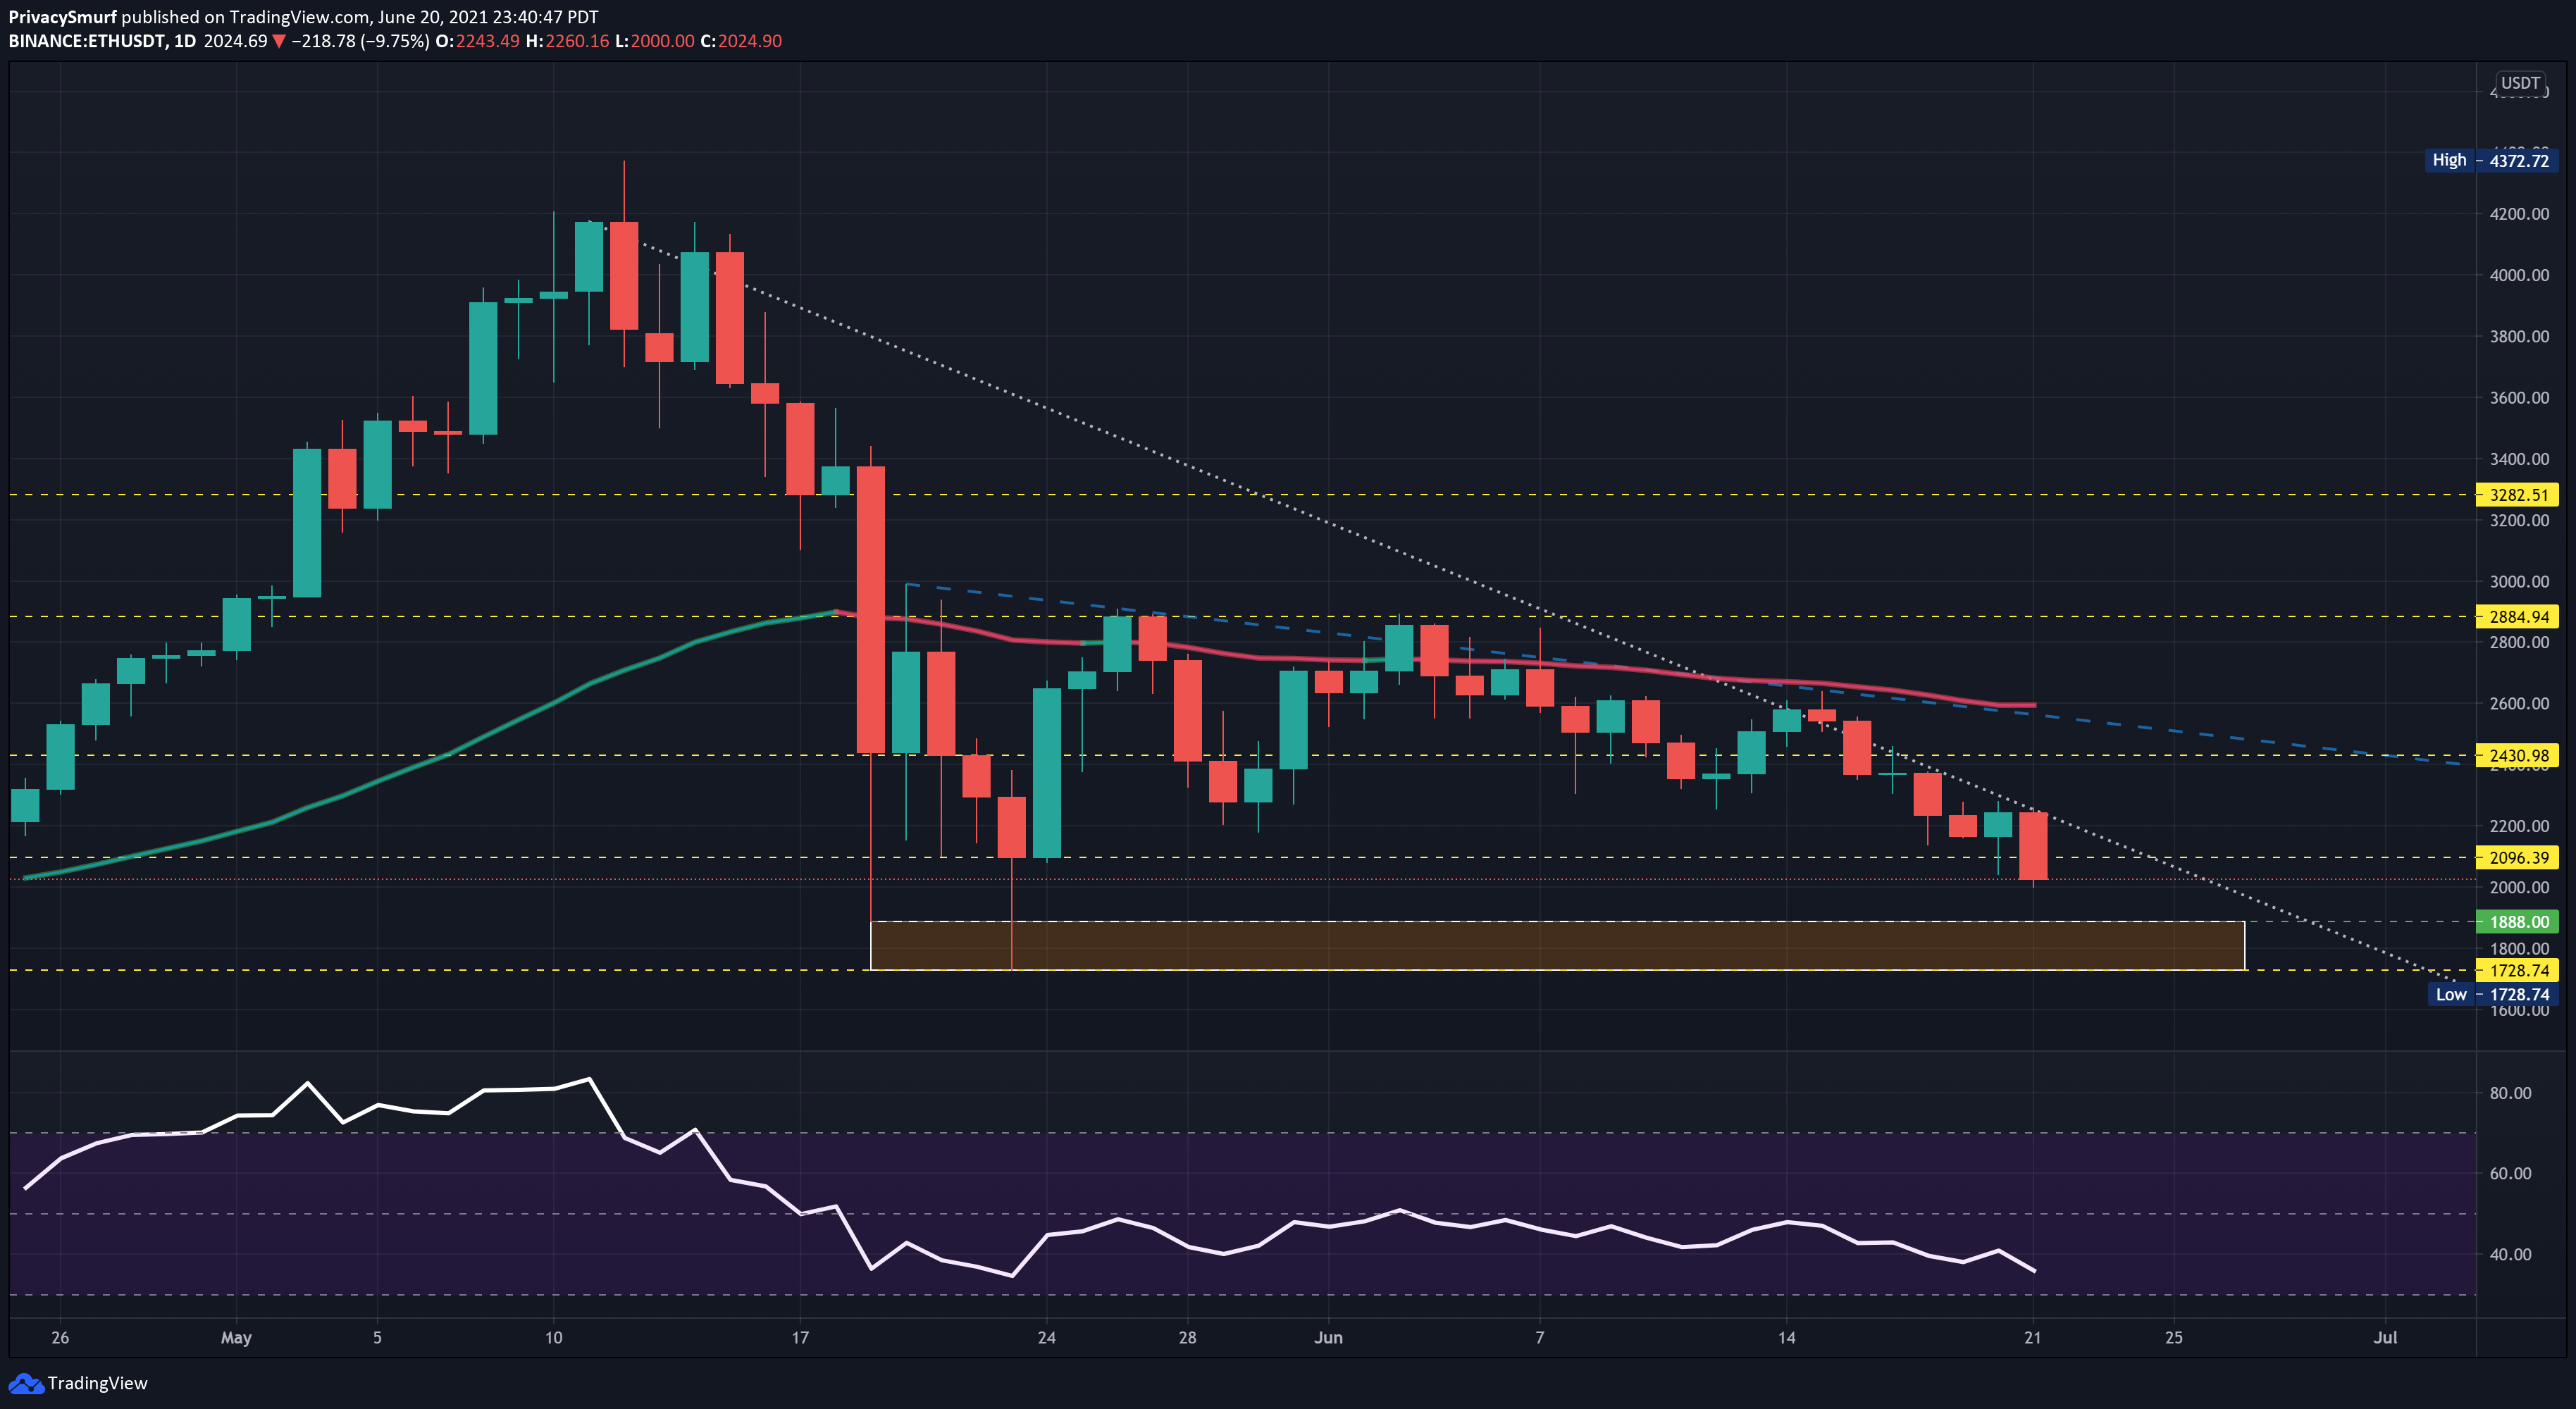
Takeaway: The longer BTC stays unstable the more ETH seems to be taking the hits for it. I’d anticipate a bounce from the low price zone but the ceiling on that return will probably be a low one. Resistances at 2096 and 2400.
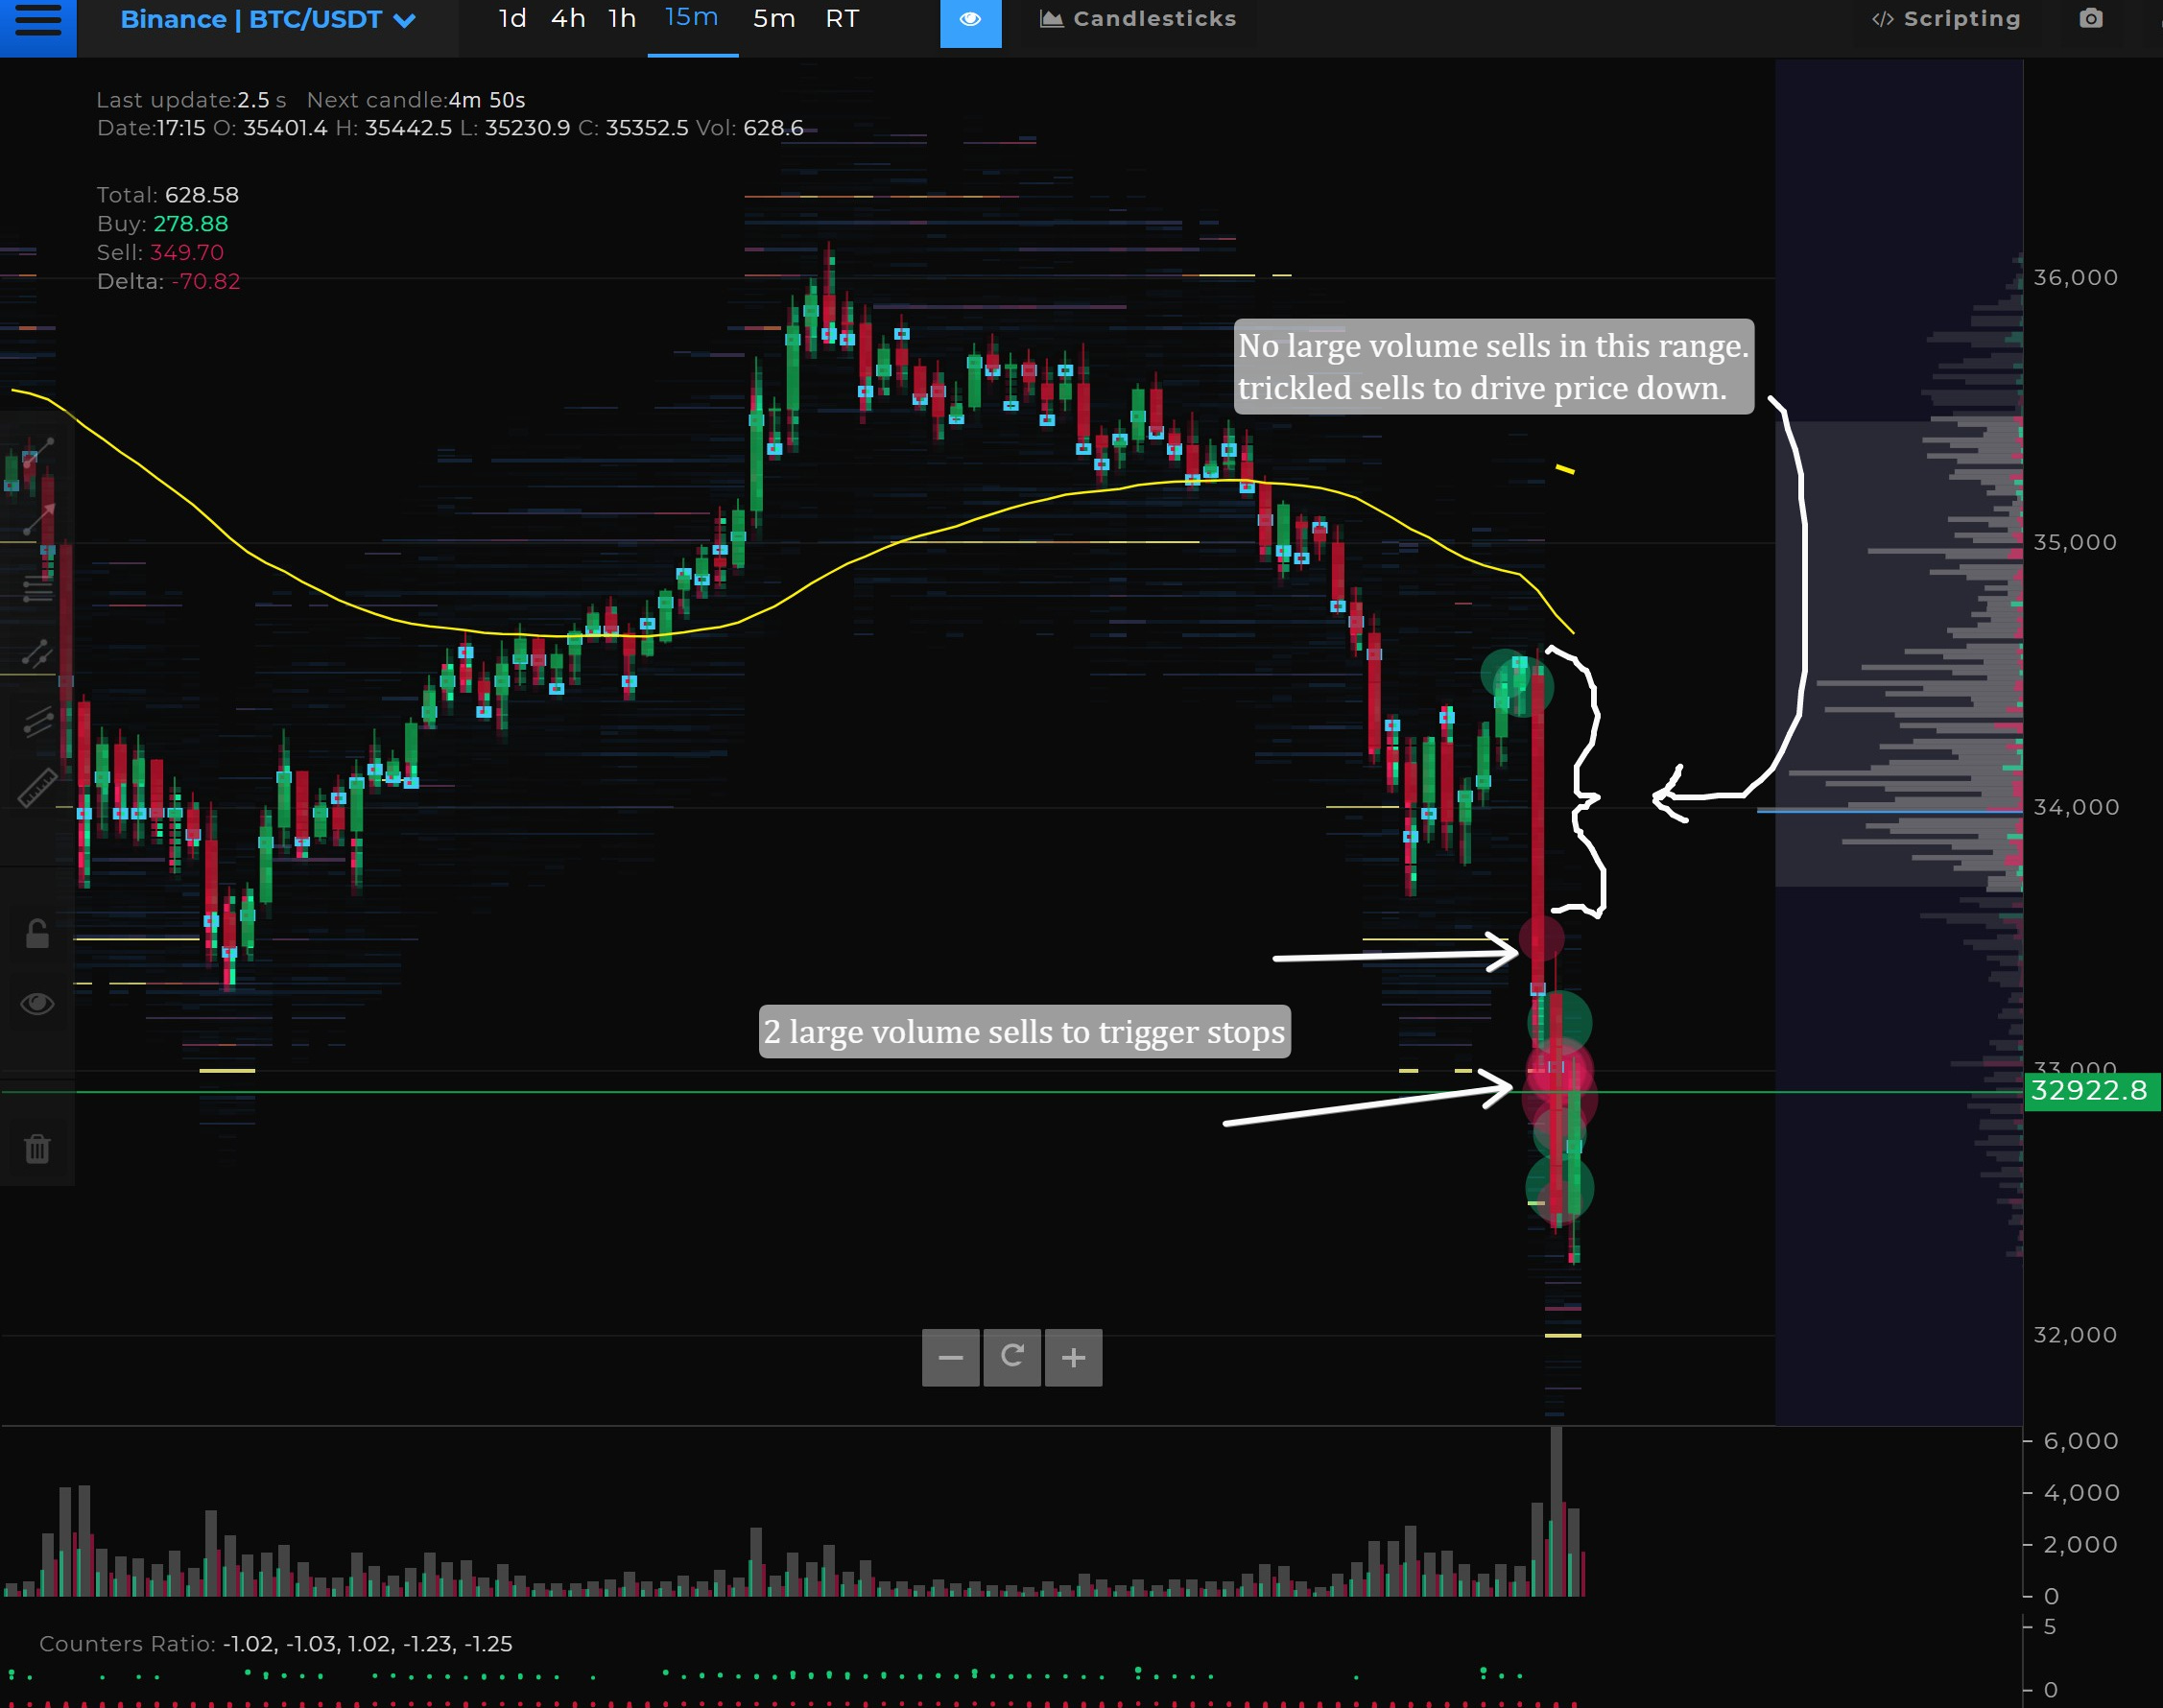
Whew. Looks like we just had 2 big stop runs. Hope you were safe and not leveraged hard and liquidated. No bullish divergences on lower timeframes so the bleeding isn’t over yet. I imagine the price will get down to the buyer’s value area in the photo up top that' I’ve been reposting over and over.
See you tomorrow in the paid section for Micro Monday.
@theprivacysmurf