

Sunday Synopsis #30: Something New
Sunday Synopsis #30: Something New

For once we broke daily support and we’ve got “Something New” to talk about.
BTC/USDT Weekly Structure
https://www.tradingview.com/chart/4v8qizyI/
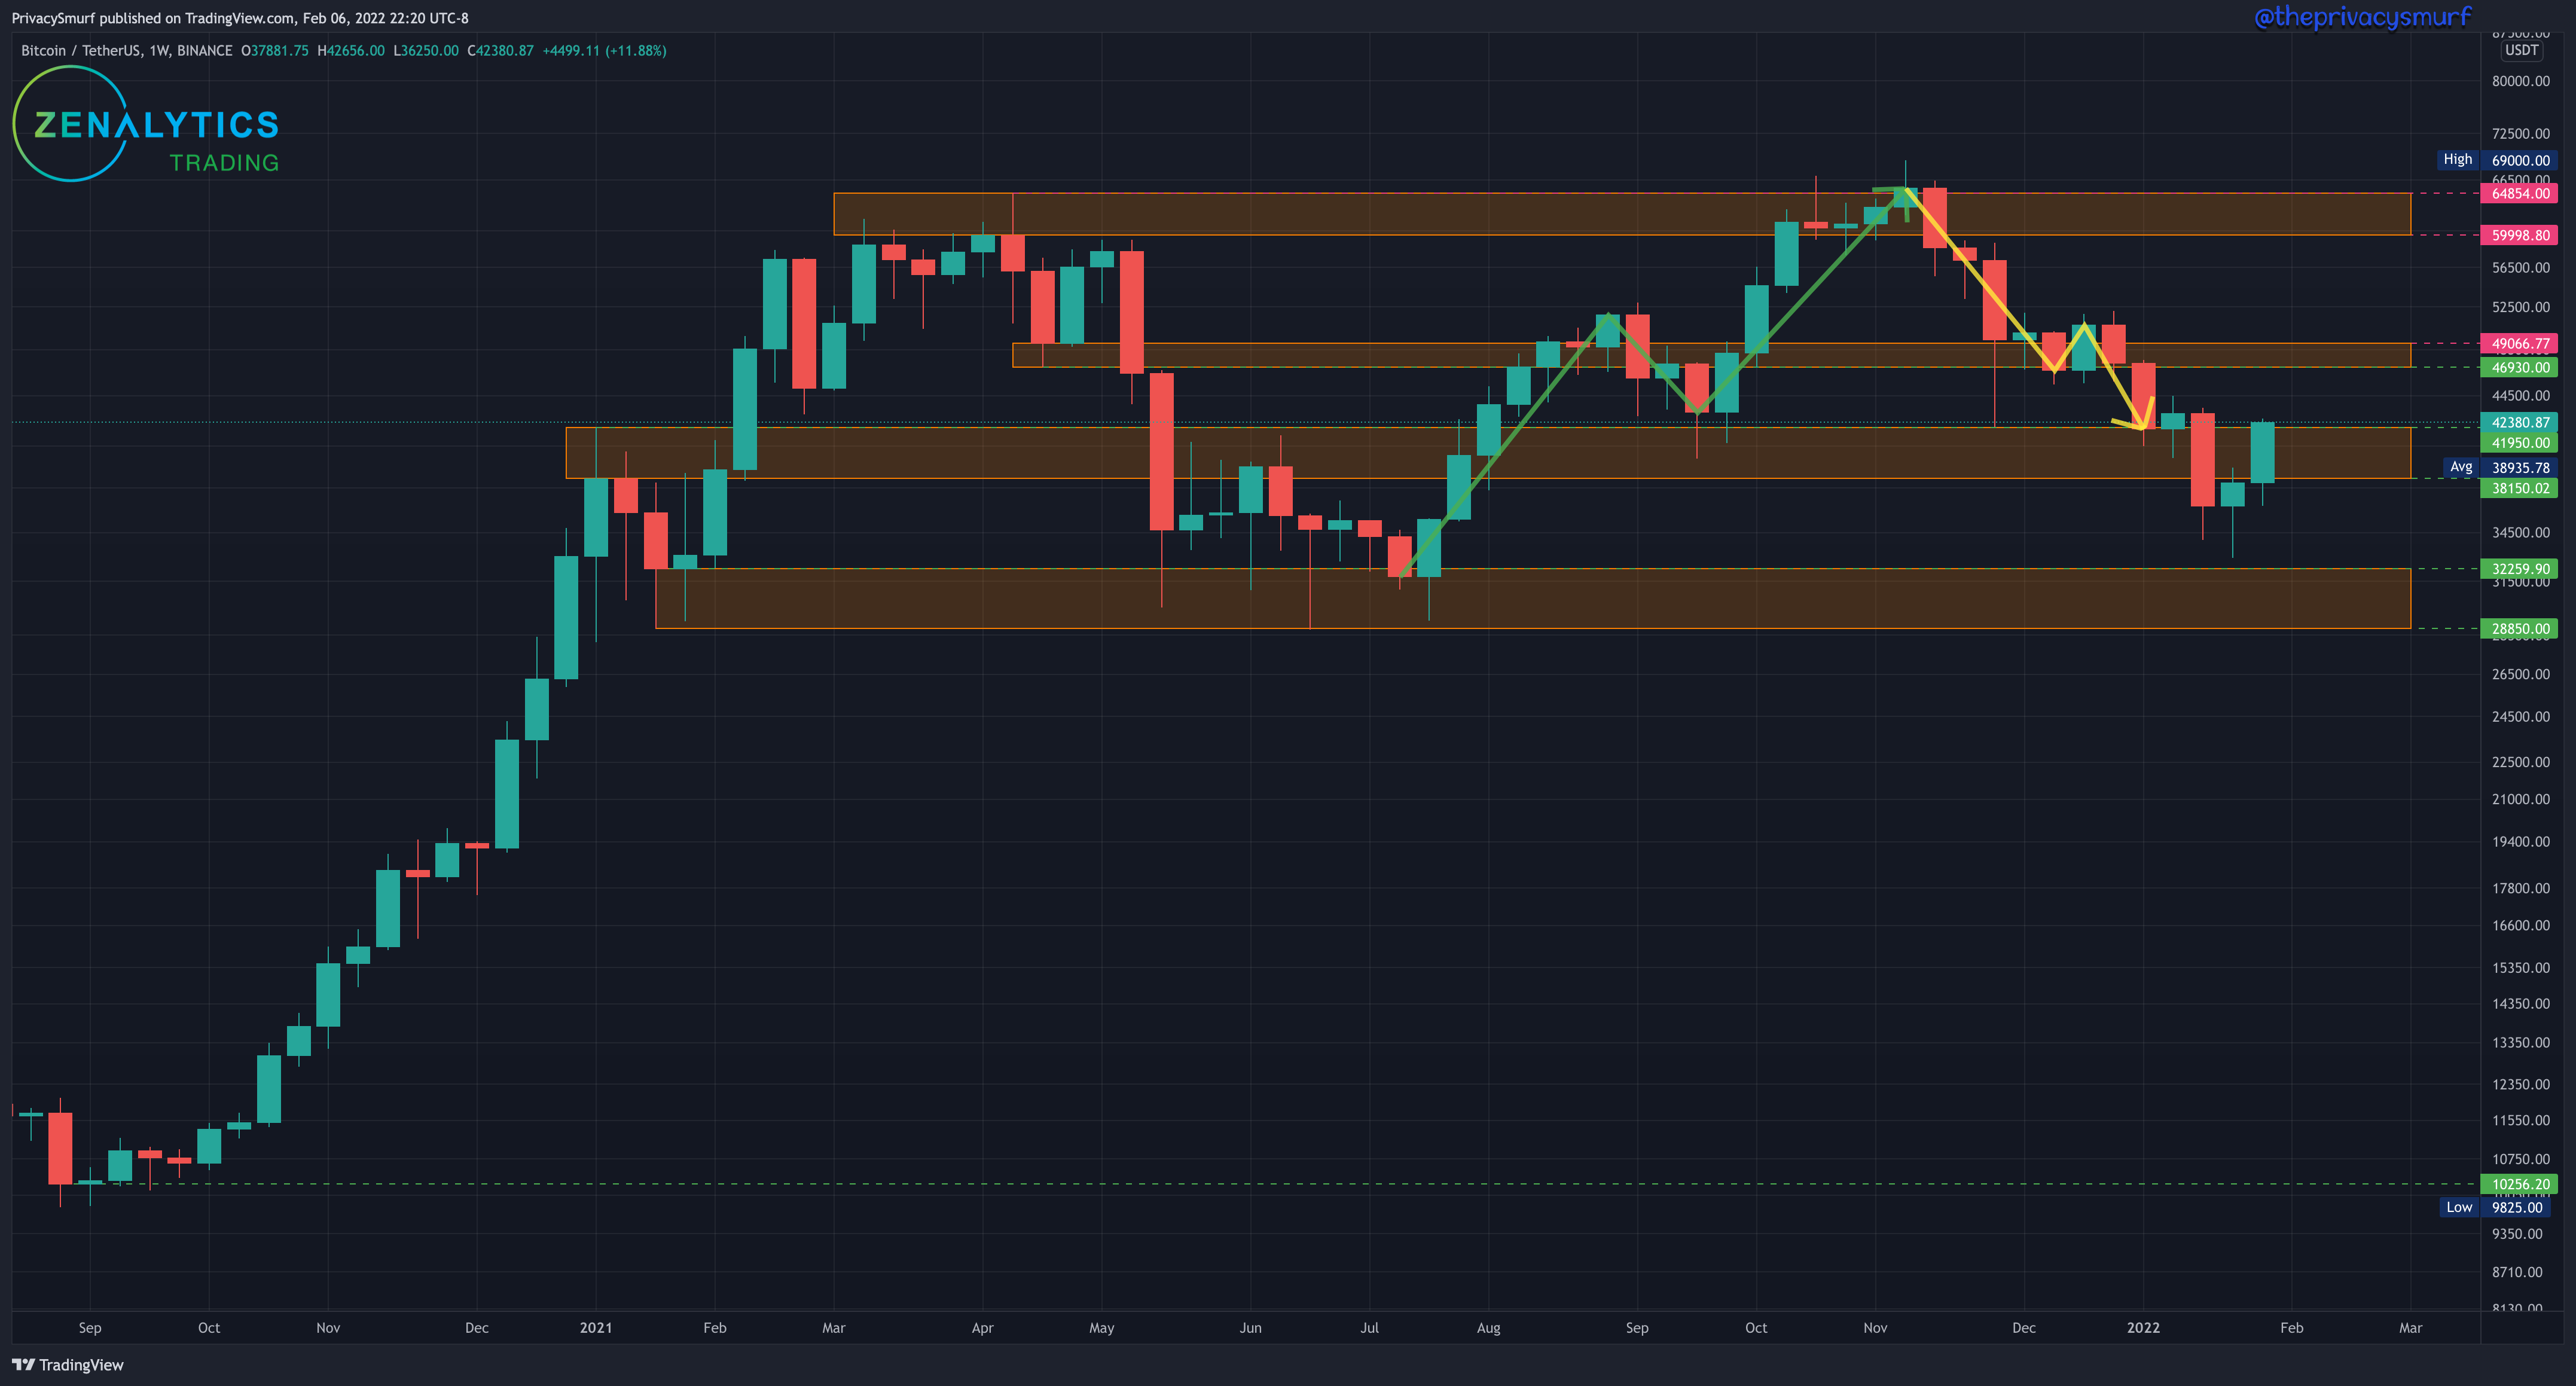
Another up week and a close above the support. The market structure trend is still in a bullish consolidation pattern. There needs to be a down week and follow-on up week breaking the pivot high close to swap back to a bullish trend. Paid subscribers will remember (hopefully) the Q1 forecast from Jan 1.
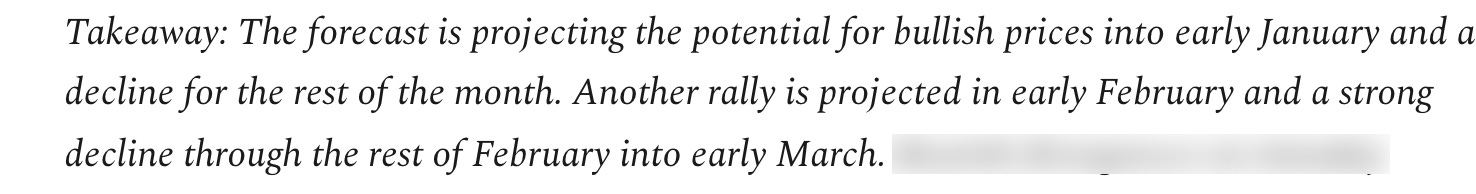
All is playing out accordingly to the price cycle forecast I provided. Perhaps this rally here and decline later in the month is where we establish a higher low pivot and move back up in March to confirm the bullish trend and ride that out until late summer before we see a market shift again. Weekly resistance will be around the $47k mark. There are still low targets sub 30k and those are not ruled out with this rally. The probabilities do decrease as time moves on though.If this rally doesn’t make it too high those may come back into the picture around March, but that’s pure speculation and not something to bank on.
BTC/USDT Daily Chart
https://www.tradingview.com/chart/jjSdFW4b/
Earlier this week I tweeted this.


We are officially closed above that ceiling on the daily chart with the Sunday close.
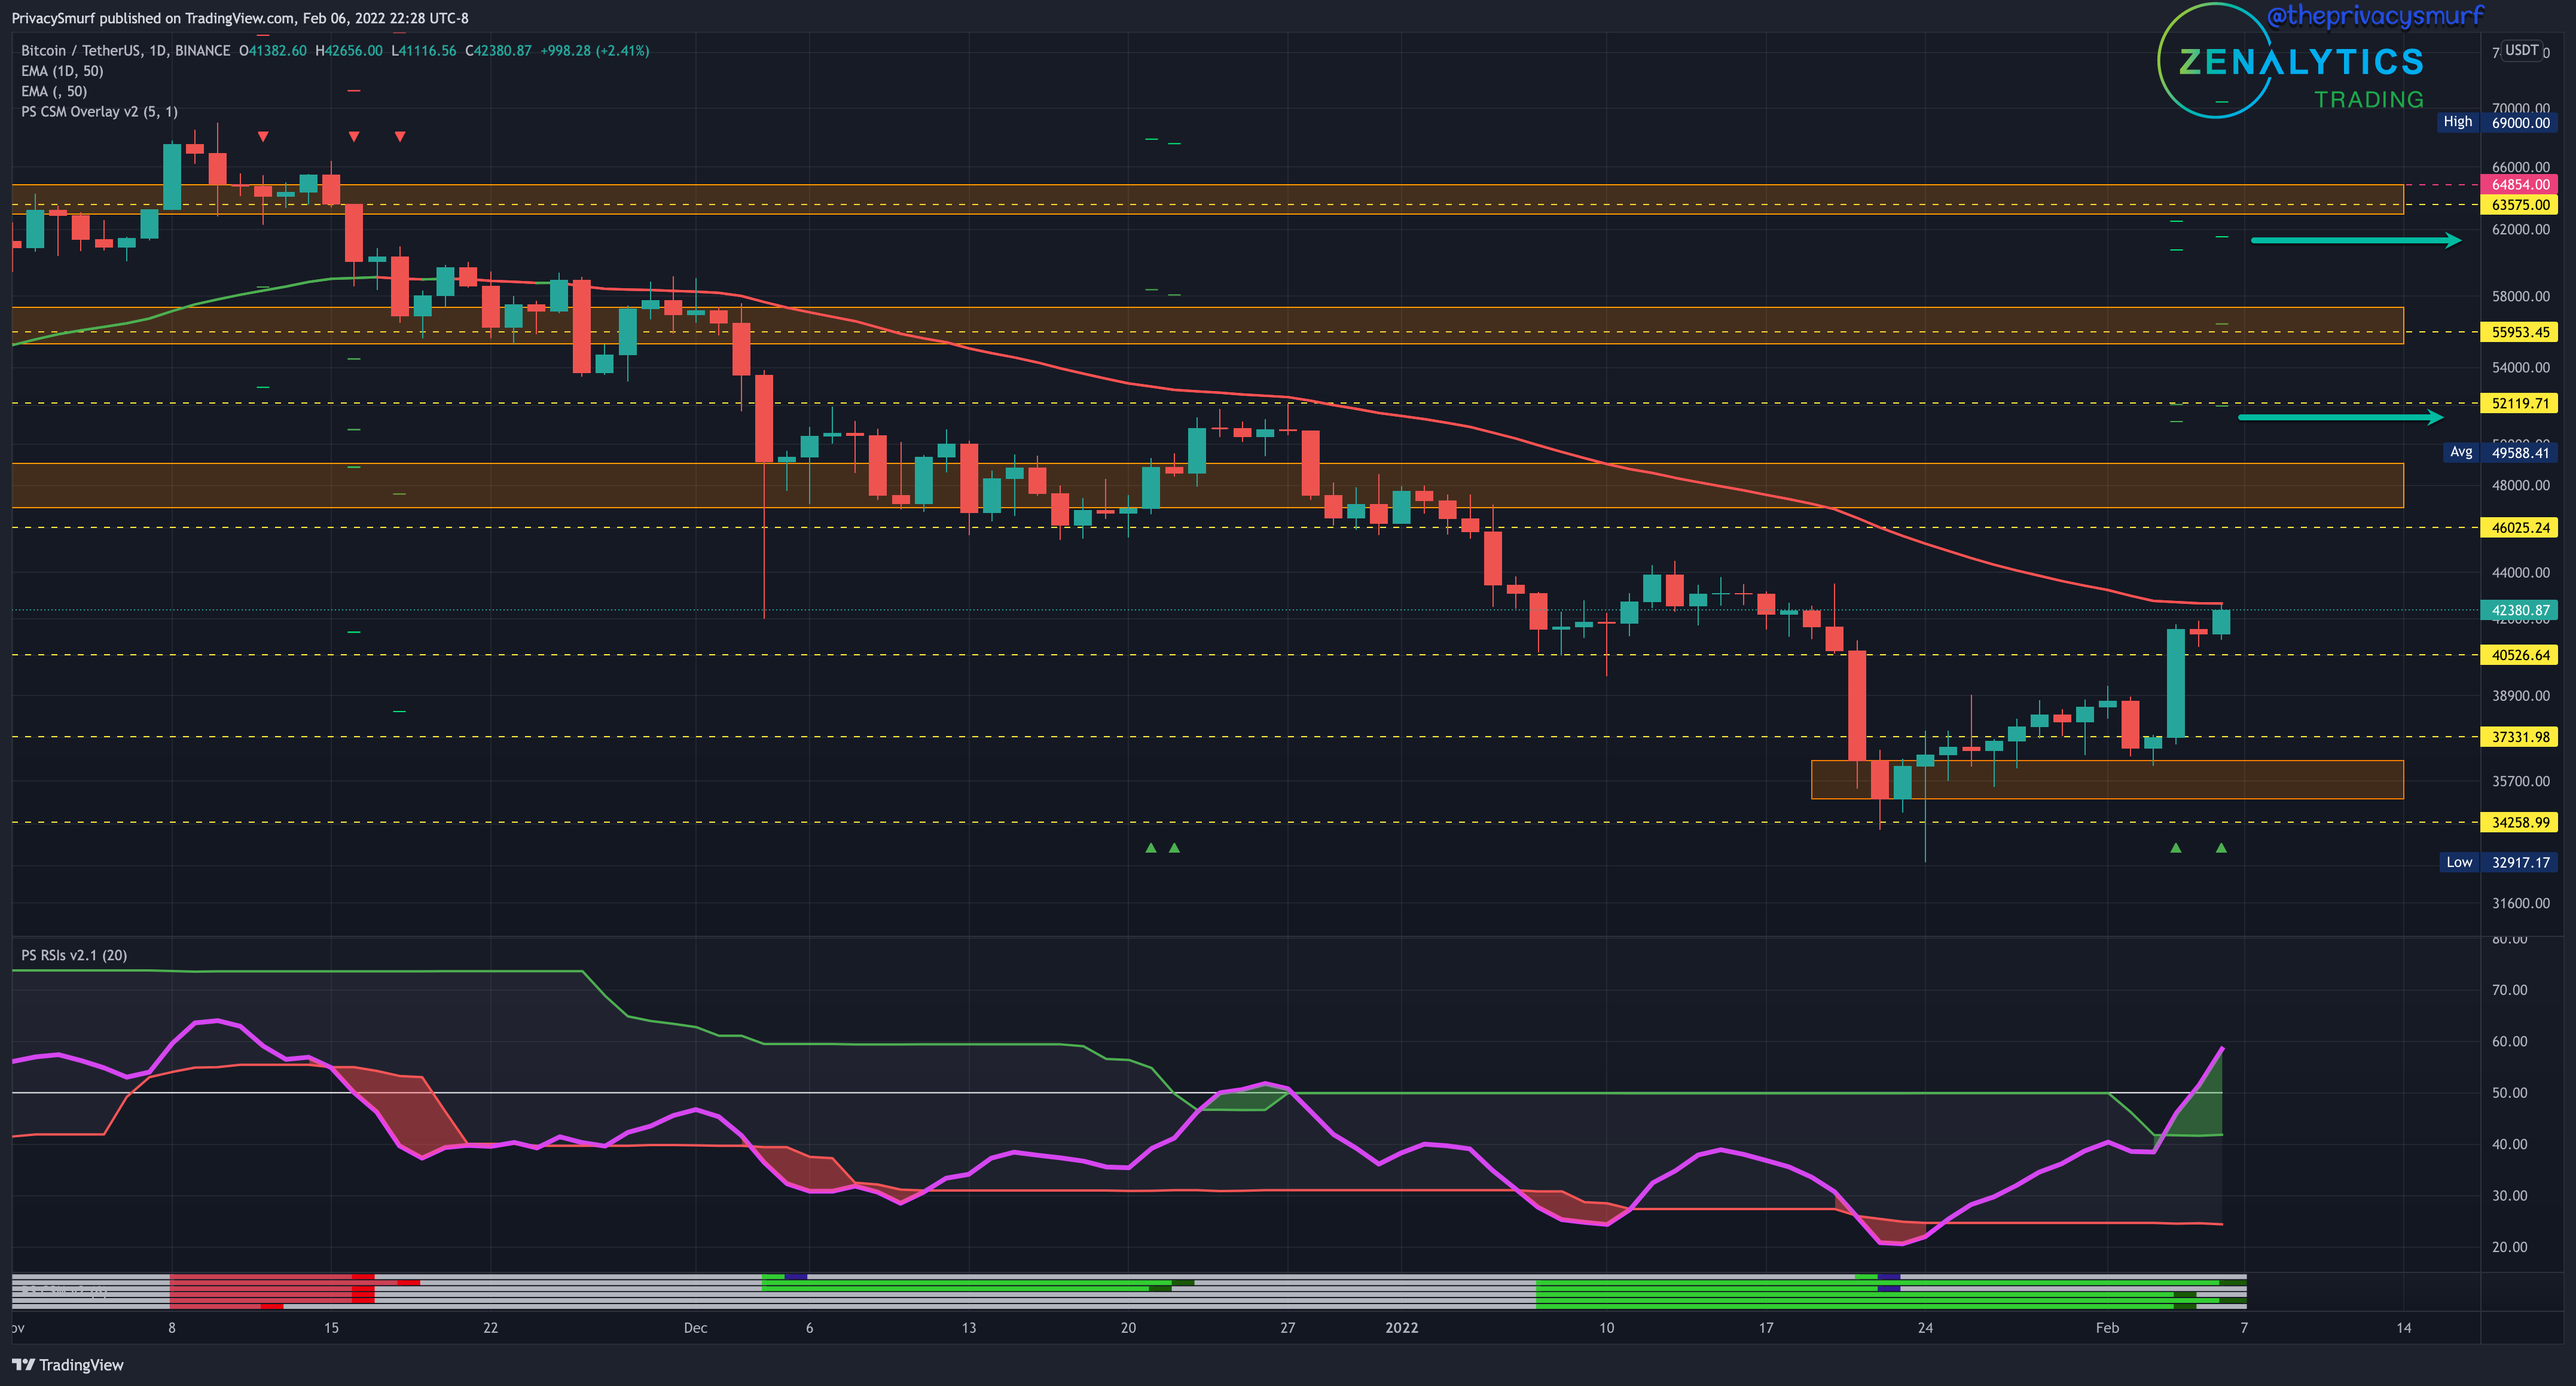
From my point of view, that’s the first daily close over a lost floor since we started this fall in November. So… that’s good. The suggested $40.5k ceiling held on like a champ until some volume came in and wiped out a bunch of shorts in liquidations and triggered a bullish divergence trade with targets for profit at the green horizontal arrows. I also added in a new range floor areound $35k.
On Friday night in case you missed it, this was posted.
The Sunday close is sitting under the 50-Day EMA still which I expect to be some resistance as the trend is still down. A support test down to 38-40k is what I would expect on a return from the EMA but overall the technicals are bullish. For the week I’d put a tentative range from $38k-$45k this week. I’d also be looking to buy that range low for my 3-8 month positions.
ETH/BTC Weekly Structure
https://www.tradingview.com/chart/sacHlXOv/
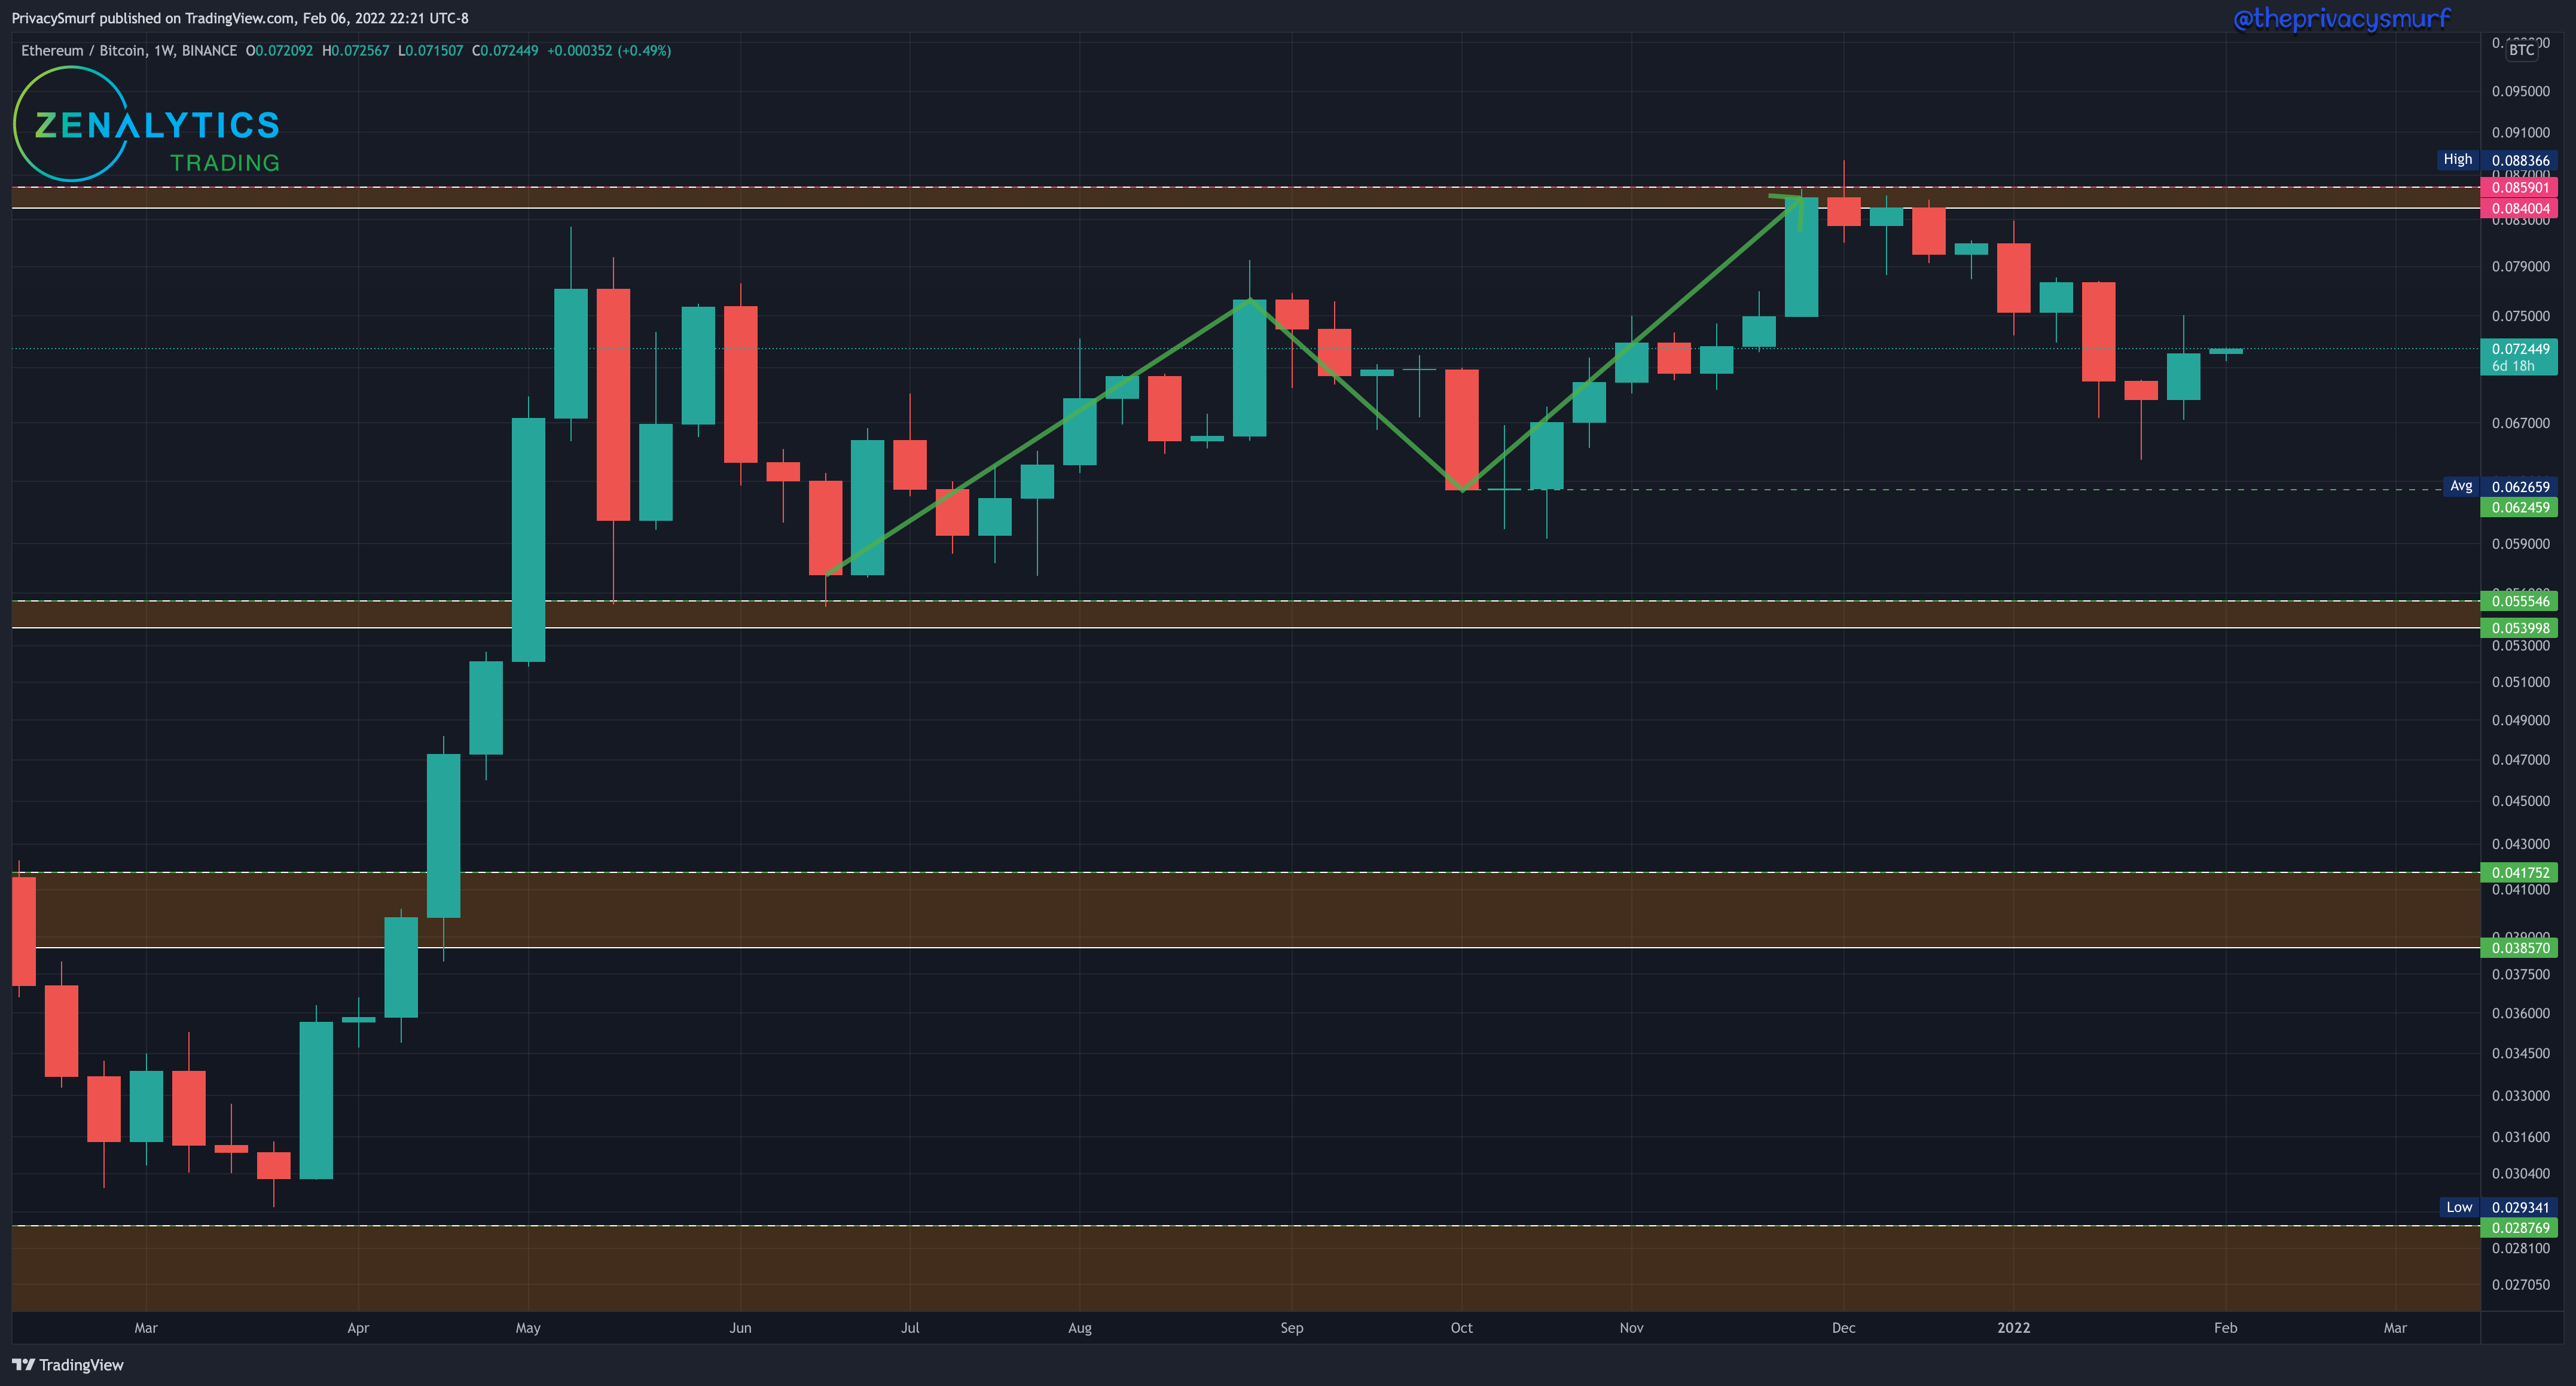
The weekly chart of ETH/BTC closed bullish, and I forgot to remove the opening candle of this week, oh well. With ETH/BTC following the BTC weekly chart at the moment there’s no long-term rotational play to be made moving BTC to ETH. I’d expect a slight resistance at the 0.78 mark this week.
ETH/BTC Daily Chart
https://www.tradingview.com/chart/gTkSjkj6/
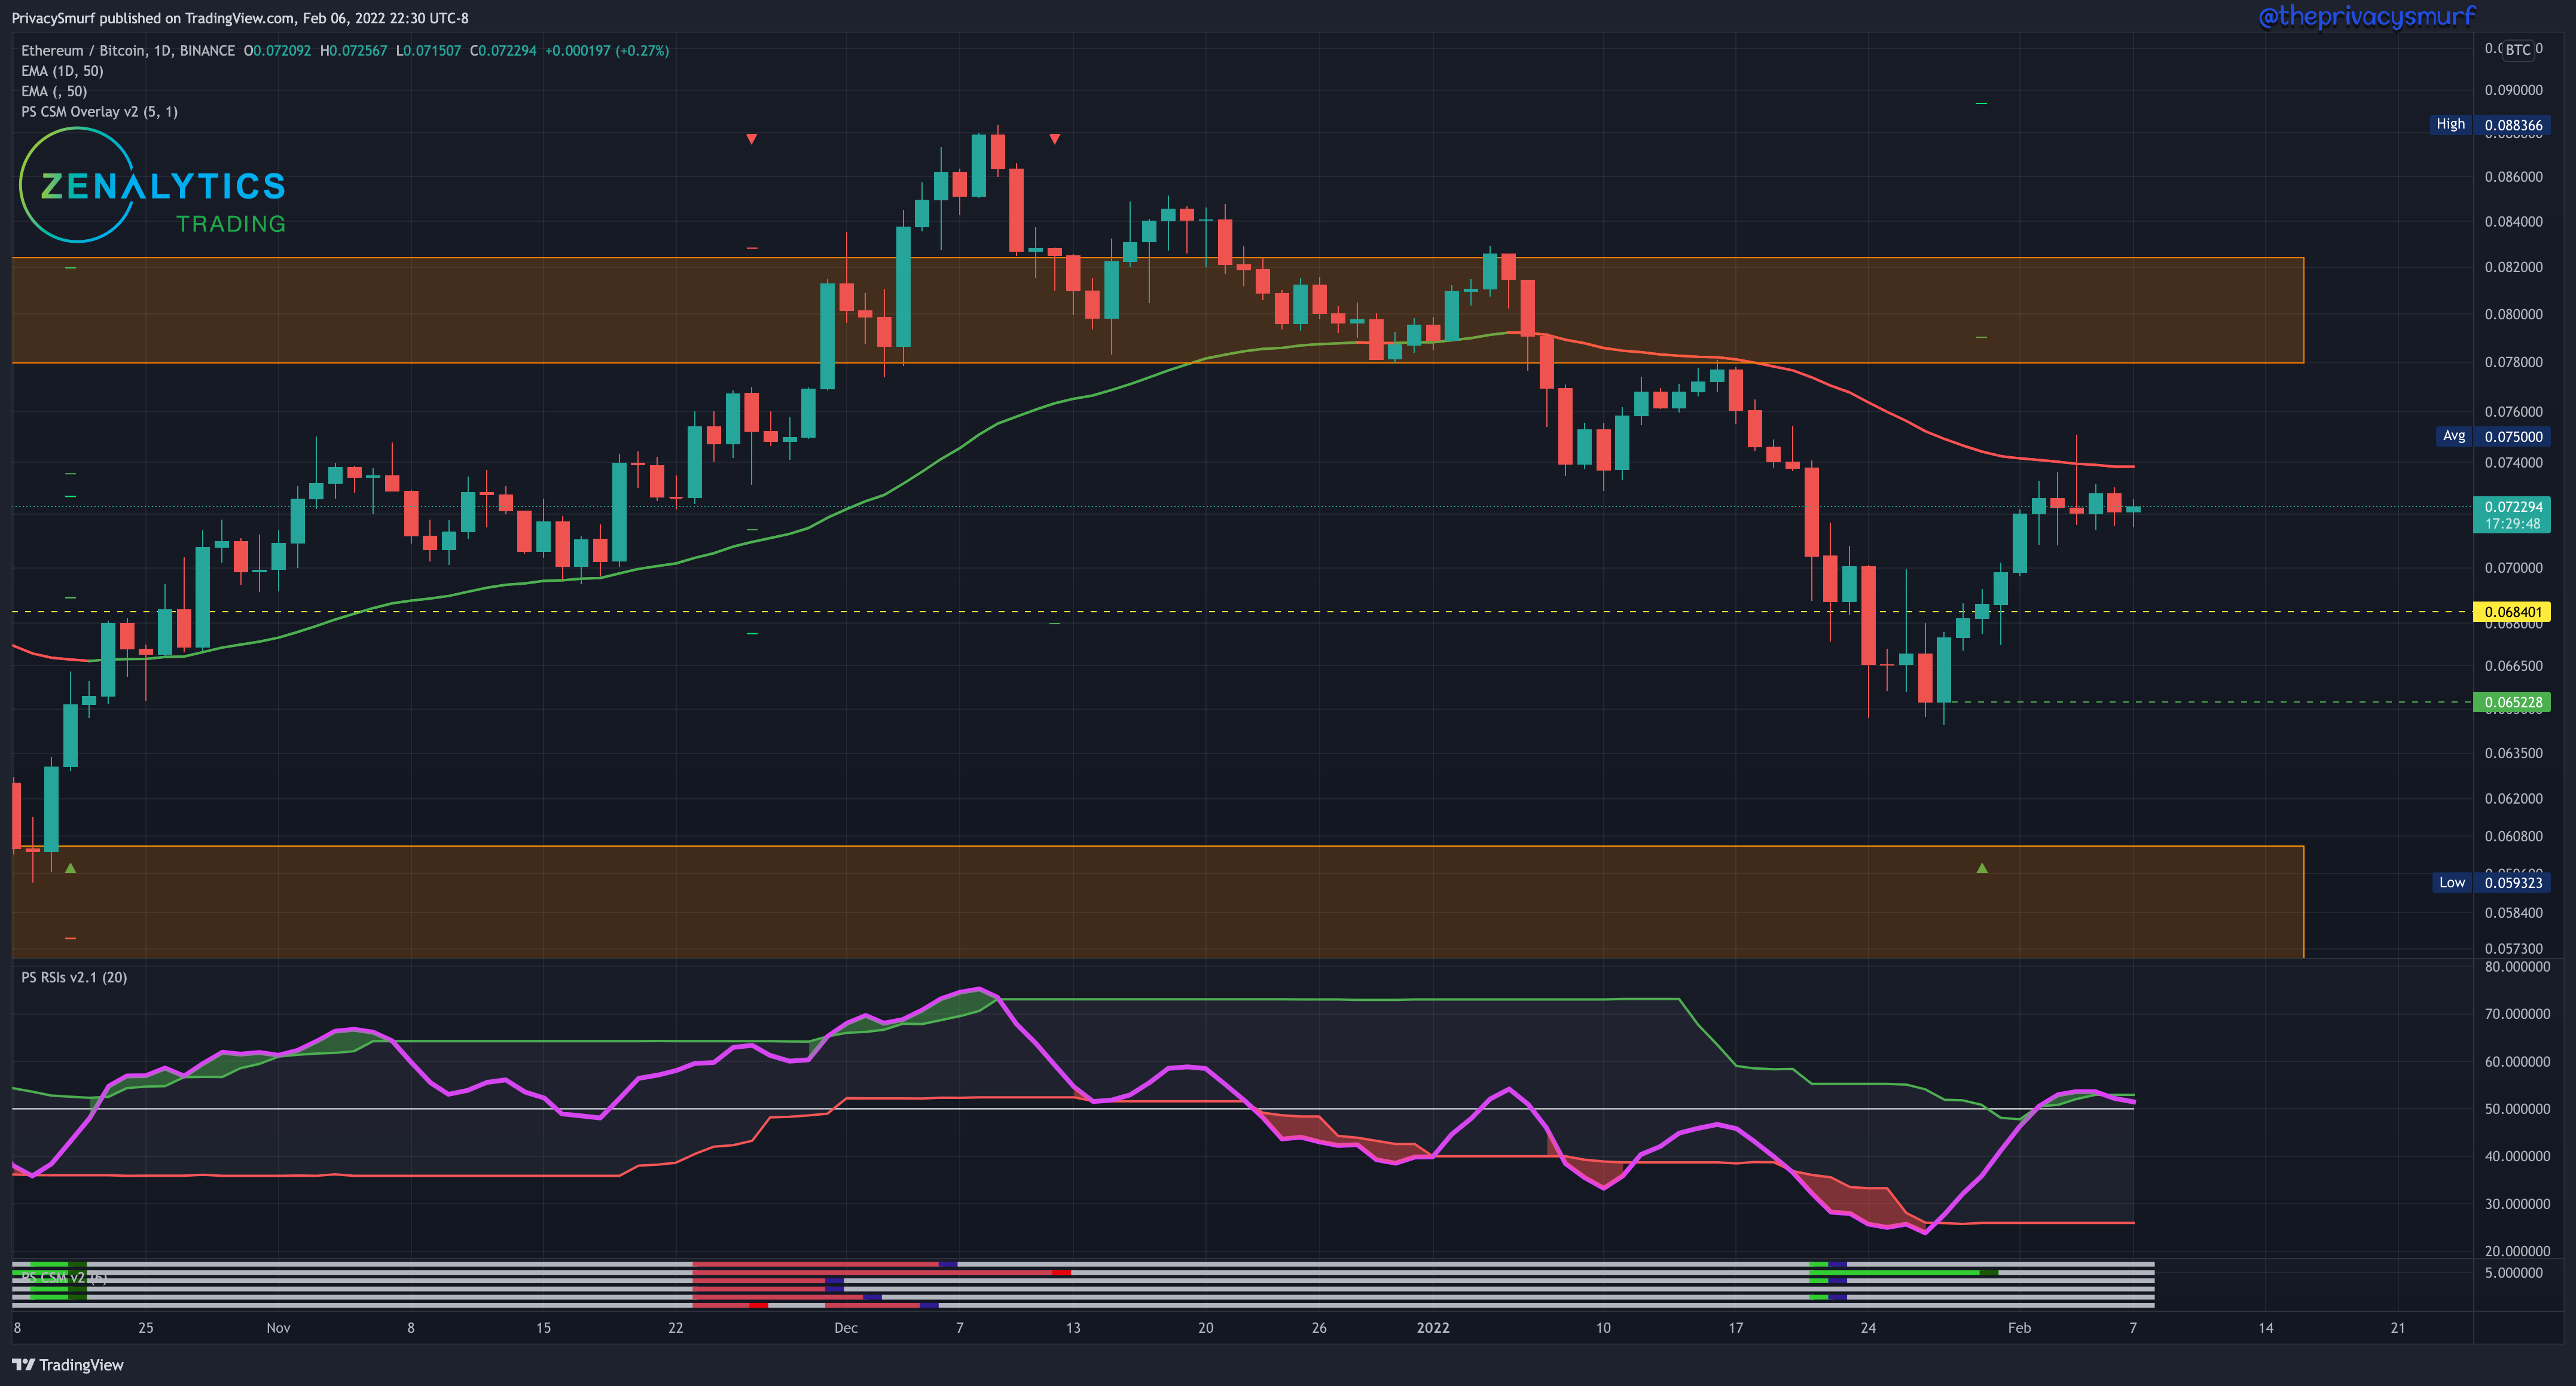
On the daily chart, the range low test never came and we made it straight up to the range high. The 50-Day EMA is again acting as resistance against the price. A test of the 0.068 mark wouldn’t be out of the picture. A support bounce there or a break and test of the 50-Day EMA may be a moment of ETH gaining on BTC in short term. If the ETH gets a boost of volume that BTC doesn’t and the EMA is broken above 0.078 will be the start of the resistance. There’s also a bullish divergence profit target around 0.078 from the trade trigger (green up arrow in the range floor zone) late last month on the Smurf Correction Strength Meter.
ETH/USDT Weekly Structure
https://www.tradingview.com/chart/JPTp0aXw/
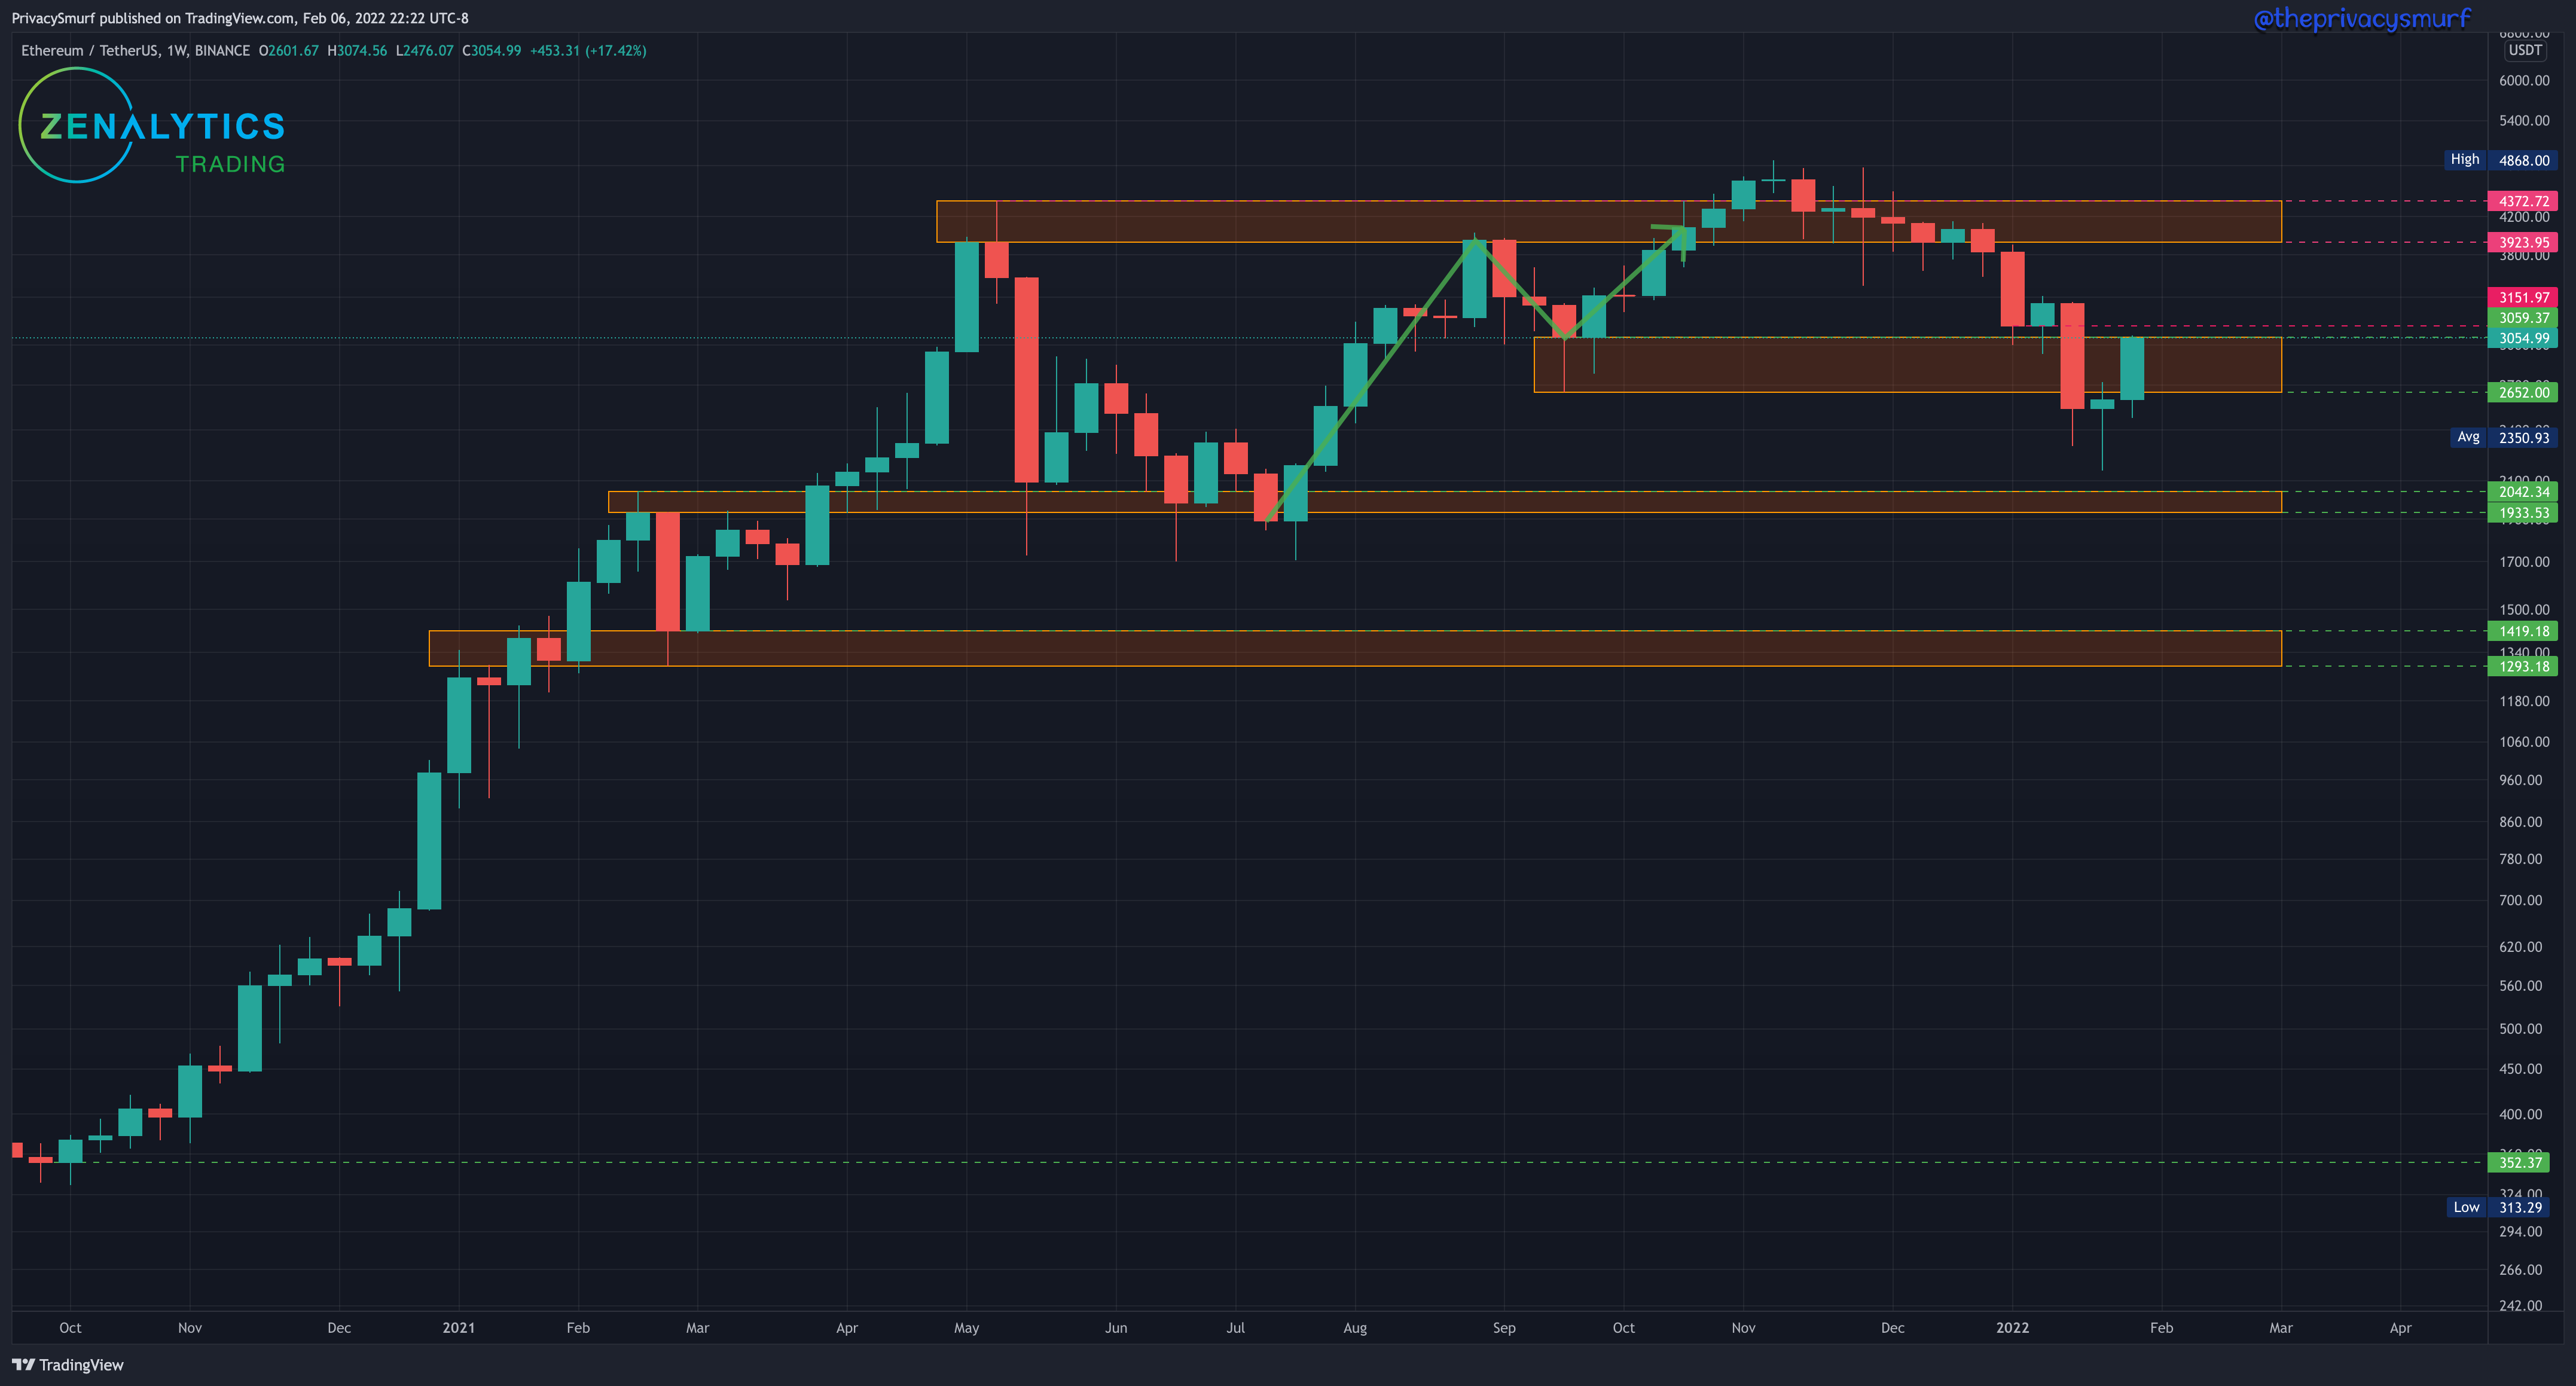
I should start ‘negging’ the charts in italics more often. ETH weekly just scraped above the ceiling high to close at $3059. There is a reversal candle pattern also worth an honorable mention here.
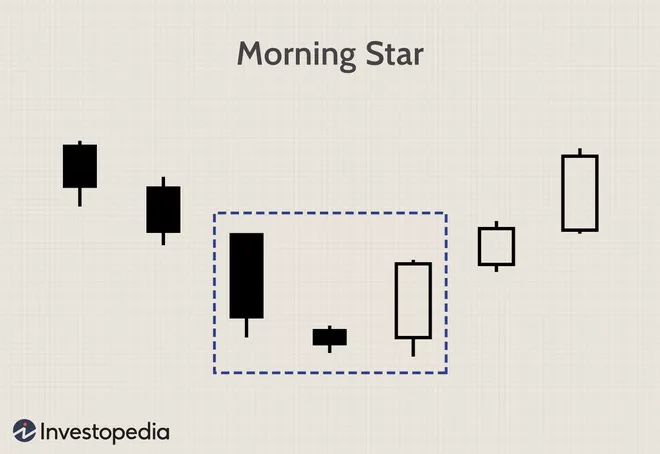
We may see yet another bullish week, but support tests may be on the horizon on the daily chart.
ETH/USDT Daily Chart
https://www.tradingview.com/chart/xbB6lkZu/
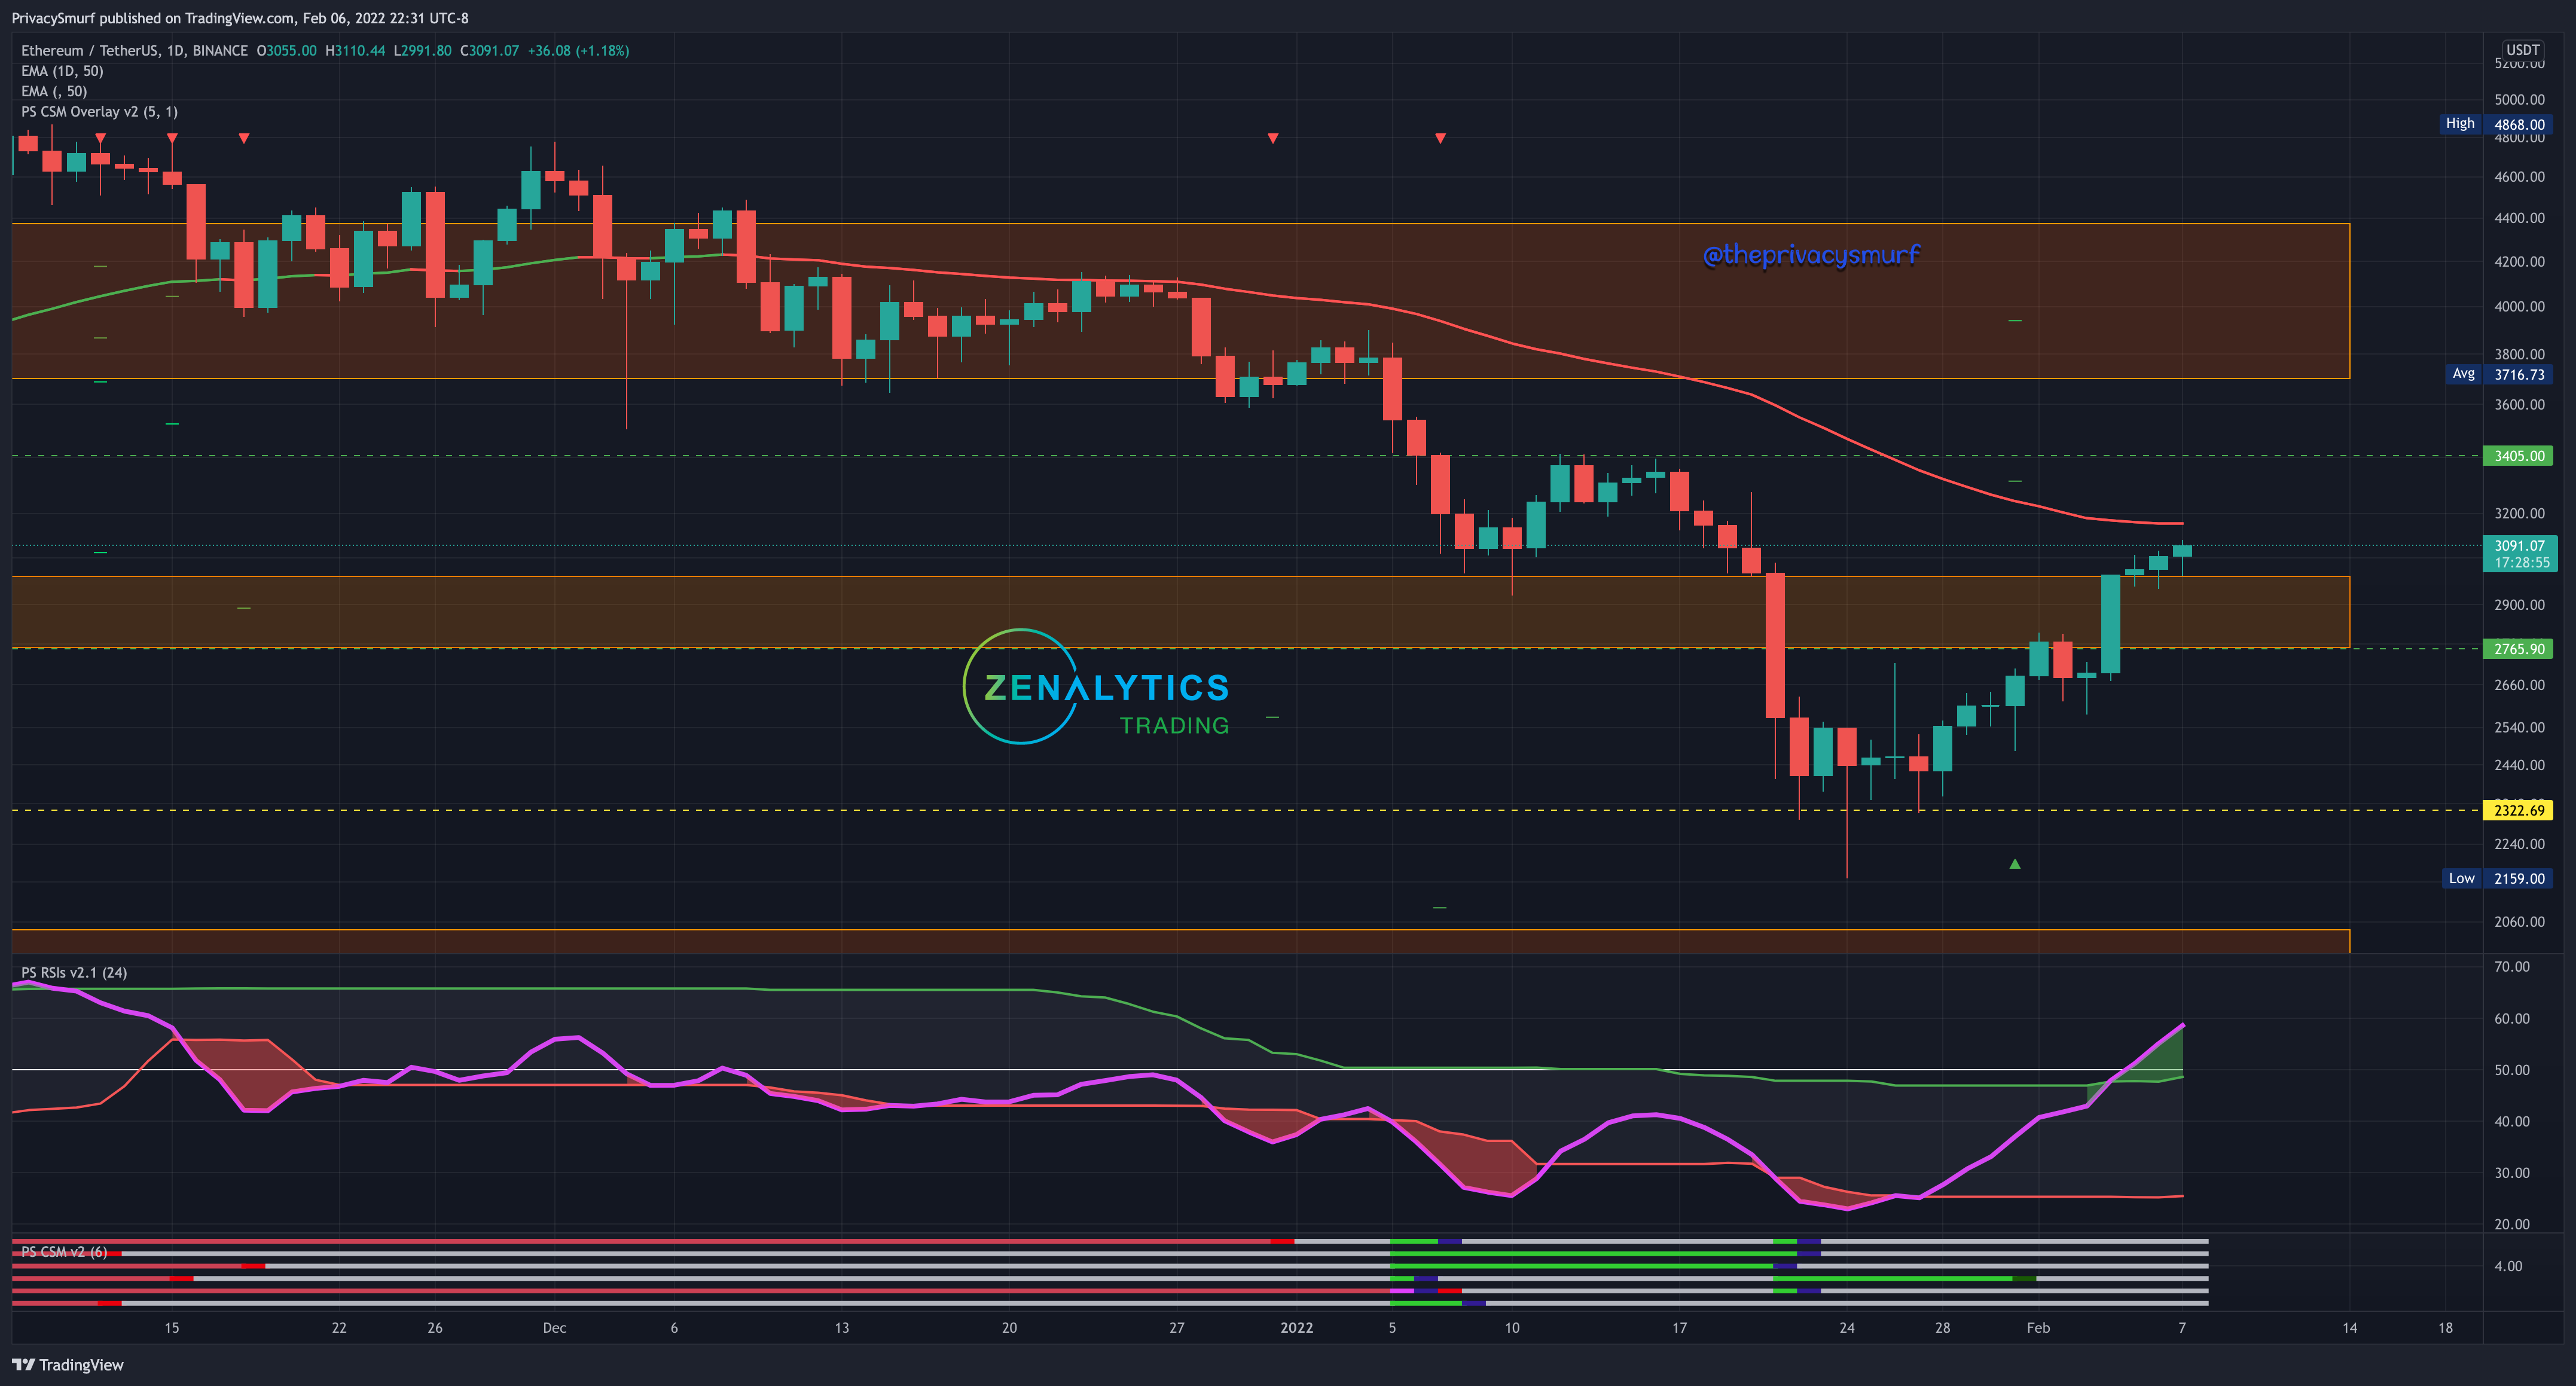
Yeah.. I know. My Twitter handle and logo are all jacked up. Copy-paste fail with the image editor. It’s late now and I’m just not gonna redo it. Sorry.
The suggested range on the daily chart held here until the late week volume blew up through the ceiling and ended at the 50-Day EMA resistance. Same as BTC here, I’d be expecting resistance at the EMA and a test of the new support going down as low as $2700 Any bounce of support I’d be looking to buy for my 3-8 month positions. An EMA break and resistance will show at $3405. If the price manages to break the EMA first I’d expect some consolidation below $3405 and above the EMA which could lead to some volatility.
We are back to the closed paid posts now so if you enjoyed the content over the week you’ll need to hop on over to the paid side of the newsletter. I did not get to my video about oscillators last week but I’ll send that out this week free to everyone.
I’m crafting a better explanation of my cycle theory for a post as well. Every tweet by Benjamin Cowen about lengthening cycles, I swear, it feels like a taunt, LOL.|
I know these are just BTC and ETH charts but they will be similarly represented in MANY altcoins. If the charts and oscillators look similar, you can likely expect similar reactions to the support/resistance levels and moving averages.
I hope you have a good week.
@theprivacysmurf